Occupational Diseases and Environmental Medicine
Vol.2 No.3(2014), Article
ID:48893,7
pages
DOI:10.4236/odem.2014.23006
Indoor Pollution in Work Office: VOCs, Formaldehyde and Ozone by Printer
Elena Barrese, Angela Gioffrè, Marialuisa Scarpelli, Donatella Turbante, Roberto Trovato, Sergio Iavicoli
INAIL Research Center, Lamezia Terme, Italy
Email: e.barrese@inail.it
Copyright © 2014 by authors and Scientific Research Publishing Inc.
This work is licensed under the Creative Commons Attribution International License (CC BY).
http://creativecommons.org/licenses/by/4.0/


Received 5 June 2014; revised 17 July 2014; accepted 3 August 2014
ABSTRACT
In recent years proof of “indoor air quality”, designed to protect and improve the health and safety of workers, was a central strategy in the prevention of many companies. The man creates with the environment in which he lives and works a continuous gas exchange through breathing; this makes the respiratory system main entrance of air pollutants. The indoor pollutants are numerous and originate from different sources. Their concentration may vary over time and depends on the nature of the source, on ventilation, habits and activities carried out by the occupants in the areas concerned. It is well known that photocopiers and laser printers are equipment that emit several chemicals (ozone, solvents, toner dust) both to release the materials used for their operation (toner, ink, paper) and then to the special printing technology used. During the printing and photocopying processes occurring chemical and physical processes complex, during which the components of toner and paper will react under the influence of light and high temperatures. More recently, there have been a growing number of articles as a result of indoor air pollution. They have become more and more significant; probably because of increasing of the concentrations of harmful substances in the confined environment. Particular attention has been given to the emission of harmful substances from electronic equipment and printing that are increasingly present in living and working place. This work was the main objective the emission of volatile organic compounds, formaldehyde and ozone from laser printing devices and consequently the estimation of elimination of same substances through a paper filters which operate through a mechanism of filtration surface with interstitial and penetration of particles into matrix filter on agglomeration, they also enclose type sandwich a layer of activated carbon.
Keywords:Indoor Air, VOCs, Formaldehyde and Ozone, Laser Printers

1. Introduction
The indoor air quality (IAQ) [1] [2] depends on the concentration of pollutants released to air in relation to the dilution factor determined by replacement with fresh air. The indoor pollutants are capable of affecting human health in a multitude of ways (from discomfort felt a sensory level to the serious ailments of the state of health), depending on the contaminant. There are literally thousands of air contaminants, each having varying effects on the human body. From a World Health Organization (WHO) estimation [3] , it appears that a large percentage of buildings, in developed countries, have a high levels of toxic indoor air contaminants. Indeed, one of the causes of the occurrence of certain illness (allergies, poisoning, migraines, cancer, etc.) seems to lie in the degree of pollution present in the environments in which normally spends most of the day.
Problems in the indoor air of workplaces are issues which occupational health care often needs to consider when evaluating the health risks of a work environment, but, for the time being, there is very little information on the causal relations of indoor air problems and the mechanisms behind them. There is a growing research interest on the part of occupational hygienists, air quality in confined spaces, because the advent of electronic devices in office environments has improved the efficiency of the work at the expense of air quality. The increasingly widespread use of photocopiers and printers has been associated with the building sick syndrome (SBS) [4] and their use is a major source of risk to be considered for an adequate assessment of chemical risk in the workplace. Australian scientific research [5] , published in the journal of American Chemical Society, says that working next to a printer or copier in operation, it is equivalent to inhale cigarette smoke or to breathe exhaust fumes of traffic jam, for our lungs there is little difference.
Some studies indicate that many volatile organic compounds (VOCs) [6] [7] , formaldehyde and ozone are emitted during the operation of photocopiers and laser printers, compromising the indoor air quality. The quality and quantity of substances emitted are determined by the technical process, the type of toner and paper used by the model and age of equipment, maintenance and environmental conditions [8] .
The present work aims to contribute, through an initial learning phase, to the quantitative characterization of VOCs, formaldehyde and ozone emitted from a single laser printer, with and without a filtering system, in a “room service” of a office, which was so named because of in addition to laser printer technology under study, contains other electronic devices commonly used to all staff. The above room has a volume of 13 m3, no system of forced ventilation and its only opening is a door that looks into a hall and it is the only system of exchange of air. The filtering system used consists of filter paper containing, sandwich type, activated carbon, these filters operate by a mechanism of filtration surface and interstitial penetration of particles within the filter matrix. Furthermore the study aims to carry out subsequent assessments of emissions from equipment of the printing, in order to determine another forms of reduction for pollutants studies in indoor environments and to improve the physical well-being and quality of life in the workplace.
2. Materials and Methods
2.1. VOCs
The name Volatile Organic Compounds (VOC) specifies a set of substances in liquid or vapour, with a boiling point ranging from a lower limit of 50˚C - 100˚C to an upper limit of 240˚C - 260˚C. The term “volatile” is precisely the ability of these chemicals to evaporate easily at room temperature. The compounds of this category are more than 300.
VOCs can cause a wide variety of effects ranging from discomfort to a serious deterioration of health status. High concentrations of some VOCs detected in indoor air may cause effects towards several human organs or systems, particularly of central nervous system.
It is, however, concentrations generally much higher than those found in indoor environments.
Sampling for monitoring volatile organic compounds was performed in the following conditions:
• Analysis of the working environment (baseline).
• Analysis performed during printing in standard conditions for thirty minutes and for a number of prints equal to five hundred, without filtering system (WOF) to estimate the environmental conditions in the presence of a printer on.
• Analysis performed during printing in standard conditions for thirty minutes and for a number of prints equal to five hundred, with a filtering system (WF) to estimate environmental conditions in the presence of a printer on.
To determine VOCs was used the method NIOSH - HYDROCARBONS, BP 36˚C - 126˚C: METHOD 1500 Issue 2 [9] .
Have been used active samplers SKC, using such systems to capture, vials activated carbon (length 70 mm, outer diameter 6 mm) with the section main/secondary 100/50 mg. The laboratory analysis was performed via gas chromatography using the FID as detector.
2.2. Formaldehyde
It is a colourless gas with a strong odour at room temperature and it is a type of volatile organic compound (VOC) that is a common indoor air pollutant. It combines and reacts with other organic products present in indoor whose effects are not fully known, as also highly soluble in water it is irritating to eyes and to mucous membranes of the first of the respiratory tract as early as the concentration of 0.1 ppm.
The study has executed the characterization of formaldehyde and next its quantitative determination in the indoor air of a “service room” of the monitored office containing a laser printer. The room only have a door, overlooks a corridor, the door only is exchanging air system.
For the monitoring and analysis of formaldehyde was used the method 2016 of the National Institute for Occupational Safety and Health (NIOSH) [10] , that we have modified. It provides a sampling on vials of silica gel impregnated with 2.4 dinitrophenylhydrazine and subsequent analysis, after elution with acetonitrile, in High Performance Liquid Chromatography (HPLC).
The experimental design of this study included three sequence steps:
(1) monitoring formaldehyde’s concentrations during 30 minutes of printing without filtering system (WOF) (2) monitoring formaldehyde’s concentrations during 30 minutes of printing with filtering system (WF); (3) comparison between average values collected in steps one and two. The first and the second steps are always carried out on different days. The monitoring, provided for in the first two stages, are always carried out on different days to ensure, as far as possible, a wash, even natural, in-room, we had occasion to consider checking the baseline values before each observation.
2.3. Ozone
It is a colourless and odourless gas, highly unstable which presents a serious air quality problem. Although ozone is naturally produced in the atmosphere (the stratosphere), at ground-level, it is an air pollutant that can harm human health. Even at low levels, ozone can cause a number of respiratory effects [11] [12] .
Indoor ozone concentration depends from numerous factors; it vary widely internal surface composition (e.g., rugs, draperies, furniture, etc.) [13] .
Some international organizations have indicated the values over which ozone molecule can cause a variety of health effects. For example, the US Food and Drug Administration (FDA) has established an ozone level of 0.05 ppm as the maximum level allowed in a closed environment (homes, offices and public places) [14] . The Occupational Safety and Health Administration (OSHA) requires that workers are not exposed to a concentration exceeding the 0.10 ppm for 8 hours. The National Institute of Occupational Safety and Health (NIOSH) recommends a maximum of 0.10 ppm. EPA indicates that human exposure to levels of ozone, between 80 and 160 ppb, can cause a variety of health effects with symptoms such as cough, irritation of the eyes and throat (US EPA, 1996) [15] [16] . The American Conference of Governmental Industrial Hygienists (ACGIH) lists the values of the TLV-TWA, in relation to the type of work, 0.01 ppm (light work), 0.08 ppm (moderate work), 0.05 ppm (heavy work).
For all tests, ozone concentrations were measured with an Environment S.A. 42M Ozone analyzer, based on the absorption of UV radiation at 253.7 nm by ozone molecules. The readings were made in the presence and in the absence of printing, with and without a filtering system.
Hence the indoor ozone concentration can vary from day-to-day and room-to-room, the emissions of ozone from a laser printer have been studying in a single room of operating office equipment (personal computers, one photocopier, and two laser printer). Each test of measure was effectuated with and without the blow-down system. It has been found that the laser printers emits significant amounts of ozone, but the ozone concentration was reduced with the use of blowdown system.
3. Results and Discussion
3.1. VOCs
As regarding the emission of volatile organic compounds, the comparison between the average baseline (in absence of printing) obtained, with those acquired during printing, without filtering system (WOF) (Figure 1), tests an increase of mean concentration of volatile organic compounds. By comparison the average concentration acquired without the use of this system (WOF) and with the use of the filtering system (WF), it shows that the amount of volatile organic compounds emitted is reduced. The results show that this filtering system is suitable for lowering of VOCs emissions.
3.2. Formaldehyde
As can be seen, from the values reported in the Table 1, also the highest concentration detected falls in the range of values of threshold for the perception of odours (0.06 - 1.2 mg/m3) and the threshold for eyes irritation (0.01 - 1.9 mg/m3). We can also observe a random distribution of formaldehyde’s concentrations emitted from the laser printer in study, Figure 2.
As shown in Figure 3, there is no difference between values measured in the presence (WF) and in the absence (WOF) of filter, how, instead we would have expected.
Evaluating the results obtained from monitoring were taken into account two important issues: the limit established by the American Conference of Industrial Hygienists (ACGIH) of 0.37 mg/m3 [9] as a Treshold Ceiling Limit Values (TLV-C) (it is a “threshold” value, which should not be exceeded even for an instant); the World Health Organization has set a threshold of air quality for formaldehyde of 0.1 mg/m3 (on 30 minutes of sampling) in indoor environments specifying that a concentration of 0.3 mg/m3 causes a significant increase in the irritant effects in healthy subjects.
The environmental sampling conducted show all values below the TLV-C of formaldehyde, proposed by the ACGIH, but also below the limit proposed by the WHO.
It may be also noted that the baseline (BL) values measured fall around the maximum of the range 0.02 ÷ 0.06 mg/m3 representative levels of formaldehyde measured inside homes.
Moreover by comparison between the average values of the concentrations measured in the presence of the filtering system, and failing that, we can determine that this filtering system is not suitable lowering of formaldehyde’s concentration.
3.3. Ozone
The results of ozone tests obtained are shown in Figure 4.
The graph shows the values of the baseline (BF 1), followed by a first measure with the filtering system (WF),
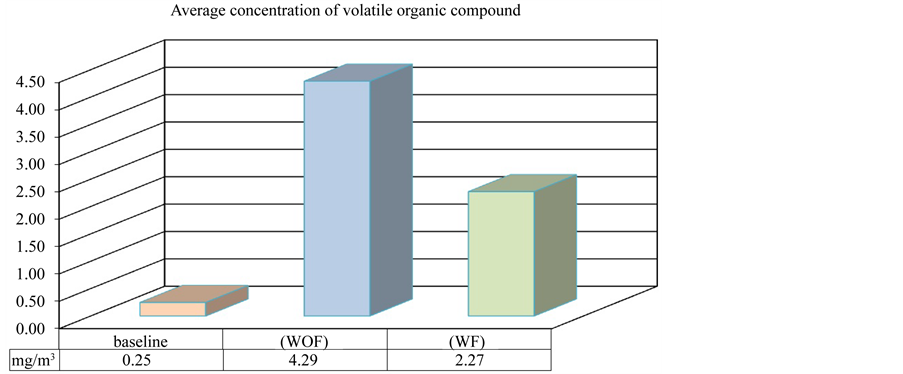
Figure 1. Average concentration of volatile organic compound.

Table 1. Concentrations (mg/m3) of Formaldehyde With system Filtering (WF) and WithOut Filtering system (WOF), average values of concentration and baseline (BL).
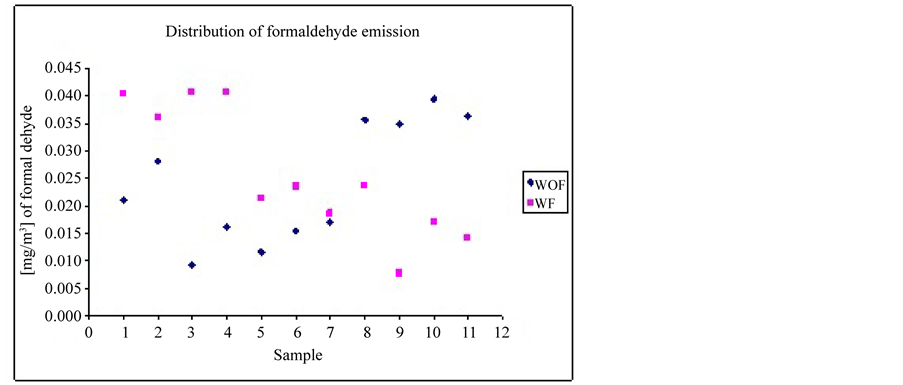
Figure 2. Distribution of concentrations of formaldehyde measured and WithOut Filtering system (WOF).
a second measure of baseline (BF2), a subsequent measurement without filtering system (WOF), finally a third measure of baseline (BF3) was carried out.
In fact, under normal conditions the half life time of ozone is about 10 min and it is determined mainly by changes of air and temperature.
As shown in Figure 4, the values of Baseline 1, determined initially, are quite stable and the range is between 15 and 20 ppb. The following monitoring was carried out during printing, with filtering system. Compared to baseline it is evident an increase of ozone’s concentration. After a few minutes, a measure of ozone shows a return of the values to initial concentrations (Baseline 2). It was done a measure during a second printing, without filtering system. The results are clearly in evidence: the values of ozone increased significantly, reaching values
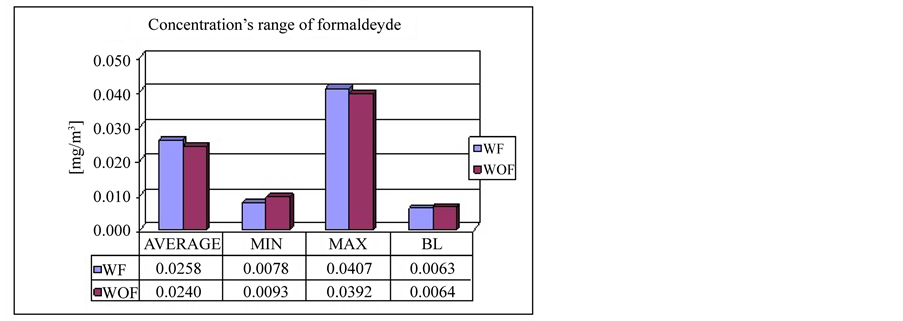
Figure 3. Range of concentrations of formaldehyde measured with filtering system (WF) and WithOut Filtering system (WOF) representation of the average values of concentration and baseline (BL).
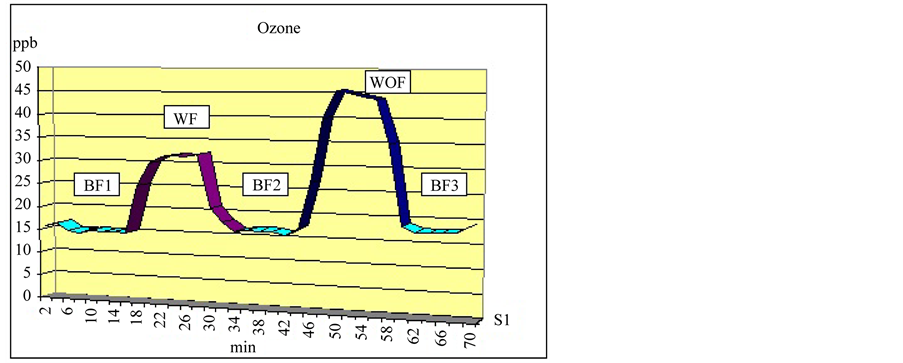
Figure 4. The values have been averaged by the instrument every 2 minutes.
around 45 - 50 ppb. Finally it was made last measure of the concentration of ozone in the absence of printing (Baseline 3) further confirms the re-establishment of the values monitored initially.
4. Conclusions
In conclusion, at this early learning phase of our study, it has been found that the laser printers emit significant amounts of ozone and VOCs, but their concentrations decreases using the filtering system considered in this work; while this filtering system is able to break down partially their emission, the formaldehyde risk during printing work, in both cases (WOF and WO), is restricted. We must, however, stress that the limit values of occupational exposure are not a secure limit between “dangerous” and “harmless” concentrations and health disorders, even when the limit values are respected, it cannot be excluded.
To break down the concentration of VOCs and ozone present in confined environments, it should essentially eliminate the principal source; it is always advisable to use products and materials with a low content of volatile organic compounds. Where possible, it should also facilitate ventilation and frequent aeration of the rooms.
References
- Destaillats, H., et al. (2008) Indoor Pollutants Emitted by Office Equipment: A Review of Reported Data and Information Needs. Atmospheric Environment, 42, 1371-1388. http://dx.doi.org/10.1016/j.atmosenv.2007.10.080
- Accusani di Ritorto, E. (2007) Gli studi sulla qualità dell’aria negli ambienti confinati I principali inquinanti chimici degli ambienti interni. Formaldeide [on line] URL: http://www.minerva.unito.it/Chimica&Industria/MonitoraggioAmbientale/A4/Confinati6.htm
- WHO (World Health Organization). Air Quality Guidelines for Europe. Copenhagen: WHO 1987 Regional Publications, European Series, 23.
- European Concerted Action. Indoor Air Quality & Its Impact on Man. COST Project 613. Environment and Quality of Life. Report N. 4. Sick Building Syndrome—A Practical Guide. Commission of the European Communities. Office for Publications of the European Communities, Luxembourg 1989.
- Morawska, L., et al. (2007) Printer Particle Emissions Add up, New Findings Underscore the Effects of Indoor Air on Human Health. Environmental Science & Technology.
- Lee, C.W., Dai, Y.T., Chien, C.H. and Hsu, D.J. (2006) Characteristics and Health Impacts of Volatile Organic Compounds in Photocopy Centers. Environmental Research, 100, 139-149. http://dx.doi.org/10.1016/j.envres.2005.05.003
- Evers, U. and Nowak, D. (2006) Erkrankungen durch Emissionen aus Laserdruckern und Kopierger?ten? Gefahrstoffe - Reinhaltung der Luft, 66, 203-210.�
- Hetes, R., Moore, M. and Northelm, C. (1995) Office Equipment: Design, Indoor Air Emissions, and Pollution Prevention Opportunities. US EPA Project Summary, EPA/600/SR-95/045; Research Triangle Park, North Carolina.
- NIOSH Method 1500, Issue 2: Hydrocarbons, 36-126 °c BP. 15/08/1994.
- NIOSH, Manual of Analytical Methods: Formaldehyde, Method 2016, January 1998 Issue 1, Fourth Edition.
- Weschler, C.J. (2000) Ozone in Indoor Environments: Concentration and Chemistry. Indoor Air, 10, 269-288.
- Kissel, J.C. (1993) Potential Impact of Deliberately Introduced Ozone on Indoor Air Quality. Journal of Exposure Analysis and Environmental Epidemiology, 3, 155-164.
- Sundell, J. and Zuber, A. (1996) Ozone and Other Photochemical Oxidants in Ambient and Indoor Air: Properties, Sources and Concentrations. Scandinavian Journal of Work, Environment & Health, 22, 5-14.
- US Food and Drug Administration (FDA) http://www.fda.gov/
- US Environmental Protection Agency (US EPA) (1996) Air Quality Criteria for Ozone and Related Photochemical Oxidants. National Center for Environmental Assessment-RTP Office, Research Triangle Park, NC, Report Nos. EPA/600/P-93/004aF-cF, 3v. NTIS, Springfield, VA; PB-185582, PB96-185590 and PB96-185608. the Clean Air Act www.epa.gov/air/caa/title1.html#ib
- US Environmental Protection Agency (US EPA) (1996) Review of National Ambient Air Quality Standards for Ozone: Assessment of Scientific and Technical Information. OAQPS Staff Paper. Office of Air Quality Planning and Standards, Research Triangle Park, NC, EPA-452/R-96-007.