Open Journal of Soil Science
Vol.05 No.10(2015), Article ID:60173,15 pages
10.4236/ojss.2015.510021
Tile Drainage and Nitrogen Fertilizer Management Influences on Nitrogen Availability, Losses, and Crop Yields
Rakesh Awale1, Amitava Chatterjee1, Hans Kandel2, Joel K. Ransom2
1Soil Science, North Dakota State University, Fargo, ND, USA
2Plant Sciences, North Dakota State University, Fargo, ND, USA
Email: rakesh.awale@ndsu.edu
Copyright © 2015 by authors and Scientific Research Publishing Inc.
This work is licensed under the Creative Commons Attribution International License (CC BY).
http://creativecommons.org/licenses/by/4.0/


Received 1 September 2015; accepted 6 October 2015; published 9 October 2015
ABSTRACT
Installing tile drainage facilitates early planting and field operations, and tiling has tremendously increased in the Red River Valley (RRV) due to recent wet cycles. This experiment studied tile drainage and N-fertilizer management effects on N availability, N losses, and yields of corn (Zea mays L.) and sugarbeet (Beta vulgaris L.) in a naturally poorly-drained Fargo soil during the 2012-2013 growing seasons. Regardless of drainage, applying 146 kg N ha−1 with nitrapyrin resulted similar soil N availability to 180 kg N ha−1 without nitrapyrin in sugarbeet in both years. In corn, application of nitrapyrin resulted either higher or similar soil N levels to split-N application. In 2013, application of urea alone increased soil N availability during the early corn growing season under the undrained condition, whereas nitrapyrin delayed N release in the tile-drained soils. Corn and sugarbeet yields averaged 7.4 and 47.0 Mg∙ha−1 in 2012, and averaged 8.3 and 38.3 Mg∙ha−1 in 2013, respectively, with no significant differences among N-sources. However, corn yield increased on an average by 27.6% with N-fertilizer application over unfertilized control in 2013. In 2012, sugarbeet root impurity (% sucrose loss to molasses) increased by 13.8% and 17.2% with 146 kg N ha−1 plus nitrapyrin and 180 kg N ha−1 treatments, respectively, compared to unfertilized control. Besides, higher N rates were usually associated with greater daily soil N2O emissions, with the maximum flux of 105 g N2O-N ha−1∙d−1 recorded under corn. Addition of fertilizer-N increased NH3 volatilization losses up to 1.9% and 0.5% of the applied-N in corn and sugarbeet, respectively. Tile drainage influenced soil N availability more than crop yield during two years of study. Nitrogen management can have pronounced effects on N availability and losses. A long-term study is needed to investigate the fertilizer-N use efficiency of crops under tile drainage condition.
Keywords:
Subsurface Drainage, Nitrogen, Nitrous Oxide, Ammonia Volatilization, Nitrate Leaching

1. Introduction
About 1.8 million hectares of soils in the RRV of North Dakota and northern Minnesota are naturally poorly drained [1] , which has led to increased adoption of subsurface tile drainage [2] . Tile drainage can provide agronomic benefits through the gravimetric water removal, improved trafficability, and timeliness of field operations [3] . However, shifting water regimes influences below ground N dynamics through changes in soil moisture and temperature [4] .
Soil water content has significant influence on N mineralization rates [5] . Tile drainage can accelerate soil N mineralization by improving soil aeration [6] . Optimum N rates for crop production can vary greatly among years based on N mineralization rates and possible N losses [7] . Fertilizer-N recommendations are usually based on the amount of N available at the beginning of growing season. However, in soils with high organic matter, a substantial amount of soil N mineralization is deemed possible during the crop growing season, which is less considered by the growers [8] . Therefore, monitoring mineral N contents in soils during the growing season can improve our knowledge on N availability to crops.
Denitrification losses of applied N increase with soil water content because of root-zone oxygen reduction through displacement of soil air by water [9] . Installing tile drainage can eliminate the chance of water logging by lowering the water table, and thereby, the denitrification N losses [10] . Apart from soil aeration, the availability of inorganic N substrates is also an important factor that controls the dynamics of soil nitrous oxide (N2O) emissions [11] . Denitrification loss of N2O from agricultural soils increases with N-application rates [12] . Large pulses of N2O productions at times immediately following fertilizer N application and/or heavy rainfall events are not uncommon [9] - [12] .
Tile drainage has potential to reduce denitrification loss of N2O. However, nitrate ( ) leaching could be a major concern in tile-drained soils [13] . Annual rainfall, crop yield variations, and soil and nutrient management, in part or combination, govern
 leaching loss [14] . Greater N losses to subsurface drains are observed in years following a drought due to greater residual N in the soil profile [3] [13] .
Tile drainage can also influence ammonia (NH3) volatilization by changing soil water and temperature regimes, and/or influencing N substrate availability; however, the extent of control mechanism is still not understood [10] . Ammonia volatilization is a major N loss pathways associated with the use of surface applied
 based fertilizers [12] . Soil water regimes have a strong impact on the
 transport through profile and subsequently on the availability of
 substrate for NH3 volatilization [15] . Using tile drainage to lower soil water table provides surface soil water with more volume to percolate down the soil profile that can incorporate fertilizer N into the soil, resulting in low NH3 volatilization [16] . Conversely, tile drainage may increase NH3 volatilization by maintaining the soil water content at field capacity [17] .
Soil N supply is essential for crop yield and quality [18] . Insufficient N limits crop yield, but excessive amounts of N can deteriorate air and water quality [12] - [15] . Application of fertilizer-N has generally shown to increase crop yields but it also increases N losses via N2O emissions, NO3 leaching, and NH3 volatilization, especially when fertilizer-N is applied in excess of crop requirements [12] . Application of commercial nitrification inhibitor compounds such as nitrapyrin (NP) delay
 oxidation to
 , and increase N availability to the crops during the periods of rapid crop N uptake [19] . Application of N fertilizers in split doses could be another approach to co-ordinate maximum crop N uptake [18] . Reducing the availability of inorganic N in soils when crop N requirement is small, N-inhibitors and split N application have the potential to increase N use efficiency and yields of crops, while minimizing potential N losses [8] [12] [14] [20] .
Balancing the amount of N required for optimum crop growth while minimizing potential N losses under tile drainage conditions is a major challenge in the RRV. Simultaneous measurements of crop yields, N availability, and N losses as influenced by interaction of N management and tile drainage have not been intensively studied in the RRV. We hypothesize that crop yields would be increased under tile drainage condition due to increase in the N availability under favorable soil water level. Main objectives of this field experiment were to determine tile drainage and fertilizer-N management practices effect on (i) corn and sugarbeet yields, (ii) changes in the soil N availability (iii) denitrification loss of N in the form of N2O, (iv) soil solution
 concentration at 60 cm soil depth, and (v) NH3 volatilization loss of N in a poorly drained Fargo silty clay soil.
2. Materials and Methods
2.1. Description of Experimental Site
Field experiments were located at North Dakota State University research site (46.93˚N, 96.85˚W) near Fargo, North Dakota, USA. Broadly, the site has Fargo silty clay soil and is classified as Fine, smectitic, frigid Typic Epiaquerts with 0% - 1% slope [21] . Subsurface drainage tiles were installed at the 2.5 ha experimental area in 2008. The area was divided into eight units of 61 m long by 54 m wide, each unitconsisted of seven lateral subsurface drainage tile lines. Tile lines of 10 cm in diameter were installed at a depth of 90 cm with a spacing of 7.6 m, and with a drainage coefficient of 7.5 mm∙d−1.
Each unit was controlled via a water table control structure (Agri-Drain Corp, Adair, IA, USA). Four of the units had the control structures open to represent subsurface drainage and the remaining four units had the control structures closed to represent undrained field conditions.
2.2. Field Experiments and Experimental Design
At the experimental site, corn and sugarbeet were grown during the 2012-2013 growing seasons. A randomized complete block design was used with four replicates in a split-plot arrangement with drainage (undrained and tile-drained) as the main plot factors and N fertilizer management as the sub plot factors in each crop for both years. For corn, the N treatments in 2012 were (i) 180 kg N ha−1 applied at preplant as urea (Urea180), (ii) 224 kg N ha−1 at preplant as urea (Urea224), (iii) 224 kg N ha−1 at preplant as urea plus nitrapyrin (Urea224 + NP), (iv) 112 kg N ha−1 at preplant as urea plus 112 kg N ha−1 at 6 leaf stage as urea ammonium nitrate (UAN) [Split (Urea112 + UAN112)]. The N-rates of 180 kg N ha−1 and 224 kg N ha−1 were selected on the basis of corn yield goals of 8.4 and 10.4 Mg∙ha−1, respectively, within this region [22] . In 2013, the N-rate was lowered to 134 kg N ha−1 considering residual soil N from fall soil test results, soybean N credits and corn N requirement for the yield goal of 10.4 Mg∙ha−1. The N treatments for corn in 2013 were (i) control (0 N), (ii) 134 kg N ha−1 at preplant as urea (Urea224), (iii) 134 kg N ha−1 at preplant as urea plus nitrapyrin (Urea134 + NP), (iv) 67 kg N ha−1 at preplant as urea plus 67 kg N ha−1 at 6 leaf stage as UAN [Split (Urea67 + UAN67)] in 2013. For sugarbeet, the N management included (i) control (0 N), (ii) 146 kg N ha−1 at preplant as urea (Urea146), (iii) 146 kg N ha−1 at preplant as urea plus nitrapyrin (Urea146 + NP), and (iv) 180 kg N ha−1 at preplant as urea (Urea180) in both years. The N-rate of 146 kg∙ha−1 is considered as the recommended N-rate for sugarbeet production within this region [22] .
2.3. Field Operations
During 2012 and 2013 growing seasons, corn was planted in the experimental field sections that were under soybean in the previous years. The plots were cultivated to a depth of 7.6 cm once in the fall following the harvest of soybean, and again in the spring before planting corn with a one-pass field cultivator. The preplant urea fertilizers were uniformly broadcasted by hand and incorporated immediately with the field cultivator on April 26 in 2012 and on May 15 in 2013. The nitrification inhibitor nitrapyrin (trade name Instinct, 17.6% by weight active ingredient solution, DOW AgroSciences LLC, IN, USA) was mixed with urea and applied to the soil, based on an area basis at the rate of 2.5 L∙ha−1 (450 g a.i. ha−1). Corn hybrid PH-8640 RIB (DuPont Pioneer, IA, USA) was planted on April 30 in 2012 and on May 15 in 2013 at the rate of 88000 seeds ha−1 with a 1010 John Deere seed planter (John Deere, Moline, IL, USA). The seeds were placed 3.8 cm deep with 15 cm in-row (seed to seed) spacing and 76 cm between-rows (row to row) spacing, such that four corn rows were included in an individual corn plot size of 6.1 m long by 3.0 m wide. For the split N treatments, the UAN was side-dress applied on June 4 in 2012 and on June 18 in 2013. Crops were grown under rainfed condition without any irrigation water inputs. Weeds were controlled using herbicides―applied twice during each corn growing seasons. The first application consisted of amixture of glyphosate (Monsanto, St. Louis, MO, USA] at 1.5 L∙ha−1 + Status (dicamba and diflufenzopyr, and isoxadifen safener) (BASF, Research Triangle Park, NC, USA) at 13.1 g of a.i. ha−1 at V3 (three collar leaf) stage. The second application consisted of glyphosate at 1.5 L∙ha−1 + Luadis (atrazine tembotrione and isoxadifen safener) (Bayer CropSciene LP, Research Triangle Park, NC, USA) at 96 ml of a.i. ha−1 at V7 (seven collar leaf) stage. All of the corn rows were machine harvested after physiological maturity on Oct. 9, and Oct. 24, respectively, in 2012 and 2013. Corn grain yields were determined at the moisture contents of 15.0%.
In 2012, sugarbeets were grown in the field sections previously under corn whereas in 2013, wheat preceded sugarbeets. The required rates of urea fertilizers were uniformly broadcasted by hand on May 10 and May 29, respectively in 2012 and 2013. Nitrapyrin was mixed with urea and applied to the soil, based on an area basis at the rate of 2.5 L∙ha−1. The fertilizers were then incorporated using a Triple K field cultivator with rolling basket. On the same day, sugarbeet variety Crystal 985 Roundup Ready (American Crystal Sugar Company, MN, USA) was planted with a John Deere Max Emerge II planter to an individual sub-plot size of 6.1 m long by 3.4 m wide. The seeds were placed 3.2 cm deep with 56 cm row spacing and 7.6 cm in-row spacing. The plots were thinned manually to maintain a plant population of 156500 plants ha−1 for the first year only. The beets were grown under rainfed condition without any irrigation water inputs. Glyphosate herbicide was applied on June 22 in 2012, and on July 6 in 2013 at 3.5 L∙ha−1. Two middle rows from each plot were machine harvested on Sept. 17 in 2012, whereas the beets were harvested manually (3.1 m long each from two middle rows) on Oct. 24 in 2013. The beets were weighed instantly (gross sugarbeet root yield) and subsamples of the sugarbeet roots were sent to American Crystal Sugar Quality Tare Lab, East Grand Forks, Minnesota, USA for yield determinations and quality analyses. From this data, net sugarbeet root yield was calculated after subtracting the external root impurities (tare %) from the gross sugarbeet root yield. The net sugarbeet root yield hereafter is referred to as sugarbeet (root) yield.
2.4. Basic Soil Properties
Before planting sugarbeets, three soil cores―up to a depth of 120 cm with depth intervals of 0 - 30, 30 - 60, and 60 - 120 cm―were collected using a truck mounted probe (3.6 cm internal diameter) and composited per replicate unit in order to determine initial soil inorganic N levels [23] . Also, separate soil cores (2 cm diameter) were taken from the upper 30 cm soil surface from each individual sugarbeet plots to determine bulk density [24] , organic matter [25] , soil pH and EC [26] , cation exchange capacity [27] , particle size analysis [28] , Olsen-P [29] , and available K [30] . The basic soil physical and chemical properties are presented in Table 1.
2.5. Growing Season Soil Inorganic N Content
After planting, soil samples were collected by hand using a soil probe (2 cm internal diameter) from the upper 30 cm soil profile―with 15 cm increments for both growing season in each crop. In 2012, soil samples were

Table 1. Basic soil characteristics in the surface 0 - 30 cm depth at the experimental site measured in sugarbeet plot during the 2012 and 2013 growing seasons.
†Soil properties measured for 0 - 30 cm soil depth, unless stated; ‡Values are mean ± standard deviations; §Not analyzed.
collected at a monthly interval, whereas soil samples were taken at a bi-weekly interval for the first two months and then at a monthly interval until harvest in 2013. Four soil cores were collected from between crop rows and composited for each sub-plot. The samples were transferred to the laboratory in a cooler and stored at −4˚C until analyzed. In the laboratory, soil inorganic N ( and
and ) contents were determined [23] . Field moist soil (6.5 g) was extracted with 25 mL of 2M KCl after shaking the mixture for 30 min in a reciprocal shaker. The soil suspension was then centrifuged for 5 min and filtered through a Whatman no. 2 filter paper. The extracts were then analyzed for inorganic N using an Automated Timberline TL2800 Ammonia Analyzer (Timberline Instruments, CO, USA). Three additional soil cores (2 cm internal diameter) with depth intervals of 0 - 15, and 15 - 30 were also collected using a soil probe per each replicate from each crop at the first soil sampling events in both years to determine bulk density [24] . The average bulk densities from each crop were used to calculate their respective growing season soil inorganic N contents. Soil
 and
and
 concentrations (mg∙kg−1) in the 0 - 15 cm and 15 - 30 cm depth were multiplied by respective (depth-wise) bulk densities to express them into area basis (kg∙ha−1). The inorganic N contents at the two depth intervals were summed to obtain
 and
and
 contents for the upper 30 cm soil profile. Finally, both the
 and
and
 contents were added together to obtain total inorganic N contents for 0 - 30 cm soil depth.
2.6. Measurement of N2O Emission
During the 2012 growing season, N2O flux measurements were conducted from the four replicate units (two undrained and two tile-drained units) in both crops. The N2O emission rates from surface soil was measured using semi-permanent vented static PVC chamber (25.4 cm internal diameter and 10 cm height) method following the GRACEnet project protocol [31] . A polyvinyl chloride (PVC) anchor ring with beveled edge was inserted into the soil between crop rows in each sub-plot. The germinating crops, if any, inside the PVC rings were plucked out during anchor installation. Gas samples were collected at four instances for both corn (52, 78, 87, and 100 d after treatment application) and sugarbeet (35, 42, 54, and 73 d after treatment application). Gas samples were taken in between 0800 h and 1200 h of the day assuming to represent the average flux of the day. On the observation day, the height of the anchor ring above the soil surface was recorded, in order to calculate the headspace volume after chamber enclosure. A chamber was placed on the anchor and gas samples (30 mL) were collected from the chamber headspace at 0, 15, and 30 min with a graduated polypropylene syringe. The samples were then transferred to 12 mL pre-evacuated glass serum vials and transported to the laboratory for analysis. In addition, soil temperature and volumetric soil water content at the 6 cm depth, adjacent to each gas chamber, were also measured by using GS3 soil moisture-temperature sensor (Decagon Devices, Inc., Pullman, WA 99163). All the gas samples were analyzed within 24 h, using a DGA 42-Master gas chromatograph (Dani Instruments, Milan, Italy), fitted with an electron capture detector (ECD). The ECD was operated at 300˚C, He carrier gas at 10 mL∙min−1, Hayesep N 80/100 mesh (0.32 cm diameter × 50 cm length) and Porapak D 80/100 mesh (0.32 cm diameter × 200 cm length) columns in an oven operated at 80˚C. Assuming a linear increase in gas concentration, flux was calculated using the following equation:

where, F is the rate of gas emission (mass ha−1∙d−1), k is unit conversion, d is gas density (g∙cm−3) at 273 ˚K, T is the air temperature (˚K), V is the chamber volume (cm3), A is soil area covered by chamber (cm2) and ΔC/Δt is the rate of change of concentration over 15 and 30 min intervals [11] .
2.7. Measurement of NH3 Volatilization Loss
In 2013, NH3 volatilization losses from the N fertilizers were measured from both corn and sugarbeet plots using semi-static open chambers [32] . A chamber was installed in the middle of each sub-plot in between the crop rows. The chambers were secured in an upright position on the soil surface using wire stakes, surrounded by rubber bands. Ammonia volatilization measurements were taken six times (5, 9, 19, 27, 33, and 40 d after N application), and five times (19, 22, 25, 32, and 60 d after N application) from corn and sugarbeet, respectively. On the day of measurement, the foam strips and the acid solution were collected, stored in 0.5 L mason jars containing 125 mL of 2 M KCl solution, and new traps were replaced. The sampled traps were transferred to the laboratory, where they were immediately extracted with 250 mL of 2 M KCl solution. The extracts were analyzed for NH3 concentration using the ammonia analyzer as described above. Cumulative NH3 volatilization loss from each sub-plot was obtained by adding NH3 produced at individual days within the sub-plot.
2.8. Measurement of Soil Water
 Concentration
Samples of the soil water at 60 cm soil depth were collected from the middle of each sugarbeet plot between rows using suction lysimeters (68 cm in length and 2.2 cm diameter; Irrometer Company, Inc., CA, USA) during the 2013 sugarbeet growing season. The suction lysimeters were installed on June 13, 2013 (15 d after treatment application) and were allowed to equilibrate for a week such that the first water sample collected (22 d after treatment application) was discarded, and not used for data analysis. Then onwards sampling was conducted for a total of 9 times during the growing season (26, 29, 33, 36, 40, 47, 54, 62, 71 d) after treatment application). Using a hand pump, a vacuum of −60 kPa was applied to the tubes and maintained for a period until the time of water sampling. Water samples inside the lysimeters were extracted using a polypropylene syringe, collected into polypropylene conical tubes, and transferred to the laboratory for analyses. In the laboratory,
 concentrations in the water samples were analyzed using the ammonia analyzer. The lysimeters were devoid of water samples in all of the tile-drained plots on 26 d, as well as, in all of the plots (undrained and tile-drained) on 47, 62, and 71 d.
2.9. Statistical Analyses
Data were analyzed separately for each year per crop using a RCBD in a split-plot arrangement with drainage as main factor and N fertilizer management as sub factor for the analysis of variance as calculated by SAS PROC GLM (version 9.3, SAS Institute Inc., Cary, NC, USA). Because of limited number of replicates, the N2O data were pooled across the drainage management and analyzed using a RCBD with N fertilizer management as the main factor in both crops. The growing season soil inorganic N contents, N2O fluxes, soil water
 concentration were tested separately for each sampling date. Mean separations were tested using Fisher’s protected least significant difference at P ≤ 0.05.
3. Results and Discussion
3.1. Weather Conditions
Daily precipitation and mean air temperatures during the 2012 and 2013 growing seasons recorded at the research site by the Fargo NDAWN station are presented in Figure 1 [33] . In 2012, the growing season precipitation totaled 53% of the long-term (1981-2010) normal precipitation (461 mm). Consequently, the crops were under visible drought stress during the growing period. In contrast, the 2013 growing season was relatively wet compared to the normal years, but the distribution was uneven. More than half of the total season precipitation fell within the first two months of the growing season in 2013. As a result, the entire plot area was intermittently flooded during May and June of 2013. July and August were relatively dry and the crops were under drought stress. The last part of the 2013 growing season had above normal rainfall. In 2012, the growing season air temperatures were between 7˚C and 25˚C, which is slightly higher than the normal years. In 2013, air temperatures during the growing season ranged similar to that of the normal years, and were between 7˚C and 22˚C.
3.2. Soil N Availability during the Crop Growing Season
Changes in soil inorganic N availability as influenced by N-management and drainage under corn in 2012 and 2013 are presented in Figure 2. In 2012, management of N application had no influence on soil N availability throughout the growing season, regardless of drainage probably due to large inherent soil N mineralization and/or residual mineral N [6] . In fact, soil inorganic N measured during the growing season even exceeded the actual amount supplied through the N sources. In 2013, the pattern of N release in response to N management varied with drainage conditions under corn. Under the undrained condition in 2013, application of Urea134 led to a rapid buildup of inorganic N in soils during the early corn growing season (2 d after treatment application) compared to the application of urea + NP, despite both the treatments were applied at the similar N-rate. In sharp contrast under the tile-drained condition in 2013, the Urea + NP treatment delayed N release in soil until 37 d after treatment application, suggesting the potential of NP to hinder nitrification activity [9] . Corn N uptake is
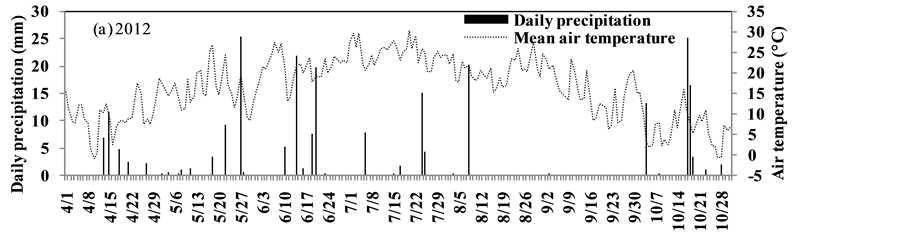
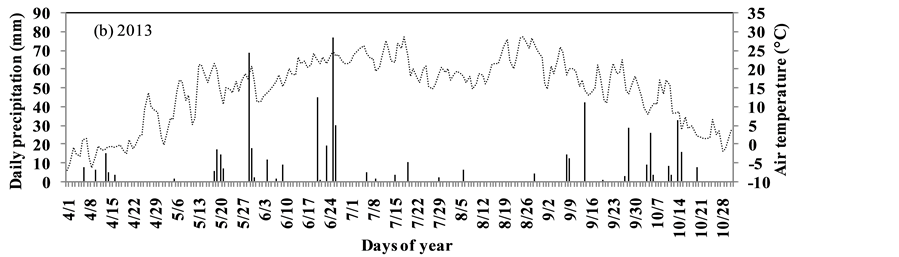
Figure 1. Daily precipitation and mean air temperature for the (a) 2012, and (b) 2013 growing seasons at the research site recorded by Fargo NDAWN station [33] .
usually low during the early growth period [8] . And, given that the early 2013 growing season was relatively wet with a greater probability of N loss through denitrification, applying NP to urea was efficient in conserving N in soils for crop uptake during rapid crop growth. Similar to our results, previous studies have also shown that the application of NP to urea fertilizers delayed the rapid buildup of mineral N in soils compared to without NP in silty clay [9] and in silt loam [19] . Similarly, during the 2013 corn growing season, applying N fertilizer in split doses (half at planting and half at V6 corn growth stages) either resulted in lower soil N levels at early growing period (2 to 22 d) or released proportionate amount of mineral N afterwards compared to applying the entire N fertilizer at planting. Corn grain yields between these two N treatments (Urea134 and split N treatment) were not different under both drainage conditions (discussed below). Therefore, applying N in split doses could have also provided the benefit in the reduction of N loss during early growing season via denitrification, while maintaining crop yield similar to entire preplant N application [18] .
Under sugarbeet, the application of N fertilizers increased soil N levels compared to unfertilized control on 48 d under the tile-drained condition in 2012, and on 7 d under both drainage conditions in 2013 (Figure 3). The application of Urea180 extended this increment until 15 d, particularly under the tile-drained condition in 2013. The higher inorganic N levels in soils with N-fertilization over unfertilized control during the crop growing season were expected. However, application of recommended N-rate (Urea146), with or without NP, resulted in similar soil N levels as higher N rate (Urea180), regardless of drainage management. The lack of differences in soil N availabilities among the fertilizer N management practices could be attributed to the presence of large residual soil NO3-N levels (Table 1). There were no appreciable differences in sugarbeet root yields and net sucrose concentrations among these N treatments in either year (discussed below). These results indicate that excess application of N-fertilizers should be avoided not only to attain higher gross revenue but also to reduce the risk of losses to the environment [12] [14] .
3.3. Soil N2O Emissions
In corn, the elevated N2O emissions were recorded on 54 d after N application (Table 2) in response to a total of 28 mm of precipitation that occurred on June 13 - 14 (52 - 53 d after N application) (Figure 1), with the Urea224 treatment exhibiting the largest flux of 105 g N2O-N ha−1∙d−1. Cumulative precipitation for the following 3 wk period totaled only 9 mm. Consequently, the emission rates measured on 78 d after N application did not exceed 10 g N2O-N ha−1∙d−1 in any of the N treatments. The N2O flux rates increased to about 27 g N2O-N
2012 2013
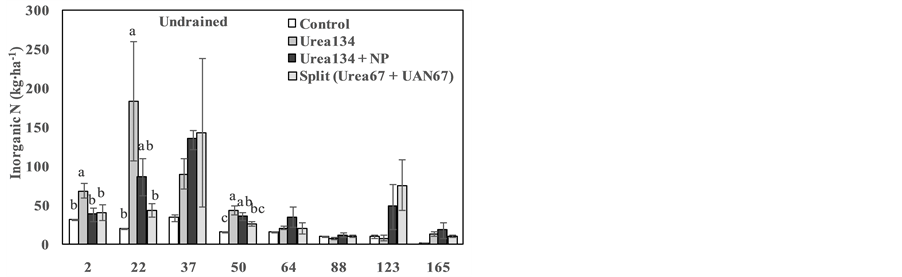
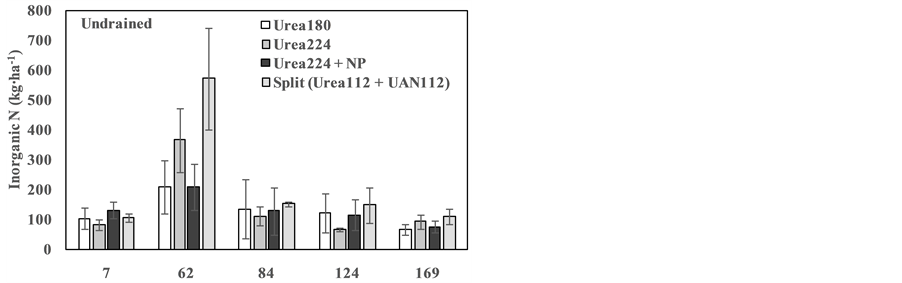
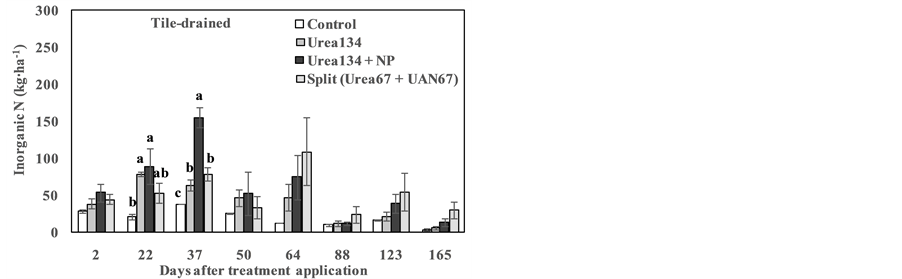
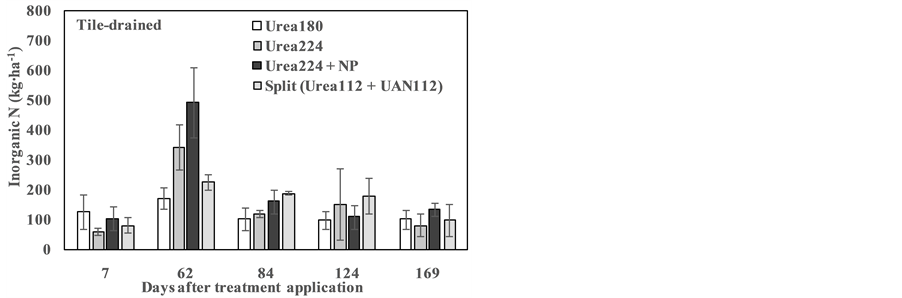
Figure 2. Inorganic N ( +
+ ) dynamics at 0 - 30 cm soil depth for N treatments under undrained and tile-drained conditions over a corn growing season in 2012 and 2013. Bars represent standard errors (n = 4). Different lower case letters within a day indicate significant difference at 0.05 level of significance.
Table 2. Soil N2O fluxes as influenced by N management during the 2012 growing season in corn and sugarbeet.
†Values are means ± standard errors (n = 4); ‡Least significant difference (LSD) values provided for P ≤ 0.05; §NS, non-significant.
2012 2013
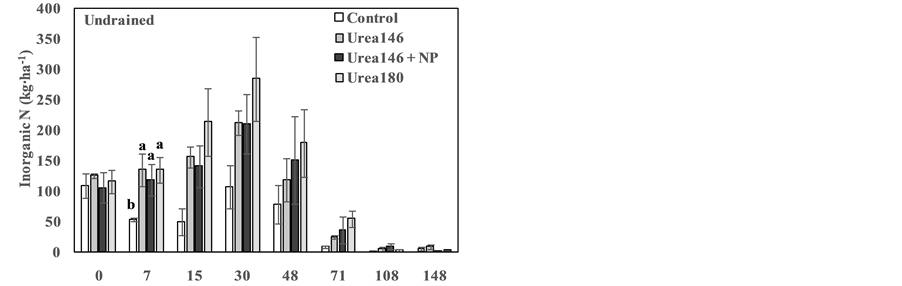
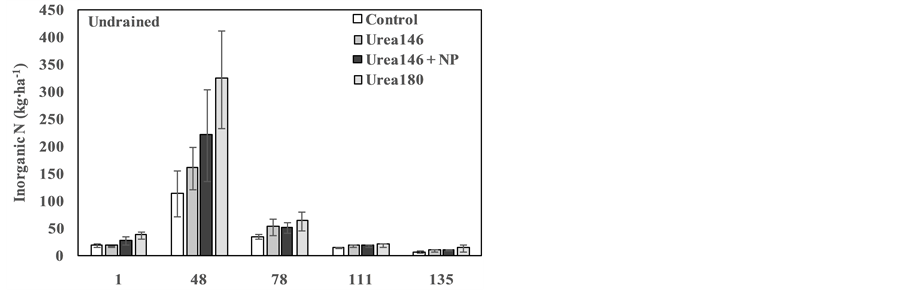
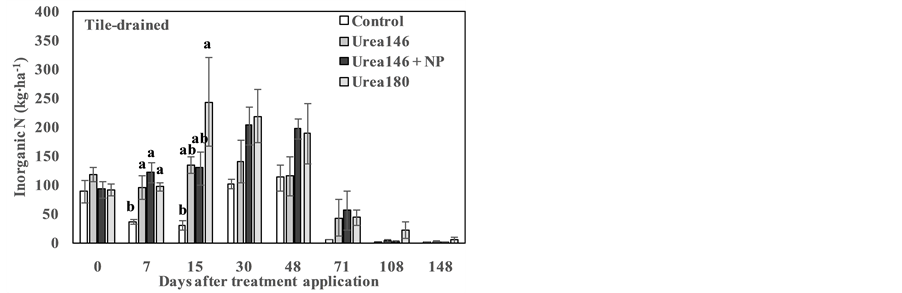
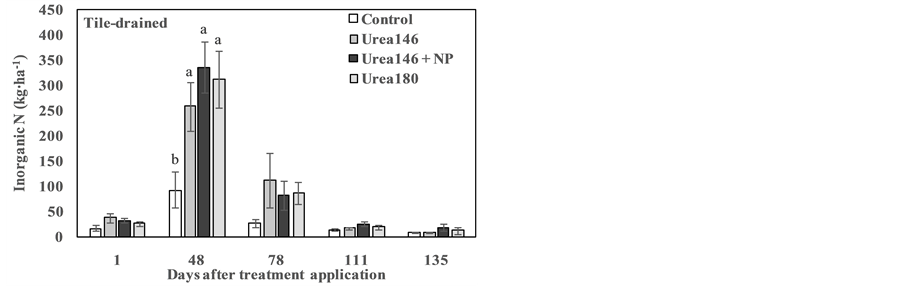
Figure 3. Inorganic N ( +
+ ) dynamics at 0 - 30 cm soil depth for N treatments under undrained and tile-drained conditions over a sugarbeet growing season in 2012 and 2013. Bars represent standard errors (n = 4). Different lower case letters within a day indicate significant difference at 0.05 level of significance.
ha−1∙d−1 on average across N treatments on 87 d, owing to 20 mm of total precipitation received on July 24 - 25 (86 - 87 d after N application). By 100 d, the N2O rates averaged 8 g N2O-N ha−1∙d−1 on average across N treatments. Similar to corn, N2O emissions from the sugarbeet plots were also characterized by the total amount of precipitation received during the measurement periods, with the flux values ranging between 10 to 36 g N2O-N ha−1∙d−1 across N treatments (Table 2).
Larger N2O flux rates in response to the precipitation events―as a consequence of increased soil saturation― are commonly reported in the literature [10] [12] [20] . However, except for one of the flux measurement days in corn, soil N2O fluxes remained mostly below 36 g N2O-N ha−1∙d−1 across the crops, throughout the measurement period. These results are comparable to those reported for silt loam soils in Mandan, North Dakota, where peak values varied from 19 to 27 g N2O-N ha−1∙d−1 in spring wheat―fallow and spring wheat―safflower (Carthamus tinctorius L.)―rye (Secale cereale L.) cropping systems [34] . In contrast, daily N2O fluxes in the present study are comparatively lower than the reported peak values of 740 g N2O-N ha−1∙d−1 for silt loam soils in Indiana [19] . Poorly drained soils usually favor denitrification because of O2 inhibition in these soils upon soil saturation [10] . In general, N2O emissions are lower from soils with less than 60% water filled pore space (WFPS), increases slowly between 60 and 80% WFPS, and then increase more rapidly above 80% WFPS [35] . The 2012 growing season was abnormally dry (Figure 1), with the highest daily precipitation of 25 mm received for the growing season. Therefore, the dry growing period in 2012 could have restricted N2O emissions in our study as opposed to others that have commonly reported larger spikes in N2O production following rainfall and/or irrigation events greater than 70 mm [19] . Moreover, lower gas diffusivity and/or higher cation exchange capacity associated with fine-textured soils in the study site may have also limited N2O production [36] .
Soil N2O fluxes did not differ among the N management treatments on any sampling date in both corn and sugarbeet (Table 2). Studies have shown that application of mineral N fertilizers tends to cause positive and linear N2O emissions because of greater inorganic N substrate availability [12] . Soil N availability measured at 0 - 30 cm soil depth in sugarbeet was higher with the N-fertilized treatments as compared to the control plots during the 2012 mid-growing season. However, soil N levels did not differ among the N-fertilized treatments under both corn and sugarbeet. Due to inconsistency in temporal release of mineral N from the applied fertilizers as well as soil inherent N mineralization, and due to episodic nature of N2O emission induced by rainfall events, N2O emissions did not vary among different N fertilizer sources during the dry growing season in 2012 [10] [37] . Besides, N2O fluxes measured during the mid-growing season in 2012 were highly variable within the N treatments in both crops, and consequently no significant differences were observed among the treatments [20] .
3.4. Soil NH3 Volatilization
Cumulative losses of NH3 did not respond to drainage management under both corn and sugarbeet in 2013 (Table 3). Approximately, 46 mm of precipitation fell within the next 5 d after N application under corn, and about 70 mm of precipitation fell on the day after N application under sugarbeet, which could have considerably incorporated the N fertilizers, regardless of drainage (Figure 1). Moreover, the N fertilizers were incorporated manually at 15 cm soil depth after N application. Therefore, soil incorporation of N fertilizer by high rainfall and/or manually after N application could have limited
 substrate availability [38] . And considering proportionate amounts of
 transport from the soil surface down to soil profile, NH3 emissions from subsurface drained and undrained plots are unlikely to be different [16] .
In both corn and sugarbeet, NH3 losses increased with N application over the unfertilized control (Table 3). Higher NH3 losses from N-fertilized treatments are expected due to greater availability of N in the fertilized plots (Figure 2 and Figure 3). However, there were no significant differences in NH3 losses between N sources (with vs. without NP treatments in corn) and N rates (higher vs. recommended rates in sugarbeet). In corn, across drainage, about 1.9% of applied N was lost as NH3 from the Urea134 + NP treatment, and NH3 volatilization from the Urea134 alone was about 1.2% of applied N. Similarly, in sugarbeet, about 0.4 and 0.5% of applied N was lost as NH3 from Urea146 and Urea180, respectively, with no significant differences between the N-rate treatments. Studies have shown that the application of nitrification inhibitor to urea usually enhances NH3 loss compared to untreated urea due to retention of fertilizer N in the NH4+ form for a prolonged period of time by the inhibitor [39] . And, NH3 volatilization usually increases with increasing N application rate as a consequence of greater N availability [12] . However, in our study, soil N levels were similar between the N-rates throughout the sugarbeet growing season probably due to crop N uptake. And, under corn, although the availability of N tended to be greater with the application of NP during the early growing period, it apparently was not
Table 3. Cumulative NH3 volatilization losses from N fertilizers under undrained and tile-drained conditions in corn and sugarbeet during the 2013 growing season.
†Values are means ± standard error (n = 4); Different lowercase letters within a column indicate significant difference at 0.05 level of significance. ‡Least significant difference (LSD) value provided for P ≤ 0.05.
enough to significantly influence NH3 volatilization under wet early growing season, when most of the
 would have already been stabilized to the soil exchange complex [32] . Nevertheless, the amounts of NH3 volatilization losses in our study are comparable to the previously reported values of 2.3% for surface applied urea for clay loam soil at a simulated irrigation of 16 to 19 mm of precipitation applied after 1 d of urea application [32] and 2.8% for sandy loam soils at 21.4 mm of simulated rain applied after 1 d of N application [40] . As with these studies, high precipitation (46 and 70 mm in corn and sugarbeet, respectively) received shortly after N application considerably incorporated fertilizer N into soil and restricted NH3 volatilization [38] . Higher CEC associated with high clay soil at the research site could have also limited the
 substrate required for volatilization [41] . Furthermore, the urea were incorporated into soils shortly after their application in our study, which would reduce NH3 loss because of increased contact of urea with soil exchange complex, and where it is converted to the stable
 form [16] .
3.5. Soil Water
 Concentration
Soil water
 concentration (mg∙L−1) measured at the 60 cm soil depth during the 2013 sugarbeet growing season for the N treatments under undrained and subsurface drained conditions are presented in Figure 4. The concentrations of
 at 60 cm depth was highly variable. However, the concentrations of
 were slightly lower under subsurface drained than undrained condition across all the N treatments throughout the measurement period. Under the undrained condition, peak concentrations of
 in Urea146, Urea146 + NP, and
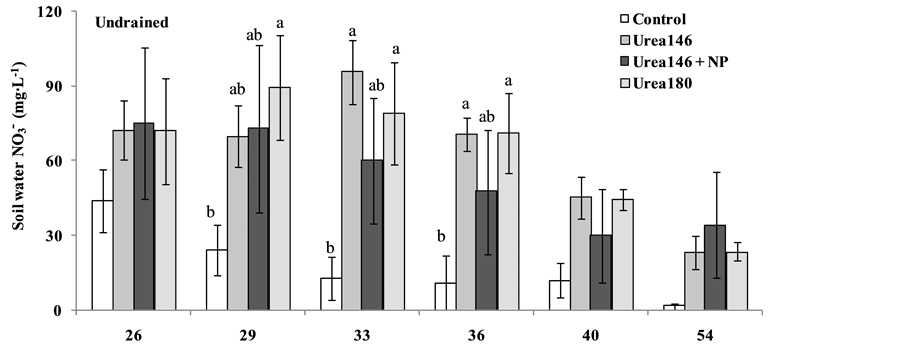
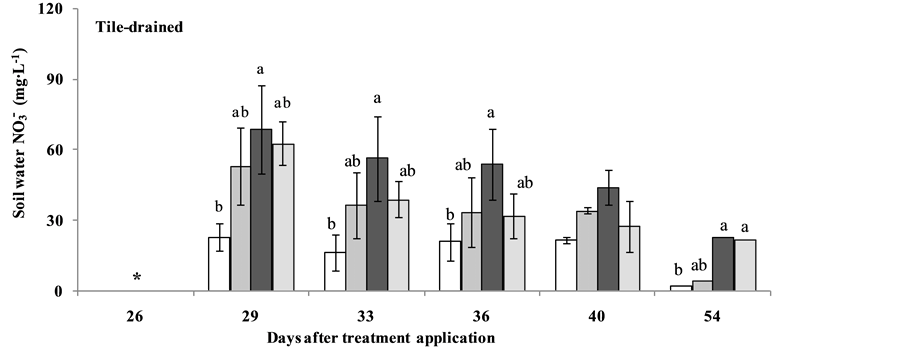
Figure 4. Soil water
 concentration (mg∙L−1) measured during the 2013 sugarbeet growing season as influenced by N management under undrained and drained conditions. Bars represent standard errors (n = 4). Different lower case letter within a day indicate significant difference at 0.05 level of significance. *Not available for the day.
Urea180 were 96, 75, and 85 mg∙L−1, respectively, whereas the corresponding peak concentrations for these treatments under the tile-drained condition were 53, 69, and 63 mg∙L−1, respectively. A consistently lower NO3− concentration with tile drainage could in part be due to greater N uptake by sugarbeet crops under tile drained condition. Sugarbeet N demand is usually high from the early growth period until canopy growth phase for the development of above-ground plant parts, during which maximum N is assimilated [42] . And, the measurement of leaf chlorophyll conducted at 54 d revealed that, across the N treatments, the spad values were slightly higher for the tile drained sugarbeet plots compared to undrained plots (data not presented).
Soil
 concentrations varied among the N treatments with drainage. Nitrate concentration generally increased with N fertilization over the control irrespective of drainage management, however. The lower
 levels with the control treatments were expected. Under the tile-drained condition, application of NP accumulated significantly greater soil water
 levels than the control, while the urea treatments without NP were only slightly greater than control. Under the undrained condition, the soil water
 concentration appeared not to depend on NP but N fertilization. In the present study, the extraction of soil water for the determination of
 concentration began only after 29 d following N application due to untrafficable soil condition at the study site. Despite the delayed measurements, under the tile-drained condition, the
 concentration tended to be slightly higher with the application of Urea146 + NP than without NP treatments (Urea146 and Urea180). Since nearly a third of the total growing season precipitation fell within the initial 30 d (Figure 1), considerable losses of N were deemed possible through denitrification without NP application during these initial 4 wk period [9] [19] . These results suggest the efficacy of nitrification inhibitor NP to conserve more
 in soils underthe tile-drained condition, which otherwise could have potentially lost through denitrification without the application of NP [10] .
3.6. Crop Yields
Tile drainage had no influence on crop yields and quality parameters during the 2012 and 2013 growing seasons (Table 4 and Table 5). Several studies have indicated significant crop yield improvements under tile drainage compared with undrained conditions due to improvement in soil environment and/or N availability for crops with drainage [3] [4] . However, crop yield response to drainage management can vary with the amount and the pattern of precipitation received during the growing season [10] . And, studies have confirmed that water stress
Table 4. Corn grain yield as affected by N management under undrained and tile-drained conditions in 2012 and 2013.
†Values are means ± standard error (n = 4); Different lowercase letters within a column within each year indicate significant difference at 0.05 level of significance; ‡Least significant difference (LSD) values provided for P ≤ 0.05; §NS, non-significant.
Table 5. Sugarbeet root yield and quality parameters as affected by N management under undrained and tile-drained conditions in 2012 and 2013.
†Values are means ± standard error (n = 4); Different lowercase letters within a column within each year indicate significant difference at 0.05 level of significance; ‡Least significant difference (LSD) values provided for P < 0.05; §NS, non-significant.
during reproductive growth stages of crops can dramatically reduce yields [43] . In the current study, the crops experienced drought conditions during the growing periods in both years. Therefore, soil water deficit was likely the most limiting factor affecting crop yields due to abnormally dry growing conditions. In addition, water stress could have also lowered N demand in the crops. Consequently, over the two study years, the expected benefit of tile drainage to improve crop yields was likely minimized, regardless of N management.
In 2012, corn yields averaged 7.39 and 7.35 Mg∙ha−1 under undrained and tile-drained conditions, respectively, with no significant differences among the N fertilizer management sources (Table 4). Lack of yield responses to fertilizer N management practices could be attributed in part to large soil residual N and/or organic N mineralization during the growing seasons [37] . In fact, soil N levels measured during the 2012 growing season even exceeded the amount supplied through N fertilizers (Figure 2). Moreover, soil N availabilities among the N fertilizer sources and rates were similar throughout the growing season under both drainage conditions. Given that soil N availability from the N sources were similar, it can be safely presumed that N uptake by corn plants were similar for the N sources, which likely limited yield differences among them. Additionally, the 2012 growing season was abnormally dry and the movement of N into the active root zone might have also been hindered within the dry topsoil that consequently may have led to poor root N uptake [44] . Nevertheless, in 2013, corn yields increased with the application of fertilizer-N over the unfertilized control on average by 2.32 Mg∙ha−1 (27.9% increment) under the undrained condition and by 2.24 Mg∙ha−1 (27.2% increment) under the tile-drained condition. But, the yields were similar among the N-fertilized treatments under both undrained and drained conditions, and averaged 8.29 Mg∙ha−1 and 8.25 Mg∙ha−1, respectively. These results suggest the necessity of N application regardless of N sources in order to optimize crop yields [18] . However, the lack of yield differences among the N-fertilized treatments, regardless of N source and N rate could be attributed to drought stress during the dry mid-growing period that likely reduced the overall corn yield potential, obscuring the effects of N management [12] [44] . Our results are in line with previous studies that have also reported no responses to the application of N sources and rates containing urease inhibitor, nitrification inhibitor, or slow release polymer coated urea under abnormally dry growing periods [10] [12] [45] . The response of N fertilizers on crop yields are usually substantial in coarse-textured soils with higher crop N demands under irrigated condition, whereas the response of N fertilizers may be limited in fine-textured soils having low crop N demand with limited soil water availability [46] .
Similar to corn, N management had no influence on sugarbeet root yield and sucrose concentration in both years (Table 5). Across N treatments, in 2012, sugarbeet root yield averaged 45.3 and 48.6 Mg∙ha−1, with net sucrose concentrations of 16.7 and 16.4% under undrained and tile-drained conditions, respectively. In 2013, the average sugarbeet root yields were 39.0 and 37.6 Mg∙ha−1, and sucrose concentrations were 14.2 and 14.0% under undrained and tile-drained conditions, respectively. Soil residual NO3-N contents measured in the sugarbeet plots were 93 and 272 kg∙ha−1 (at 0 - 120 cm soil profile) for 2012 and 2013, respectively (Table 1). Such high residual N levels could have significantly contributed crop N needs, and consequently no response to the added N through fertilizers was observed. Instead, the application of N increased impurity (SLM %) in beet roots, particularly under the tile-drained condition in 2012 (Table 5). Sugarbeet root impurity increased by 13.8% with Urea146 + NP and by 17.2% with Urea180 compared to unfertilized control under the tile-drained condition in 2012. The reduction in sugarbeet root quality with N application could be due to greater crop N uptake with Urea146 + NP and Urea180 treatments because soil N levels measured during the mid-growing season were significantly higher with these treatments as compared to unfertilized control (Figure 3). Previous studies have confirmed that greater soil N availability than required usually lowers purity indexes with depressed sucrose concentrations [47] . Excess N fertilization can stimulate sugarbeet top growth beyond the point where maximum root yields are attained and thereby direct photosynthates into regenerating canopy rather than into the root storage [48] .
4. Conclusion
Our experiment showed the need for long term studies of subsurface drainage and N management on crop yields and quality, and N availability and N losses in the RRV. Although contrasting weather patterns occurred during the 2012 and 2013 growing seasons, our study emphasized that across intense wetting and drying cycles, subsurface drainage and N management influenced N availability more than crop yield in the silty clay soil. Prolong periods of soil saturation due to poor internal drainage has typically been the greatest limiting factor affecting crop yields in this soil. And, contrary to the norm, soil water deficit was likely the most limiting factor affecting crop yields over the two study years, due to abnormally dry conditions experienced during the growing seasons. Additionally, inherent soil N mineralization appears to be an important factor controlling crop yields and N losses, and therefore assessment of soil mineral N during crop growth period appears to be important to improve our knowledge on N availability for crops. Application of higher than recommended N rates had no effect on yields, but was only associated with more daily soil N2O emissions. Conversely, the application of recommended N fertilizer rates along with nitrification inhibitor still holds as a viable N management strategy to increase N availability to crops without compromising yields. Also, nitrification inhibitor might have the potential to conserve soil water
 concentrations at 60 cm depth, particularly under the tile-drained condition. Apart from the high cation exchange associated with the soil under investigation, incorporation of fertilizer-N into soils mechanically and/or rainfall can considerably restrict NH3 volatilization from the soil, with a possibility of up to 1.9% loss from the applied-N. The research results may provide important information to growers considering suitable N management under subsurface drainage systems within the RRV.
Cite this paper
RakeshAwale,AmitavaChatterjee,HansKandel,Joel K.Ransom, (2015) Tile Drainage and Nitrogen Fertilizer Management Influences on Nitrogen Availability, Losses, and Crop Yields. Open Journal of Soil Science,05,211-226. doi: 10.4236/ojss.2015.510021
References
- 1. US Department of Agriculture—Natural Resources Conservation Service (2014) Soil Survey Office, Fargo, ND.
- 2. Kandel, H.J., Brodshaug, J.A., Steele, D.D., Ransom, J.K., Desutter, T.M. and Sands, G.R. (2013) Subsurface Drainage Effects on Soil Penetration Resistance and Water Table Depth on a Clay Soil in the Red River of the North Valley, USA. Agricultural Engineering International: CGIR Journal, 15, 1-10.
- 3. Kladivko, R.L., Willowghby, G.L. and Santini, J.B. (2005) Corn Growth and Yield Response to Subsurface Drain Spacing on Clermont Silt Loam Soil. Agronomy Journal, 97, 1419-1428.
http://dx.doi.org/10.2134/agronj2005.0090 - 4. Jin, C.X., Sands, G.R., Kandel, H.J., Wiersma, J.H. and Hansen, B.J. (2008) Influence of Subsurface Drainage on Soil Temperature in a Cold Climate. Journal of Irrigation and Drainage Engineering, 34, 83-88.
http://dx.doi.org/10.1061/(ASCE)0733-9437(2008)134:1(83) - 5. Agehara, S. and Warncke, D.D. (2005) Soil Moisture and Temperature Effects on Nitrogen Release from Organic Nitrogen Sources. Soil Science Society of America Journal, 69, 1844-1855.
http://dx.doi.org/10.2136/sssaj2004.0361 - 6. Rochette, P., Tremblay, N., Fallon, E., Angers, D.A., Chantigny, M.H., MacDonald, J.D., Bertrand, N. and Parent, L.E. (2010) N2O Emissions from an Irrigated and Non-Irrigated Organic Soil in Eastern Canada as Influenced by N Fertilizer Addition. European Journal of Soil Science, 61, 186-196.
http://dx.doi.org/10.1111/j.1365-2389.2009.01222.x - 7. Dessureault-Rompre, J.B., Zebarth, B.J., Burton, D.L., Gregorich, E.G., Goyer, C., Georgallas, A. and Grant, C.A. (2013) Are Soil Mineralizable Nitrogen Replenished during the Growing Season in Agricultural Soil? Soil Science Society of America Journal, 77, 512-524.
http://dx.doi.org/10.2136/sssaj2012.0328 - 8. Zebarth, B.J. and Paul, J.W. (1997) Growing Season Nitrogen Dynamics in Manured Soils in South Coastal British Columbia: Implications for a Soil Nitrate Test for Silage Corn. Canadian Journal of Soil Science, 77, 67-76.
http://dx.doi.org/10.4141/S96-028 - 9. Awale, R. and Chatterjee, A. (2015) Soil Moisture Controls the Denitrification Loss of Urea-Nitrogen from Silty Clay Soil. Communications in Soil Science and Plant Analysis, 46, 2100-2110.
http://dx.doi.org/10.1080/00103624.2015.1069317 - 10. Nash, P., Nelson, K. and Motavalli, P. (2015) Reducing Nitrogen Loss with Managed Drainage and Polymer-Coated Urea. Journal of Environmental Quality, 44, 256-264.
http://dx.doi.org/10.2134/jeq2014.05.0238 - 11. Ginting, D., Kessavalou, A., Eghball, B. and Doran, J.W. (2003) Greenhouse Gas Emissions and Soil Indicators Four Years after Manure and Compost Applications. Journal of Environmental Quality, 32, 23-32.
http://dx.doi.org/10.2134/jeq2003.2300 - 12. Thapa, R., Chatterjee, A., Johnson, J.M.F. and Awale, R. (2015) Stabilized Nitrogen Fertilizers and Application Rate Influence Nitrogen Losses under Rainfed Spring Wheat. Agronomy Journal, 107, 1-10.
http://dx.doi.org/10.2134/agronj15.0081 - 13. Drury, C.F., Tan, C.S., Reynolds, W.D., Welacky, T.W., Oloya, T.O. and Gaynor, J.D. (2009) Managing Tile Drainage, Subirrigation, and Nitrogen Fertilization to Enhance Crop Yields and Reduce Nitrate Loss. Journal of Environmental Quality, 38, 1193-1204.
http://dx.doi.org/10.2134/jeq2008.0036 - 14. Randall, G.W. and Vetsch, J.A. (2005) Nitrate Losses in Subsurface Drainage from a Corn-Soybean Rotation as Affected by Fall and Spring Application of Nitrogen and Nitrapyrin. Journal of Environmental Quality, 34, 590-597.
http://dx.doi.org/10.2134/jeq2005.0590 - 15. Singh, U., Sanabria, J., Austin, E.R. and Agyin-Birikorang, S. (2011) Nitrogen Transformation, Ammonia Volatilization Loss, Nitrate Leaching in Organically Enhanced Nitrogen Fertilizers Relative to Urea. Soil Science Society of America Journal, 76, 1842-1854.
http://dx.doi.org/10.2136/sssaj2011.0304 - 16. Norman, R.J., Wilson Jr., C.E. and Slaton, N.A. (2003) Soil Fertilization and Mineral Nutrition in US Mechanized Rice Culture. In: Smith, W. and Dilday, R.H., Eds., Rice: Origin, History, Technology, and Production, John Wiley & Sons Inc., Hoboken, 331-411.
- 17. Al-Kanani, T., MacKenzie, A.F. and Barthakur, N.N. (1991) Soil Water and Ammonia Volatilization Relationships with Surface-Applied Nitrogen Fertilizer Solutions. Soil Science Society of America Journal, 55, 1761-1766.
http://dx.doi.org/10.2136/sssaj1991.03615995005500060043x - 18. Maharjan, B., Venterea, R.T. and Rosen, C. (2014) Fertilizer and Irrigation Management Effects on Nitrous Oxide Emissions and Nitrate Leaching. Agronomy Journal, 106, 703-714.
http://dx.doi.org/10.2134/agronj2013.0179 - 19. Omonode, R.A. and Vyn, T.J. (2013) Nitrification Kinetics and Nitrous Oxide Emissions When Nitrapyrin Is Coapplied with Urea-Ammonium Nitrate. Agronomy Journal, 105, 1475-1486.
http://dx.doi.org/10.2134/agronj2013.0184 - 20. Parkin, T.B. and Hatfield, J.L. (2013) Influence of Nitrapyrin on N2O Losses from Soil Receiving Anhydrous Ammonia. Agriculture, Ecosystems and Environment, 136, 81-86.
http://dx.doi.org/10.1016/j.agee.2009.11.014 - 21. Soil Survey Staff (2014) Keys to Soil Taxonomy. 12th Edition, USDA-Natural Resources Conservation Service, Washington DC.
- 22. Franzen, D.W. (2010) North Dakota Fertilizer Recommendation Tables and Equations. Publication No. SF-882 (Revised), NDSU Extension Service, North Dakota State University, Fargo.
https://www.ndsu.edu/fileadmin/soils/pdfs/sf882.pdf - 23. Maynard, D.G., Kalra, Y.P. and Crumbaugh, J.A. (2008) Nitrate and Exchangeable Ammonium Nitrogen. In: Carter, M.R. and Gregorich, E.G., Eds., Soil Sampling and Methods of Analysis, Canadian Society of Soil Science, CRC Press, Boca Raton, 71-80.
- 24. Blake, G.R. and Hartge, K.H. (1986) Bulk Density. In: Klute, A., Ed., Methods of Soil Analysis, Part 1, ASA and SSSA, Madison, 363-367.
- 25. Combs, S.M. and Nathan, M.V. (1998) Soil Organic Matter. In: Brown, J.R., Ed., Recommended Chemical Soil Test Procedures for the North Central Region, NCR Publication No. 221, Missouri Agricultural Experiment Station SB 1001, University of Missouri, Columbia, 53-58.
- 26. Thomas, G.W. (1996) Soil pH and Acidity. In: Sparks, D.L., Ed., Methods of Soil Analysis, Part 3, ASA, SSSA, Madison, 475-490.
- 27. Chapman, H.D. (1965) Cation-Exchange Capacity. In: Black, C.A., Ed., Methods of Soil Analysis, Part 2: Chemical and Microbiological Properties, ASA, Madison, 891-900.
- 28. Elliott, E.T., Heil, J.W., Kelly, E.F. and Monger, H.C. (1999) Soil Structural and Other Physical Properties. In: Robertson, G.P., et al., Eds., Standard Soil Methods for Long Term Ecological Research, Oxford University Press, Inc., New York, 74-88.
- 29. Frank, K., Beegle, D and Denning, J. (1999) Phosphorus. In: Brown, J.R., Ed., Recommended Chemical Soil Test Procedures for the North Central Region, NCR Publication No. 221, Missouri Agricultural Experiment Station SB 1001, University of Missouri, Columbia, 21-30.
- 30. Warncke, D. and Brown, J.R. (1998) Potassium and Other Basic Cations. In: Brown, J.R., Ed., Recommended Chemical Soil Test Procedures for the North Central Region, NCR Publication No. 221, Missouri Agricultural Experiment Station SB 1001, University of Missouri, Columbia, 31-33.
- 31. Parkin, T.B. and Venterea, R.T. (2010) Chamber-Based Trace Gas Flux Measurements. In: Follet, R.F., Ed., Sampling Protocols, USDA-ARS, Washington DC, 3.1-3.39.
http://www.ars.usda.gov/research/GRACEnet - 32. Jantalia, C.P., Halvorson, A.D., Follett, R.F., Alves, B.J.R., Polidoro, J.C. and Urquiaga, S. (2012) Nitrogen Source Effects on Ammonia Volatilization as Measured with Semi-Static Chambers. Agronomy Journal, 104, 1595-1603.
http://dx.doi.org/10.2134/agronj2012.0210 - 33. NDAWN (2015) North Dakota Agricultural Weather Network Center.
http://ndawn.ndsu.nodak.edu - 34. Liebig, M.A., Tanaka, D.L. and Gross, J.R. (2010) Fallow Effects on Soil Carbon and Greenhouse Gas Flux in Central North Dakota. Soil Science Society of America Journal, 74, 358-365.
http://dx.doi.org/10.2136/sssaj2008.0368 - 35. Bateman, E.J. and Baggs, E.M. (2005) Contribution of Nitrification and Denitrification to N2O Emissions from Soils at Different Water-Filled Pore Space. Biology and Fertility of Soils, 41, 379-388.
http://dx.doi.org/10.1007/s00374-005-0858-3 - 36. Gu, J., Nicoullaud, B., Rochette, P., Grossel, A., Henault, C., Cellier, P. and Richard, G. (2013) A Regional Experiment Suggests That Soil Texture Is a Major Control of N2O Emissions from Tile-Drained Winter Wheat Fields during the Fertilization Period. Soil Biology and Biochemistry, 60, 134-141.
http://dx.doi.org/10.1016/j.soilbio.2013.01.029 - 37. Dell, C.J., Han, K, Bryant, R.B. and Schmidt, J.P. (2014) Nitrous Oxide Emissions with Enhanced Efficiency Nitrogen Fertilizers in a Rainfed System. Agronomy Journal, 106, 723-731.
http://dx.doi.org/10.2134/agronj2013.0108 - 38. Rochette, P., Angers, D.A., Chantigny, M.H., Gasser, M., MacDonald, J.D., Pelster, D.E. and Bertrand, N. (2013) Ammonia Volatilization and Nitrogen Retention: How Deep to Incorporate Urea? Journal of Environmental Quality, 42, 1635-1642.
http://dx.doi.org/10.2134/jeq2013.05.0192 - 39. Gioacchini, P., Nastri, A., Marzadori, C., Giovannini, C., Antisari, L.V. and Gessa, C. (2002) Influence of Urease and Nitrification Inhibitors on N losses from Soils Fertilized with Urea. Biology and Fertility of Soils, 36, 129-135.
http://dx.doi.org/10.1007/s00374-002-0521-1 - 40. Holcomb III, J.C., Sullivan, D.M., Horneck, D.A. and Clough, G.H. (2011) Effect of Irrigation Rate on Ammonia Volatilization. Soil Science Society of America Journal, 75, 2341-2347.
http://dx.doi.org/10.2136/sssaj2010.0446 - 41. Griggs, B.R., Norman, R.J., Wilson Jr., C.E. and Slaton, N.A. (2007) Ammonia Volatilization and Nitrogen Uptake for Conventional and Conservation Tilled Dry-Seeded, Delayed-Flood Rice. Soil Science Society of America Journal, 71, 745-751.
http://dx.doi.org/10.2136/sssaj2006.0180 - 42. Martin, S.S. (2001) Growing Sugarbeet to Maximize Sucrose Yield. In: Wilson, R.G., Ed., Sugarbeet Production Guide, Bulletin ECO1-156, Nebraska Coop. Ext., University of Nebraska, Lincoln, NE, 3-8.
- 43. Cakir, R. (2004) Effect of Water Stress at Different Development Stages on Vegetative and Reproductive Growth of Corn. Field Crops Research, 89, 1-16.
http://dx.doi.org/10.1016/j.fcr.2004.01.005 - 44. Ray, J.D., Heatherly, L.G. and Fritschi, F.B. (2005) Influence of Large Amounts of Nitrogen on Nonirrigated and Irrigated Soybean. Crop Science, 46, 52-60.
http://dx.doi.org/10.2135/cropsci2005.0043 - 45. Mckenzie, R.H., Middleton, A.B., Pfiffner, P.G. and Bremer, E. (2010) Evaluation of Polymer-Coated Urea and Urea Inhibitor for Winter Wheat in Southern Alberta. Agronomy Journal, 102, 1210-1216.
http://dx.doi.org/10.2134/agronj2009.0194 - 46. Abalos, D., Jeffery, S., Sanz-Cobena, A., Guardia, G. and Vallejo, A. (2014) Meta-Analysis of the Effect of Urease and Nitrification Inhibitors on Crop Productivity and Nitrogen Use Efficiency. Agriculture, Ecosystems and Environment, 189, 136-144.
http://dx.doi.org/10.1016/j.agee.2014.03.036 - 47. Halvorson, A.D. and Hartman, G.P. (1974) Long-Term Nitrogen Rates and Sources Influence Sugarbeet Yield and Quality. Agronomy Journal, 67, 389-393.
http://dx.doi.org/10.2134/agronj1975.00021962006700030027x - 48. Anderson, F.N. and Peterson, G.A. (1988) Effect of Incremental Nitrogen Application on Sucrose Yield of Sugarbeet. Agronomy Journal, 80, 709-712.
http://dx.doi.org/10.2134/agronj1988.00021962008000050002x