Open Journal of Soil Science
Vol.2 No.4(2012), Article ID:26158,6 pages DOI:10.4236/ojss.2012.24040
Surface Hardness as an Indicator of Soil Strength of Agricultural Soils
![]()
Department of Food Production, University of the West Indies, Saint Augustine, Trinidad and Tobago.
Email: *gaius.eudoxie@sta.uwi.edu
Received July 4th, 2012; revised August 10th, 2012; accepted August 20th, 2012
Keywords: Clegg Impact Tester; Surface Hardness; Penetration Resistance; Moisture-Density Relationship
ABSTRACT
Soil strength is an important quality of agricultural soils prone to traffic. Surface hardness (SH) measured by the clegg impact tester (CIT) was evaluated as an indicator for assessing soil strength. Proctor tests were performed on a diverse range of soils to examine the relationships between bulk density (BD), penetration resistance (PR), SH and water content. All three indices showed typical response curves with increasing water content, with notable differences among the soils. Maximum dry bulk density (MDBD), peak penetration resistance (PPR) and peak surface hardness (PSH) showed values of 1.98 Mg·m−3, 8.2 MPa and 248 Cmax for Piarco, River Estate and Piarco respectively. Corresponding critical moisture contents (CMC) were much greater for MDBD compared to PPR and PSH. SH showed a significant positive correlation with PR, but not BD. Further divulgence into the relationships between SH and other soil properties as well as crop response will facilitate greater use of the CIT.
1. Introduction
Physical properties of agricultural soils play a crucial role in productivity and determine to some extent strategies to improve soil quality. In the Caribbean the evaluation of soil physical properties has been limited to textural distribution [1], which provides only partial information for decision making. The nature and influence of physical parameters such as density, Atterberg limits, and soil strength indices has received limited attention [2,3], whilst they dictate the timing and influence of physical soil manipulation. Further, the relationships between soil strength and other soil parameters are not fully understood [4].
Reference [5] indicated that for accurate assessment of changes in the soil fabric due to compaction, measurement of BD is not adequate. PR is frequently used in the assessment of surface strength in association with bulk density. Reference [6] indicated that PR is regarded as a useful measure of soil impedance and root growth. Although PR determination is relatively rapid compared to BD, both applications are limited at extremes of moisture content [7] where high and low soil strength interferes with point measurements, and bulk sampling respectively. Reference [2] illustrated the bell shaped response for these two parameters with increasing water content. Another limitation of PR is the relatively great spatial variation associated with a point measurement, rather than a bulk soil measurement. Reference [8] stated that to strengthen the value of point measurements of PR further studies to develop relations between PR and non-point measurements of shear strength are needed. Reference [9] highlighted the interrelatedness of BD and PR in assessing soil strength and further stated that using only one of these variables may lead to misleading results. Although these two parameters may provide adequate information for evaluating soil compaction and strength, newer technologies such as the clegg impact tester (CIT) may prove useful across a wider moisture content range.
SH measured by the CIT has been defined as the ability of a surface to absorb the impact energy created by any object striking that surface. Softer surfaces will absorb a larger percentage of the energy generated upon impact than a harder surface [10]. The CIT measures Cmax which is a measure of the strength of soil layers. This is achieved by measuring the dynamic rebound of the soil owing to a standard weight falling from a constant height. Reference [11] describes the CIT as a modified Proctor hammer with an attached accelerometer. They indicated that the unit operates on the principle that the rate at which the hammer rebounds (soil resistance) is related to soil strength, BD or hardness. The harder the surface, the higher will be the rebound and so will be the Cmax. Agronomy research using the CIT has been restricted to evaluating turf root zone firmness on player performance, with decreases in maximum deceleration as a result of increases in moisture content [12]. No attempt has been made to correlate surface hardness with other soil strength indices.
SH may provide quantitative data on soil strength that has not been previously documented. It was hypothesized that this in-situ test can be used as a single test to ascertain the overall strength of agricultural soils at a range of soil moisture content.
2. Materials and Methods
Six agricultural soils (Table 1) were selected to represent a diversity of soil physical properties. The soils were collected (0 - 20 cm), air-dried and ground to pass a 2 mm sieve, prior to characterization. Standard physical and chemical analyses were conducted. Particle size distribution was performed using the hydrometer method [13]. pH was determined in a soil to water extract of 1:2.5 [14]. Organic matter (OM) content of the soils was assessed by Walkley and Black wet oxidation method [15], except for Chagaramus which was done by the loss on ignition method due to the high content of organic matter. BD was determined using the core method [16] and particle density (PD) via the pyconometer method [17]. Atterberg limits were assessed according to [18].
Soil compaction and strength indicators were assessed on prepared samples (<4.75 mm) using the standard Proctor test explained in detail by [19]. Compaction was done in three layers at different water contents (ranging from 5% - 65% by wt) using 25 blows from a standard Proctor hammer (mass—2.5 kg; drop height—305 mm) in a cylindrical mould of diameter 102.05 mm. Moisture contents for compacting each soil were chosen based on the consistency limits. The soils were left to equilibrate over night prior to compaction. Compacted soils were
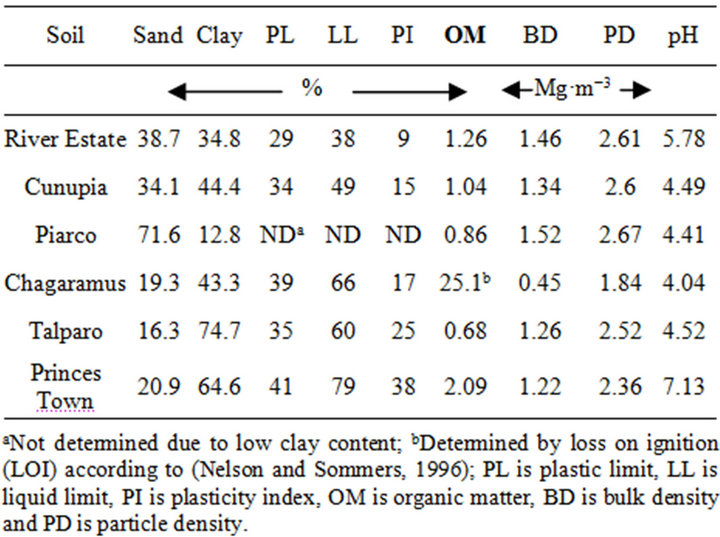
Table 1. Properties of selected soils.
oven dried at 105˚C for 24 hrs and weighed to determine dry bulk density. For soils containing expanding clay minerals, volume measurements were made directly on the soil to cater for shrinkage during drying. Additionally, replicate cores were used to determine PR and SH, using a spring type cone penetrometer (Eijkelkamp; 06.01.SA) and the CIT (Simon Deakin Instruments; CIST/882) respectively. Five readings with a 1 cm2 cone, (cone angle of 60˚), inserted to 2 cm were averaged to obtain the mean surface PR, whilst the reading corresponding to the forth drop of the hammer (mass—2.25 kg; drop height— 457 mm) was recorded as the Cmax [20]. Moisture contents of the compacted soils were determined gravimetrically.
3. Results and Discussion
3.1. Soil Physical Properties
Table 1 shows textural diversity among the selected soils, with clay content ranging from 12.8% for Piarco to 74.7% for Talparo. This variation had dual importance; firstly, the range is representative of the textural classes of local agricultural soils and secondly, the validation of the CIT in measuring and monitoring soil strength required a range of soil properties. All soils were moderately acid except for Princes Town which was slightly alkaline. OM contents were typical for mineral soils (<5%), however, Chagaramus had an elevated OM content of 25.1%. Importantly, this soil has not been surveyed and this report represents the first detailed analytical description of this soil. The high carbon content is associated with peat accumulation. The area in which this soil occurs is currently under agricultural intensification, highlighting the need for characterization for optimal use. BD values were consistent with that expected from both mineral and organic soils [21], decreasing with both clay and OM. A strong and significant negative correlation was seen between BD and OM (r2 = −0.961, p = 0.002), indicating the dominance of OM on BD.
Reference [2] showed a similar relationship for some wetland soils in Trinidad. Reference [22] indicated that OM imparted better structural arrangement to soils which lowered BD. Excluding the organic soil, clay content was the dominant factor influencing BD. A similar trend was observed for PD, values decreasing with increasing clay and OM contents, however, the relationships were not significant. The low PD for Chagaramus is associated with the high OM. The specific gravity of OM is much lower than for crystalline minerals [21].
The Atterberg limits varied among the soils. Values for plastic limit (PL) ranged from 29% - 41% with Piarco being undetermined due to lack of cohesiveness. For both limits moisture contents increased with increasing content of clay and expanding minerals (Table 1), particularly evident with the greater PI for Princes Town versus Talparo, although the latter has a greater clay content. Reference [23] showed that Princes Town had a much greater proportion of montmorillonite and vermiculite than Talparo, which was dominated by illite and kaolinite. They additionally showed that the Cunupia series had a similar clay distribution to Talparo. Table 1 shows that the PL for Talparo and Cunupia was similar, supporting this conclusion. It can be inferred that clay mineralogy imparts a strong influence on the Atterberg limits. Although Chagaramus had a clay content of 43.3% it showed a low PL and liquid limit (LL) of 11% and 28% respectively. During preparation of the sample, especially for determination of LL, the soil showed signs of aggregate integrity, which could have resulted in reduced specific surface for water absorption. Reference [3] showed increased aggregate strength under wetting for tropical soils with higher levels of OM. Although the limit values were low, Chagaramus still fell into the category of a highly plastic soil [24]. This presents challenges for use as this soil is mostly water saturated in its natural state. Talparo and Princes Town showed the highest PI, which implies that they are most prone to stress related deformation [2]. The moisture contents identified are typical during the rainy season and slumping is a common phenomenon on these soils, where proper drainage has not been implemented. The monitoring of soil moisture contents through simple devices like the TDR meter would greatly improve decision making with respect to applied stresses on these soils.
3.2. Soil Compactability and Strength
Traditionally, BD and PR have been used to assess soil compaction and strength, respectively. Many studies, both local [2] and international [25] have shown these indices to be dually important, especially in relation to crop response. However, the literature is devoid of any information on the use of the CIT in assessing soil strength conditions for agricultural and resource management purposes. A major objective of this study was to determine the feasibility of the CIT to assess both soil compaction and strength.
BD values varied across soils showing the expected trends with increasing soil water content (Figure 1). Reference [26] explained this behaviour where BD increased until peak critical values were attained and then decreased with further increases in soil water content. Variation occurred among the soils in both the shape and position of the relationship. Piarco showed responses in the lower moisture range, with a moisture content >15% resulting in reduced BD. The BD values for Piarco and Chagaramus was always higher and lower respectively, than the other soils regardless of moisture content. This finding is in agreement with other works on similar soils [26]. These authors observed that the clay soils had greater aggregate stability than the sandy soils. They also inferred that lower BDs are associated with a higher degree of aggregation in soils with high clay and OM contents. They explained that the relative amount of organic material acts to dilute the soil mineral matter effectively lowering density and reducing aggregate slaking and buffering the effects of compaction. Minimal variation of BD with water content was observed for Chagaramus.
MDBD decreased with increasing clay, expanding minerals and OM content, whilst corresponding critical moisture contents (CMC) increased (Table 2). The percentage increase in BD when compared to in-situ values, varied from 11.6% in River Estate to 166% for the peaty clay. The greater compactability of peat [27] allowed for a significantly greater amount of material to be used during compaction. In this study a compactive effort of 549 kJ·m−3, equivalent to 25 compaction blows with the standard Proctor hammer [28] resulted in true changes in BD at moisture contents well below the plastic limit. The data indicates that all soils are prone to compactive levels
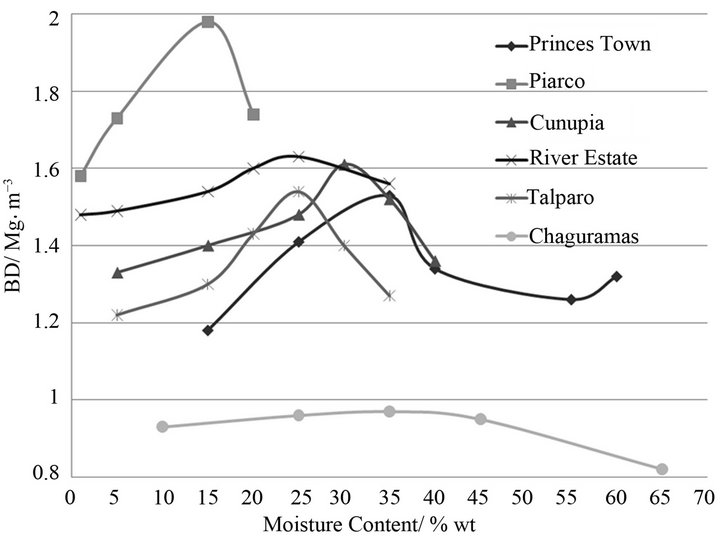
Figure 1. Dry bulk density and moisture relationships for six soils tested at high compaction (25 Proctor blows).
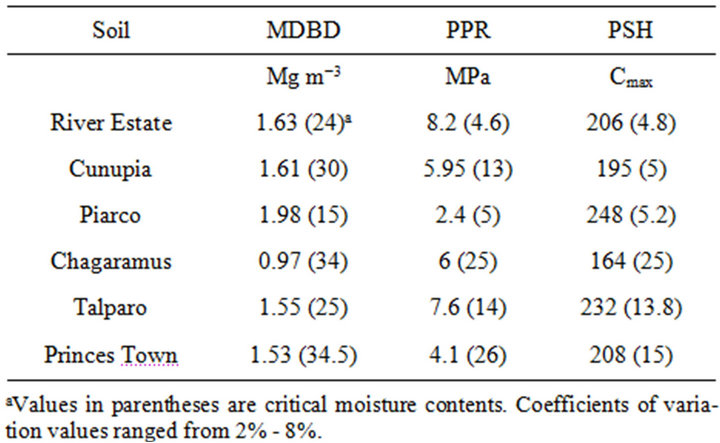
Table 2. Maximum dry bulk density (MDBD), penetration resistance (PPR), peak surface hardens (PSH) and the corresponding moisture contents.
that may limit plant development. It is clear that monitoring tools are necessary to prevent soil degradation via compaction.
PR showed a similar trend to BD with increasing water content (Figure 2). However, clear differences were observed among the soils. Piarco showed a notably lower response to water content compared to the other soils, whilst Chagaramus which had low BDs showed PR values similar to and even greater than some clay soils. The difference in response of Piarco soil to compaction and soil strength as measured by BD and PR respectively supports statements made by [29] that either parameter alone cannot be used to assess changes in the soil fabric due to compaction. Peak PR and corresponding CMC increased with increasing clay content (Table 2). Values ranged from 2.4 - 8.2 MPa and were generally in the range reported by [2]. Princes Town showed an unusually low value, considering that it is a cohesive soil. The preponderance of smectitic mineral in Princes Town [23] seemingly influenced PR, through the large water holding capacity. Although the Chagaramus peaty clay has not been mineralogically characterized, its parent material originates from the Northern Range, alluding to a dominance of 1:1 clay minerals. The influence of mineralogy on PR as assessed via the cone index requires further investigation. Reference [30] stated that OM increases soil strength and reduces the effects of compaction. This was evident in Chagaramus, which showed the 3rd highest PPR. A strong relationship exists among OM content, applied stress and soil strength. Reported PPR values were mostly greater than the ranges reported in the literature for limiting root growth [31]. Additionally, these peak values occurred below the PL, at moisture contents typically experienced during crop cultivation. An appropriate moisture content to prevent physical limitations should be between the CMC for BD and PR.
Cmax which has typically been used to determine SH of playing surfaces [10] and strength of engineering materials [11] showed the typical response curve with increasing water content. SH initially increased with increasing water content for all soils except Cunupia and Princes Town, and then decreased steadily after peak hardness was achieved (Figure 3).
Reference [11] using a similar compactive effort showed a similar relationship between Cmax and moisture content for a marl soil. Peak SH ranged from 164 - 248 Cmax with corresponding moisture contents of 5% - 25% wt. PSH and associated CMC seemed related to OM content. The former variable showed lower values for higher OM levels, with an inverse effect seen for the latter. Reference [10] alluded to the increases in SH with reductions in soil moisture at high compaction. Reference [32] showed no significant differences between sand and sand plus peat treatments for BD but significant differences were observed for PSH, with the peat treatment showing lower values. CMC for PSH was similar or slightly lower among the soils compared to PPR, but were much lower compared to PDBD. Reference [10] linked changes in soil BD to increase surface hardness. However, correlations between these indices showed a strong positive and significant (p < 0.001) relationship between SH and PR (r2 = 0.796), indicating that in this study BD was not an indicator of surface conditions and reversibly, SH was not able to assess bulk soil condition. Reference [25] also found poor relations between cone index and BD. Although SH may substitute for PR, no data exist to facilitate correlation to crop response, in-situ values under traffic or other soil properties. However, the CIT is practical where the cone penetrometer in limited, such as in sandy, dry or wet soils, or where surface layers interferes with cone insertion. Reference [25] further indicated that in high strength soils (>6 MPa) the ability to maintain uniform insertion speed and force using a hand held penetrometer is greatly diminished.
Authors have shown moisture content to be the most dominant factor affecting soil strength indices [25] and have developed predictive empirical relationships. Regression equations for the influence of water content on all three indices were significant (Table 3), with r2 values of 19.5%, 34.6% and 47.4% for BD, PR and SH respectively. The data implies that moisture content explained the greater part of the variability associated with
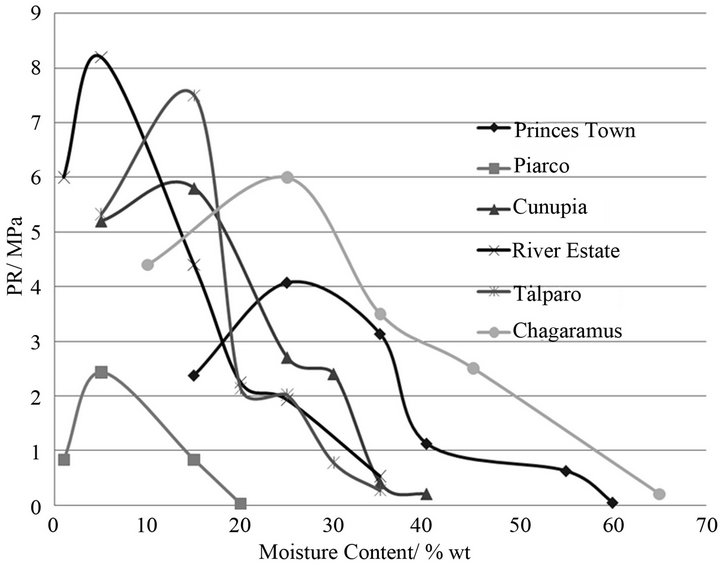
Figure 2. Penetration resistance and moisture relationships for six soils tested at high compaction (25 Proctor blows).
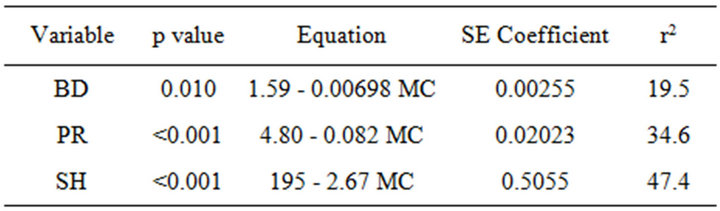
Table 3. Regression statistics for BD, PR and SH with MC.
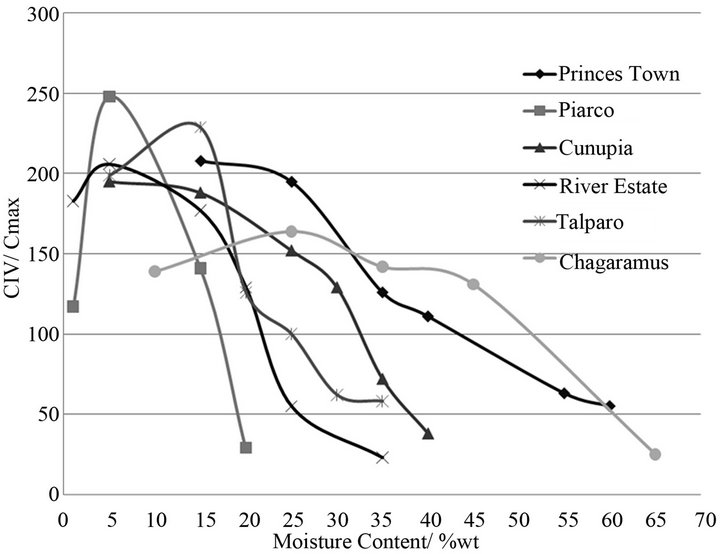
Figure 3. Surface hardness and moisture relationships for six soils tested at high compaction (25 Proctor blows).
SH. The implication of this resides in the use of moisture content as a determinant of soil strength and compaction. When used with SH may prove to be a strong indicator of soil strength.
4. Conclusion
The CIT was shown to be useful in assessing soil strength but not compaction on a range of agricultural soils. Similar responses to increasing water content after compaction was observed for SH, compared to BD and PR. Peak values and their associated CMC varied among soils and indices, with clay mineralogy and OM content having the most influential role. SH showed greater responsiveness to moisture content. Further correlation of this instrument to growth indices would provide needed information to improve its applicability to agricultural soil management.
REFERENCES
- N. Ahmad, “Soils of the Caribbean,” Ian Randle Publishers, Kingston, 2011.
- E. I. Ekwue, R. Stone and S. Ramphalie, “Engineering Properties of Some Wetland Soils in Trinidad,” Transactions of the ASABE, Vol. 18, No. 1, 2002, pp. 37-45.
- M. N. Wuddivira, R. J. Stone and E. I. Ekwue, “Clay, Organic Matter and Wetting Effects on Splash Detachment and Aggregate Breakdown under Intense Rainfall,” Soil Science Society of America Journal, Vol. 73, No. 1, 2009, pp. 226-232. doi:10.2136/sssaj2008.0053
- W. J. Busscher, P. J. Bauer, C. R. Camp and R. E. Sojka, “Correction of Cone Index for Soil Water Content Differences in a Coastal Plain Soil,” Soil Tillage Research, Vol. 43, No. 3-4, 1997, pp. 205-217. doi:10.1016/S0167-1987(97)00015-9
- J. Lipiec and R. Hatano, “Quantification of Compaction Effects on Soil Physical Properties and Crop Growth,” Geoderma, Vol. 116, No. 1-2, 2003, pp. 107-136. doi:10.1016/S0016-7061(03)00097-1
- A. G. Bengough and C. E. Mullins, “Mechanical Impedance to Root Growth: A Review of Experimental Techniques and Root Growth Responses,” Journal of Soil Science, Vol. 41, No. 3, 1990, pp. 341-358. doi:10.1111/j.1365-2389.1990.tb00070.x
- W. R. Whalley, J. Lipiec, W. Stepniewski and F. Tardieu, “Control and Measurement of the Physical Environment in Root Growth Experiments,” In: A. L. Smit, A. G. Bengough, C. Engels, M. van Noordwijk, S. Pellerin and S. C. van de Geijn, Eds., Root Methods A Handbook, Springer-Verlag, Berlin, 2000, pp. 76-112.
- J. Glinski and J. Lipiec, “Soil Physical Conditions and Plant Roots,” CRC Press, Boca Raton, 1990.
- D. J. Campbell and J. K. Henshall, “Bulk Density,” In: K. A. Smith and C. E. Mullins, Eds., Soil Analysis, Physical Methods, Marcel Dekker, New York, 1991, pp. 329-366.
- J. T. Brosnan, A. S. McNitt and T. J. Serensits, “Effects of Varying Surface Characteristics on the Hardness and Traction of Baseball Field Playing Surfaces,” International Turf Society Research Journal, Vol. 11, 2009, pp. 1-13.
- O. S. B. Al-Amoudi, I. M. Asi, H. I. A. Wahhab and Z. A. Khan, “Clegg Hammer-California Bearing Ratio Correlations,” Journal of Materials in Civil Engineering, Vol. 14, No. 6, 2002, pp. 512-523. doi:10.1061/(ASCE)0899-1561(2002)14:6(512)
- J. N. Rogers III and D. V. Waddington, “Impact Absorption Characteristics on Turf and Soil Surfaces,” Agronomy Journal, Vol. 84, No. 2, 1992, pp. 203-209. doi:10.2134/agronj1992.00021962008400020016x
- G. W. Gee and D. Or, “Particle Size Analysis,” In: J. H. Dane and G. C. Topp, Eds., Methods of Soil Analysis, Part (4), Physical Methods, 3rd Edition, SSSA, Madison, 2002, pp. 255-294.
- G. W. Thomas, “Soil pH and Soil Acidity,” In: D. L. Sparks, et al., Eds., Methods of Soil Analysis, Part (3), Chemical Methods, SSSA, Madison, 1996, pp. 475-490.
- D. W. Nelson and L. E. Sommers, “Total Carbon, Organic Carbon and Organic Matter,” In: D. L. Sparks, et al., Eds., Methods of Soil Analysis, Part (3), Chemical Methods, SSSA, Madison, 1996, pp. 995-996.
- R. B. Grossman and T. G. Reinsch, “Bulk Density and Linear Extensibility,” In: J. H. Dane and G. C. Topp, Eds., Methods of Soil Analysis, Part (4), Physical Methods, 3rd Edition, SSSA, Madison, 2002, pp. 201-228.
- A. L. Flint and L. E. Flint, “Particle Density,” In: J. H. Dane and G. C. Topp, Eds., Methods of Soil Analysis, Part (4), Physical Methods, 3rd Edition, SSSA, Madison, 2002, pp. 229-241.
- R. A. Mc Bride, “Atterberg Limits,” In: J. H. Dane and G. C. Topp, Eds., Methods of Soil Analysis, Part (4), Physical Methods, 3rd Edition, SSSA, Madison, 2002, pp. 389- 399.
- R. J. Stone, E. I. Ekwue and R. O. Clarke, “Engineering Properties of Sewage Sludge in Trinidad,” Journal of Agricultural Engineering Research, Vol. 70, No. 2, 1998, pp. 221-230. doi:10.1006/jaer.1998.0266
- F. B. Lopez and L. E. Chinnery, “Surface Hardness Characteristics of Cricket Pitches as Determined with the Clegg Hammer,” International Turf Society Research Journal, Vol. 11, 2009, pp. 38-40.
- N. C. Brady and R. R. Weil, “The Nature and Properties of Soils,” 14th Editon, Prentice Hall, London, 2008
- B. D. Kay and D. A. Angers, “Soil Structure,” In: M. E. Sumner, Ed., Handbook of Soil Science, CRC Press, New York, 1999, pp. A-229-A-269.
- N. Ahmad and C. E. Davis, “The Effects of Drying on Release of Native and Added Potassium on Six West Indian Soils with Contrasting Mineralogy,” Soil Science, Vol. 112, No. 2, 1971, pp. 100-106. doi:10.1097/00010694-197108000-00003
- A. R. Jumikis, “Soil Mechanics,” Robrt E Kriger Co., Malabar, 1984.
- R. E. Sojka, W. J. Busscher and G. A. Lehrsch, “In Situ Strength, Bulk Density and Water Content Relationships of a Durinodic Xeris Haplocalcid Soil,” Soil Science, Vol. 166, No. 8, 2001, pp. 520-529. doi:10.1097/00010694-200108000-00003
- E. I. Ekwue and R. J. Stone, “Effect of Peat on the Compactibility of Some Trinidadian Soils,” Journal of Agricultural Engineering Research, Vol. 57, No. 2, 1994, pp. 129-136. doi:10.1006/jaer.1994.1012
- R. J. Stone and E. I. Ekwue, “Soil Compressibility as Influenced by Sewage Sludge Incorporation,” Journal of Agricultural Engineering Research, Vol. 64, No. 3, 1996, pp. 227-235. doi:10.1006/jaer.1996.0063
- M. Diaz-Zorita, J. H. Grove and E. Perfect, “Laboratory Compaction of Soils Using a Small Mold Procedure,” Soil Science Society of America Journal, Vol. 65, No. 6, 2001, pp. 1593-1598. doi:10.2136/sssaj2001.1593
- D. L. McQueen and T. G. Shepherd, “Physical Changes and Compaction Sensitivity of a Fine-Textured, Poorly Drained Soil (Typic Endoaquept) under Varying Durations of Cropping Manawatu Regions, New Zealand,” Soil Tillage Research, Vol. 63, No. 3-4, 2002, pp. 93-107. doi:10.1016/S0167-1987(01)00231-8
- E. I. Ekwue, “Organic Matter Effects on Soil Strength Properties,” Soil Tillage Research, Vol. 16, No. 3, 1990, pp. 289-297. doi:10.1016/0167-1987(90)90102-J
- J. J. H. Van den Akker and B. Soane, “Compaction,” In: L. Rattan, Ed., Encyclopaedia of Soil Science, 2nd Edition, CRC Press, Boca Raton, 2005, pp. 285-293. doi:10.1021/ja0410542
- C. Waltz, S. Burnett, V. Quisenberry and B. McCarty, “Soil Amendments Affect Compaction, Soil Strength,” Golf Course Management, Vol. 68, No. 11, 2000, pp. 49- 55.
NOTES
*Corresponding author.