Open Journal of Soil Science
Vol.1 No.3(2011), Article ID:16492,9 pages DOI:10.4236/ojss.2011.13011
Influence of the Hysteretic Behaviour on Silt Loam Soil Thermal Properties
![]()
1Department of Agri-Food Engineering and Biotechnology, Universitat Politècnica de Catalunya, Barcelonam, Spain. 2Lab-Ferrer. Environmental Biophysics and Soils Consulting Center, Ferran Catolic, Cervera, Spain.
Email: carles.rubio@upc.edu
Received June 26th, 2011; revised August 30th, 2011; accepted September 10th, 2011.
Keywords: Water Content, Volume Fraction of Air, Hysteresis, Dual Needle Sensor, Heat pulse
ABSTRACT
The aim of this research is to explore the influence of hysteresis on heat transport in soils under experimental laboratory conditions. The obtained results shown that, thermal properties as are volumetric specific heat capacity (Cv) and thermal conductivity (l) showed a positive linear correlation with soil volumetric water content (q). However, thermal diffusivity values (a) shown divergences between heat transferred and soil moisture. A spatial-temporal hysteresis pattern was observed on the whole of the thermal properties. This fact was related with factors as: degree of saturation, the influence of temperature difference on the heat transport, and the geometry of the water layer around the particle.
1. Introduction
Quantity and mostly quality of soil physical data are required in many field and laboratory experiments. These dataset are used for developing, testing and applying soil thermal properties on water transport models [1-4], on virus and microbial retention and transport models [5-7], as well as, the vegetal growth studies [8,9], also for applying in the foods science [10]. Some kind of data are related with thermal properties and heat transport, such that present a relevant features in their characteristics. Thermal properties in soils are: the thermal conductivity (l), which describes the ability of the soil to transmit heat, the soil volumetric heat capacity (Cv), which describes the soil ability to store heat. Finally, the third property is the thermal diffusivity (a), defined as the ratio of the thermal conductivity to volumetric heat capacity, combining both describes the rate of transmission of temperature change within the soil [11,12].
Soil thermal properties are influenced, among other variables, mostly for particle size distribution, water content and bulk density. The particle size and its distribution have an effect on the manner in which the moisture is held [13]. Soil water content has an important role in determining soil thermal properties, due the conduction through the soil is largely electrolytic [14]. Thus, when the soil moisture increase the thermal conductivity rise, because water (thermal conductivity equal to 0.57 W·m–1·˚C–1) is a good conductor [15]. Frequently, the statement is made that thermal properties of soils at the same moisture content for different textural class is highest in sand, intermediate in loam and lowest in clay. Also, a soil with high bulk density will have a thermal conductivity and diffusivity higher than other with pore space available (due to the presence of air), where the thermal properties will be decreased [13]. The rest of soil physical properties will involve a lesser effect, whether it is compared with the water content effect [16], and bulk density.
On the other hand, in laboratory conditions thermal properties largely should be influenced for drying and wetting processes driven by water potential differences, being the relationship between water potential and water content a consequence of wetting and drying history [17]. This effect of a non-unique water-retention curve, i.e. the soil water hysteresis, is relevant for the gas-phase continuity, which influence on soil thermal properties. The hysteresis phenomenon has been well documented in the literature beginning with the work of Haines [18], and followed by other authors, such as Philip [19]; Poulovassilis and Childs [20], Kutilek and Nielsen [21], and Bristow [22] who related thermal properties with water potentials.
The purpose of our research is to explore the influence of hysteresis as one of the decisive factors to cause differences on the heat transport. Thus, the aim of our work is divided in two different task; 1) to measure and to analyze soil thermal and hydrodynamic properties, and 2) to explore the impacts of hysteresis on soil thermal properties under experimental controlled conditions.
2. Materials and Methods
Sampling plot was located in Can Solé Road, sited in the Llobregat delta plain (Northeast of Spain), where frequently there are Cynara scolymus crops. The samples were obtained between surface and 30 cm depth. To characterize the soil physical variables, particle size distribution (Psd), bulk density (BD), total organic carbon content (TOC), calcium carbonate content (CCC) were measured. Particle-size distribution was determined using the wetting sieve method (2000 to 500 mm), and a device by dispersion laser beams (Malvern Mastersizer/E) for particles smaller than 500 mm. Bulk density and total porosity were determined from undisturbed sample volume. Total carbon content was analyzed by loss on ignition at 900˚C, and inorganic carbon content by loss on ignition at 200˚C, both using a Shimadzu SSM-5000A and solid sample module. These results we allowed calculate both, TOC and CCC contents. Also, particle density was calculated.
Measurements of thermal-hydrodynamic properties on soil columns constructed specifically for this experiment were made. Figure 1 shows the column device, which was developed using methyl methacrylate component, with a inner slope of 3˚. The slope allowed a well drainage of the gravitational water content, avoiding several ponding processes in the device. To obtain a correct wetting process from the bottom of the column, the device was connected to a separatory funnel. The instrument worked as a water deposit. To obtain a well-defined drying cycle we used the communicating vessel principle.
The lower levels of the column were refilled with gravel (4 to 8 mm of diameter) and sand particle size (250 to 1000 mm). Both layers allowed to reach a necessary water level

Figure 1. Soil column device scheme used to determine the soil thermal and hydrodynamic properties. WC = FDRs probes to measure water content, h = distance (cm) of the height of displacement of the separatory funnel, SH-1 = thermal sensor to measure thermal properties.
into the column, and a homogeneity wetting process of the sample, respectively. A separatory funnel provided a moderate water potential gradient into the soil column, when was necessary to apply a suction gradient. Several sensors were placed for two different levels (a and b), and thus to control two different moisture scenarios.
To determine the thermal properties a SH-1 small dualneedle sensor (Decagon Devices Inc.) was employed. This sensor consist of two thin needles (1.3 mm diameter and 30 mm length) assembled in parallel. One needle is a heater and another is a thermal probe. A heat pulse is applied to the heater, and temperature response at the sensor is recorded as a function of time. Following the application of the heat pulse method [23,24], the temperature at the sensor probe increases rapidly to a maximum, and then decreases gradually back towards its original value.
The SH-1 thermal sensor combined with KD2-Pro (Decagon Devices, Inc.) reader-logger, use the heat pulse methodology to yield reliable and accuracy soil thermal diffusivity (a) and thermal conductivity (l) estimations. Volumetric heat capacity (Cv), was determined from thermal conductivity and diffusivity data, following the expression:
 (1)
(1)
The KD2-Pro reader-logger allowed to obtain a continuous large thermal data soil (more than 4000 thermal readings) to analyze in this experiment.
To determine the volumetric water content (q) and the water potential (y), the soil column was monitorized with two EC-5 frequency domain reflectometry probes (FDR) (Decagon Devices Inc.) and two T-5 minitensiometer (UMS GmbH). The sensors were placed in couples (one T5 and one EC5 at the same level) for two different levels (a and b). A Campbell Scientific CR-850 and Decagon Devices EM-50 data-loggers were required to collect the data. [q (y)] data from saturation to -83 kPa with minitensiometer [25-27] were measured. However, to measure the driest data a WP-4 dew point potentiometer (Decagon Devices, Inc) was used [28,29]. Both data set were used to estimate the water retention curve during the drying process. Soil water retention curve was obtained fitting the observed data to the Van Genuchten equation [30]. To estimate the hydraulic parameters of the model (qs, qr, a and N) the RETC code [31] was used.
Finally, the thermal diffusivity data as a function of water content to a third degree polynomial curve were fitted. To validate this adjustment, we used two objective quantities to express the uncertainty of the prediction method. The mean error (ME) quantifies the systematic bias between predicted and observed water contents; the root mean square error (RMSE) determines the deviation in the prediction from the measurement.
 (2)
(2)
and
 (3)
(3)
where  and
and  denote respectively measured and estimated values of volumetric water content at any specified water potential ψ, and n is the number of samples for which the ME and RMSE were calculated.
3. Results and Discussion
The studied soil from Can Solé Road was classified as silt loam textural class (USDA, 1975), with a particle size distribution for silt content always higher than 60%, mean sand content about 34%, and mean clay content about 4%. Mean bulk density is 1.47 g·cm-3 and total porosity 45%. Mean total organic carbon content was about 3.1%, and mean calcium carbonate content was 40.3%.
On the other hand, soil water retention curve (Figure 2) showed a volumetric water content close to saturation about 0.45 cm3·cm–3. The values of water content for field capacity and permanent wilting point were 0.20 and 0.09 cm3·cm–3, respectively. The van Genuchten model fitted acceptably the estimated water retention data to observed data with r @ 0.98 and p ≤ 0.01. Estimated water content values were in the range of the values found in the literature for these types of soils [32-34].
Soil wetting curves are presented in Figure 3. The two curves showed a well-defined wetting process. The wetting soil column device by two EC-5 probes was determined. For rising the capillarity between the a and b points
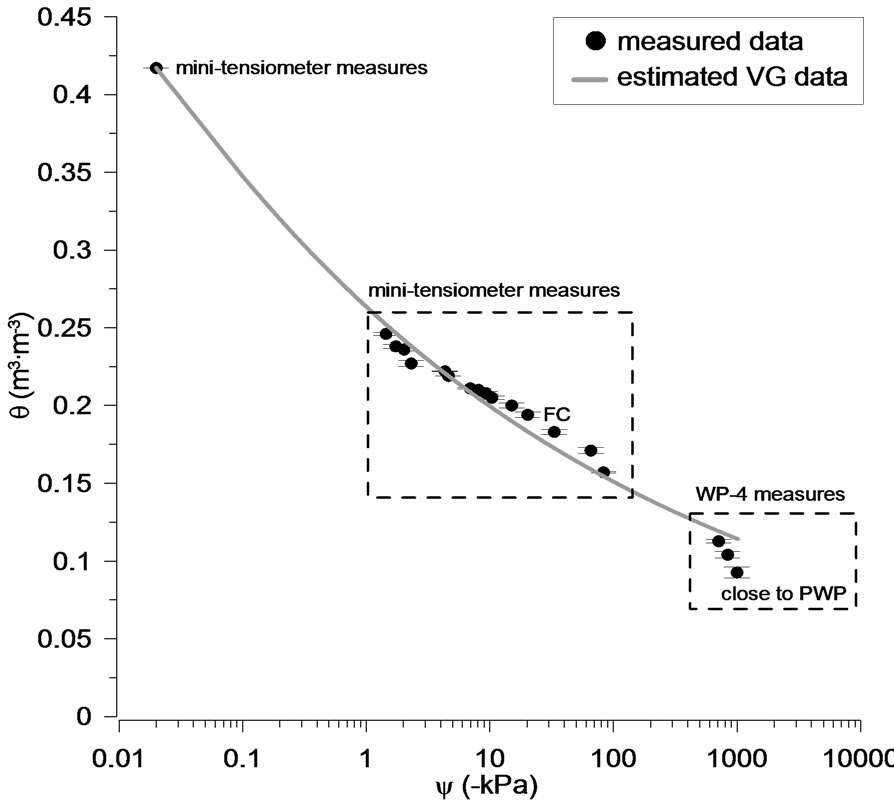
Figure 2. Estimate soil water characteristic curve for the studied silt loam soil, observed values and ± standard error. FC = field capacity, PWP = permanent wilting point.
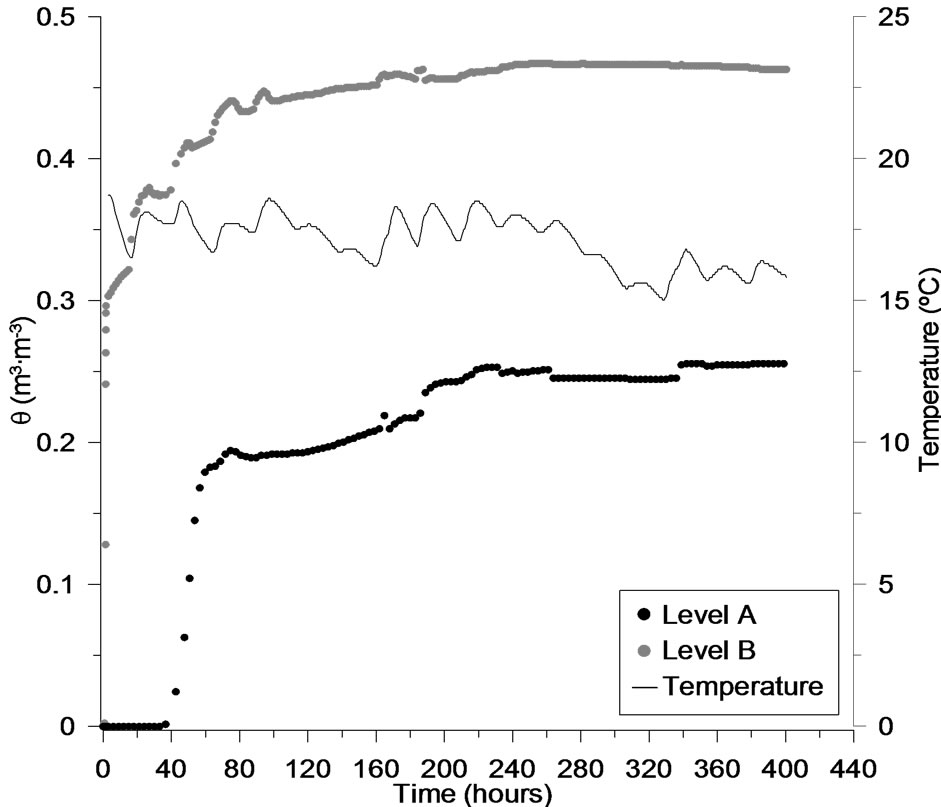
Figure 3. Soil wetting process and temperature daily cycle for the studied soil.
(separated by 12 cm) were spent 40 hours, with large differences in the water content between both levels. When the probe a (upper level) started to increase the moisture values (from 0 initial) the probe b presented values about 35% of water content. These differences decreased to 20% when the probe b (lower level) reached at saturation. In this point, both levels reached to steady-state conditions. In terms of water potential, the observed data was –1.41 kPa for level a, and close to 0 kPa for level b. The temperature line means the daily temperature cycles for the observed period. Note that exists an slight decreasing on the soil temperature (between 260 to 340 hours of observation), this fact was due to decrease the room temperature. This involved a reduction of the temperature of the water content inside the column device. Also, this affected to the evaporation demand. In these conditions, the demand of the water content from level a to level b was lower than other environment conditions, when the temperature inside the column was higher. Although, this minimal loss of the water content did not affect enough the thermal properties measurements.
Figures 4 and 5, showed the influence of water content in the thermal properties for the soil sample using the level a dataset. The thermal dataset was obtained whereas wetting process in the soil sample was carried out.
Thermal conductivity (Figure 4) and thermal diffusivity (Figure 5) were plotted versus volumetric water content, just that these two properties were directly observed data. However, the volumetric heat capacity (Figure 6) as a relation of the function a (l) were calculated data.
In Figure 4 can observe, that for a silt loam soil the thermal conductivity (l) showed a gradual increase insofar water content increased [13], presenting a strong reaction when soil moisture was higher 20% vol·vol–1.

Figure 4. Relation between soil thermal conductivity (l) and volumetric water content for wetting cycle. Grey line means time steps where the soil moisture showed a slight decreasing.
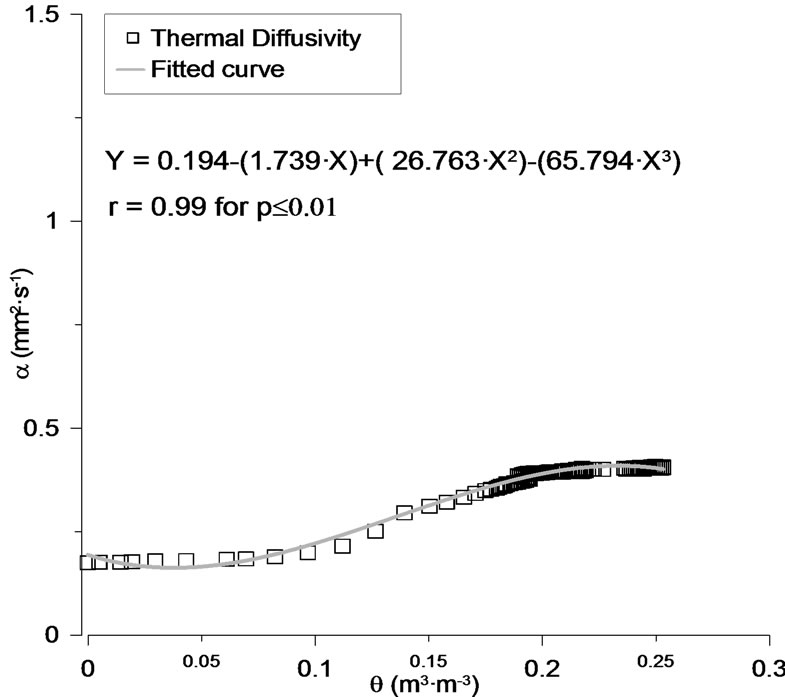
Figure 5. Relation between soil thermal diffusivity (a) and volumetric water content for wetting cycle, and fitted of third degree polynomial curve.
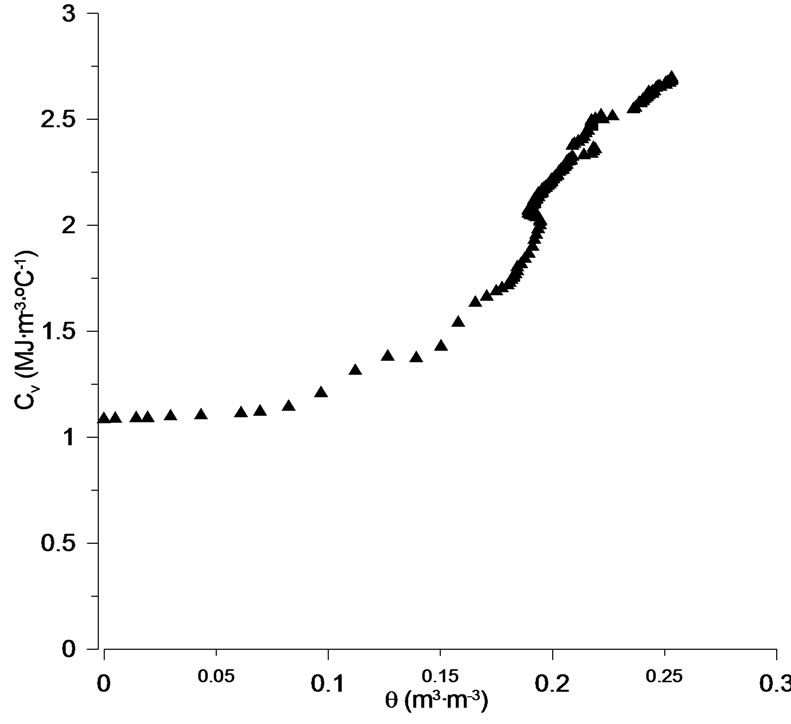
Figure 6. Relation between soil volumetric heat capacity (Cv) and volumetric water content for wetting cycle.
Therefore, greatest increase in l became during the wetting processes range. Similar results were showed by Al Nakshabandi and Kohnke [16] with the same type of soil textural class. The thermal properties (l and a), both showed a nearby steady-state scenario when the volumetric water content was close to 25% vol·vol–1, assuming a constant slope [16,22], being the water content at level a near to saturation [35,36]. During the wetting process, existed several time steps where the soil moisture showed a slight decreasing (see grey line in Figure 4), at these points the thermal conductivity values were different for a same water content data. This fact evidence a small hysteretic behaviour, related with the manner as the pore water content was drained and refilled again. This fact is treat below, in Figure 8.
Figure 5 shows the relationship between thermal diffusivity as a function of water content for a silt loam soil. Thermal diffusivity and thermal conductivity showed a similar behaviour, also with a constant slope between 10% to 20% vol·vol–1 of water content, and steady-state conditions when soil moisture was over 20% vol·vol–1. These different scenarios could be related to severe vapour transfer before to reach a high soil moisture, i.e. the fast increase of the a values between 10% and 20% vol·vol–1 of water content.
Thermal diffusivity presented an excellent relationship with volumetric water content. To fit the curve to the observed data, a third degree polynomial was used. This approach is a functional relationship selected purely by their mathematical flexibility to fit the experimental data points, being the main advantage that it does not require the determination of any additional soil parameters. Authors in the literature have also used these type of equations to relate the soil water content with different soil properties, being some of these properties e.g. the dielectric constant and the relaxation frequency of water stored in the soil (e.g., as discussed by Wobschall [37] and Topp et al. [38]).
Estimated data fitted very acceptably to observed data, with r ³ 0.99 for p ≤ 0.01. The uncertainty of the values in terms of ME and RMSE was carried out. Estimated values presented overestimations about 0.04% and a dispersion values became to 0.61%, therefore the range of error in the estimated curve was in a well-acceptance range of values for these kind of data.
Variation of volumetric heat capacity for a silt loam soil as a function of water content is shown in Figure 6. The results showed an increase of the volumetric heat capacity insofar the soil moisture was increased. Cv varied linearly with water contents between air-dried to 0.1 m3·m–3, which is in conformity with Equation (1). The slope of the curve is practically the same obtained in Figure 4 where the thermal conductivity curve was analyzed. Volumetric heat capacity did not increase uniformly with increasing water contents (Figure 6). Initially, from 0.1 m3·m–3 volumetric heat capacity increased rapidly, just that the contact among the particles was improved by the film water content [39].
Often, a common approach for presenting soil thermal properties has been to plot these properties as a function of water content. But less commonly, thermal properties have been plotted as a function of volume fraction of air (F, m3·m–3) [40]. Figure 7, shows the relationship between l, a and Cv vs F. Volume fraction of air was calculated once water content and particle density was known because the sum of the volume fraction is 1. The thermal conductivity data in Figure 7 shown that the variation in l can be explained by the variation in F between the measures. On the whole of thermal properties, the increases of F was related linearly with thermal properties decreases. The relationship between l, Cv and F was stronger (r = 0.98, Figure 7) than the relationship between a and F (r = 0.95, Figure 7). Therefore, volume fraction of air exerts a limiting effect on soil thermal properties, especially on thermal conductivity [40] and volumetric heat capacity in these measure conditions for silt loam soil.
In Figure 8(a)-(c), we show the wetting and drying cycle related to thermal properties data, which was observed for the studied soil (i.e., 34% sand, and 4% clay). All thermal properties in Figure 8 were determined for a same spatial-temporal scenario.
Existed, in general, good agreement between the thermal conductivity measurements and the soil hysteretic behaviour (Figure 8(a)), which was subject to drying and wetting cycles [22,41]. Thermal conductivity measurements at the end of the wetting process showed a linear increaseing with the soil water contents. Whereas, during the drying cycle, Figure 8(a) showed a fast reaction increasing

Figure 7. Thermal conductivity (l), volumetric heat capacity (Cv), and thermal diffusivity (a) versus volume fraction of air (F) for the studied soil.
the values of the soil thermal conductivity. When the water in porous media began to decrease, then the thermal conductivity started a rapid decreasing, in parallel to the wetting process.
Experiences performed with thermal properties in the laboratory have presented unclear phenomena. The changes in the soil temperature produced during the drying process, controlled certain divergences in the thermal dynamic behaviour, as is the case of the Figure 8, where the temperature decreased 12 Celsius degrees inside the column device (due to changes in the room temperature) during half drying cycle, involving that the evaporative demand decreased.
On the other hand, the temperature oscillation during the wetting process was negligible, maintaining steadystate conditions all time. Although, several studies carried out by De Vries [15], Campbell and Jungbauer [42], Campbell and Norman [43] about the effects of the temperature on the thermal properties, maintain that in a moist soil at room temperature 10 to 20% of the total heat transport is as latent heat through the pores. This portion of the heat transport is strongly temperature dependent, roughly doubling for each 10˚C temperature rise. Therefore, the variable temperature produced a small effect on the thermal conductivity when the temperature decreased 12˚C, such that the heat transport was reduced (see dot circles in Figure 8(a)).
Figures 8(b) and 8(c), showed the influence of water content in volumetric heat capacity and thermal diffusivity, respectively. Volumetric heat capacity (Figure 8(b)) presented a well-defined hysteresis process, and the variations of the temperature during dried curve did no affect to both cycles either.
On the other hand, Figure 8(c) showed greatest differences between both moisture cycles. Thermal diffusivity increased whereas the water content was increasing in the porous media. But, an unexpected fact occurred when the moisture cycle was opposite. During the dried curve, the values of a shown a constant increasing. To explain these divergences in a values, it may to have account the relation between water content and porous media diameter, and the spatial interaction between heat transfer and soil moisture. The most important factor is the thickness and geometry of the water layer around the particle [16], which determined the heat transfer in the system. l and especially a values would depend highly on the manner in which the best conducting mineral particles were interconnected by the less conducting water phase, and were separated by the poorly conducting gas phase [44]. Therefore, the heat transport in the soil taken place mainly through the narrow points of contact between the particles. The water around contact points formed very effecttive “bridges” for conduction of heat. However, the thin film formed around the soil particles during both processes,
 (a)
(a)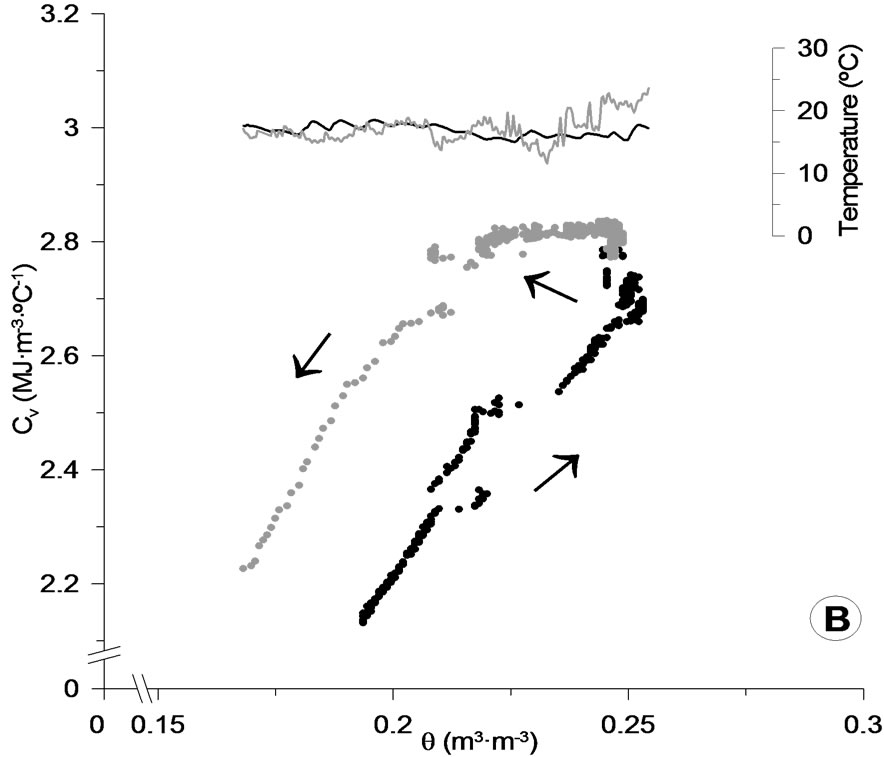 (b)
(b)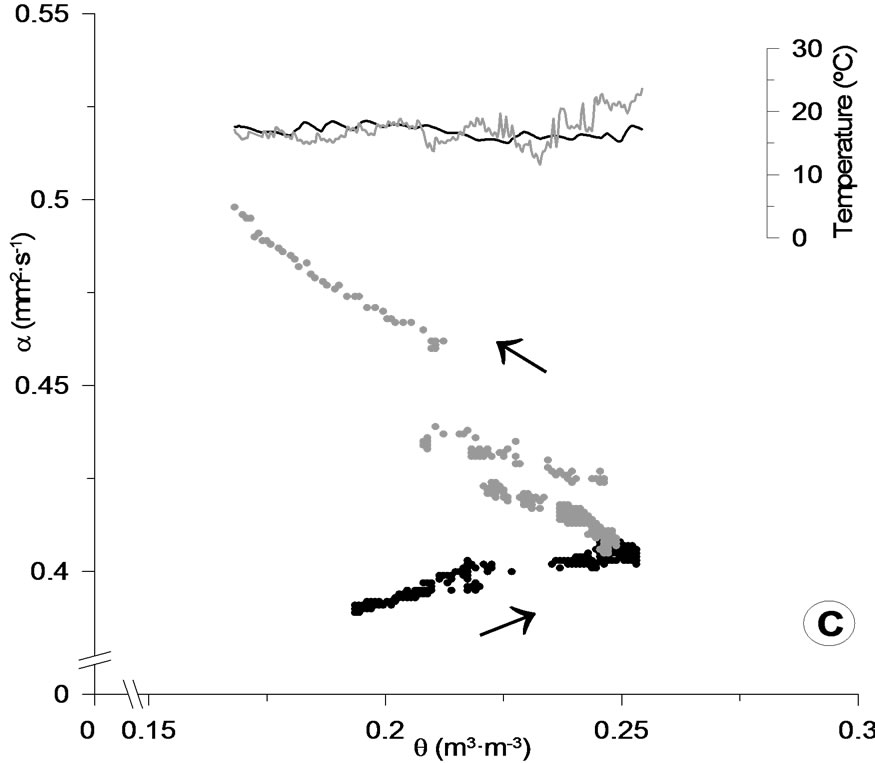 (c)
(c)
Figure 8. (a): Wetting and drying curves of the relation between thermal conductivity and volumetric water content. The lines are the temperature curves oscillation during both cycles (black corresponds to wet, grey corresponds to dry), the arrows mean the direction of the process; (b): Wetting and drying curves of the relation between volumetric heat capacity and volumetric water content. The lines are the temperature curves oscillation during both cycles (black corresponds to wet, grey corresponds to dry), the arrows mean the direction of the process; (c): Wetting and drying curves of the relation between thermal difusivity and volumetric water content. The lines are the temperature curves oscillation during both cycles (black corresponds to wet, grey corresponds to dry), the arrows mean the direction of the process.
involved different l and a values for the same water content, such as were shown in Figures 8(a) and 8(c). Also, the variations in the volume of the air fraction (see Figure 7) explained much of the variation in thermal diffusivity data rather than other variables, just that in driest measures for this soil the relationship was not typically linear.
Although, we used a deionised water to carry out the experiment, could exist a slight influence of few dissolved solids on suction, which involved changes in surface tension of the water content during the drying process [45]. This would indicate differences among the film water around the particles. Also, the variations of the temperature would influence in the rate of latent heat, yielding significant differences in the gas phase, and controlling the different scenarios occurred on both cycles. Therefore, we could assume that the values of thermal properties varied according to the thermal state of the system.
4. Conclusions
A laboratory-scale study of heat flow and water was conducted using a soil column device and time-intensive monitoring scheme. Soil thermal properties and soil water contents were measured at two depths under different soil moisture regimes. Usefulness of soil column device presented a well-defined soil wetting process, yielding an acceptable observed thermal and hydrodynamic data set. A slow capillary rise in the porous media favoured a not collapse of the porosity by the air-entry, and therefore a direct contact between the thermal sensors and soil.
The experiment produced a unique and comprehensive data set useful for quantifying the spatial-temporal dynamics of l, Cv and a based on moisture levels. The data presented here reveal several interesting features. Thermal properties showed an acceptable relationship with water content, being directly proportional the increase of water content with the increase of the observed thermal conductivity and diffusivity, therefore with the calculated volumetric heat capacity. Also, these measurements can be described as a decreasing linear function of the airfilled porosity.
The influence of the hysteretic behaviour on soil thermal properties was related with several important factors: saturation and non-saturation degree, changes on temperature and its influence on the heat transport, and the geometry of the water layer around the particle.
On the other hand, thermal diffusivity data fitted very acceptable to a third degree polynomial curve with minimal uncertainty on the data. Therefore, soil moisture could be an acceptable predictor for the thermal diffusivity for this type of soils, in spite of the equation was fitted to a particular data set. However, we are fully aware that additional experiments are indispensable to validate in different soils (e.g. in macro-porous soils) the partly conceptual and partly empirical basis of the schematization elaborated in this paper. Also, it would be convenient to be continued the investigations of the thermal hysteretic behaviour studying more variables (e.g. the effects on compacting), which can be especially sensitive on these type of data.
5. Acknowledgments
The research was founded by Lab-Ferrer Soils and Environmental Consulting Center. Likewise, we want to mention the agreements between LabFerrer and the Department of Agri-Food Engineering and Biotechnology of the Technical University of Catalunya. Also, we thank to Dr. D. R. Cobos and Dr. C. S. Campbell, both from Washington State University and Decagon Devices for their help and for fruitful discussions.
REFERENCES
- J. S. Gierke, N. J. Hutzler and D. B. McKenzie, “Vapor Transport in Unsaturated Soil Columns: Implications for Vapor Extraction,” Water Resources Research, Vol. 28, No. 2, 1992, pp. 323-335. doi:10.1029/91WR02661
- I. N. Nassar, A. M. Globus and R. Horton, “Simultaneous Soil Heat and Water Transfer,” Soil Science, Vol. 154, No. 6, 1992, pp. 465-472. doi:10.1097/00010694-199212000-00005
- D. Mallants, M. Vannclooster, M. Meddahi and J. Feyen, “Estimating Solute Transport in Undisturbed Soil Columns Using Time-Domain Reflectometry,” Journal of Contaminant Hydrology, Vol. 17, No. 2, 1994, pp. 91-109. doi:10.1016/0169-7722(94)90016-7
- I. N. Nassar, R. Horton and G. N. Flerchinger, “Simultaneous Heat and Mass Transfer in Soil Columns Exposed to Freezing/Thawing Conditions,” Soil Sciences, Vol. 165, No. 3, 2000, pp. 208-216. doi:10.1097/00010694-200003000-00003
- M. S. Smith, G. W. Thomas, R. E. White and D. Ritonga, “Transport of Escherichia Coli through Intact and Disturbed Soil Columns,” Journal of Environmental Quality, Vol. 14, No. 1, 1985, pp. 87-91. doi:10.2134/jeq1985.00472425001400010017x
- D. K. Powelson and C. P. Gerba, “Virus Removal from Sewage Effluents during Saturated and Unsaturated Flow through Soil Columns,” Water Research, Vol. 28, No. 10, 1994, pp. 2175-2181. doi:10.1016/0043-1354(94)90029-9
- P. Fine and A. Hass, “Role of Organic Matter in Microbial Transport during Irrigation with Sewage Effluent,” Journal of Environmental Quality, Vol. 36, No. 4, 2007, pp. 1050-1060. doi:10.2134/jeq2006.0265
- A. J. Cooper, “Root Temperature and Plant Growth,” Research Review, Commonweath Agriculture Bureaux, No. 4, 1973.
- G.-Y. Nie, E. J. Robertson, M. J. Fryer, R. M. Leech and N. R. Baker, “Response of the Photosynthetic Apparatus in Maize Leaves Grown at Low Temperature on Transfer to Normal Growth Temperature,” Plant, Cell and Environment, Vol. 18, No. 1, 1995, pp. 1-12. doi:10.1111/j.1365-3040.1995.tb00538.x
- A. J. Fontana, J. Varith, J. Ikediala, J. Reyes and B. Wacker, “Thermal Properties of Selected Foods Using a Dual Needle Heat-Pulse Sensor,” Transaction of ASAE, Paper No. 996063, 1999.
- S. Shiozawa and G. S. Campbell, “Soil Thermal Conductivity,” Remote Sensing Reviews, Vol. 5, No. 1, 1990, pp. 301-310. doi:10.1080/02757259009532137
- K. L. Bristow, R. D. White and G. J. Kluitenberg, “Comparison of Single and Dual Probes for Measuring Soil Thermal Properties with Transient Heating,” Australian Journal of Soil Research, Vol. 32, No. 3, 1994, pp. 447- 464. doi:10.1071/SR9940447
- D. N. Singh and K. Devid, “Generalized Relationships for Estimating Soil Thermal Resistivity,” Experimental Thermal and Fluid Science, Vol. 22, No. 3-4, 2000, pp. 133- 143. doi:10.1016/S0894-1777(00)00020-0
- M. Van Rooyen and H. F. Winterkorn, “Theoretical and Practical Aspects of the Thermal Conductivity of Soils and Similar Granular Systems,” US Highway Research Board Bulletin, Vol. 159, 1957, pp. 58-135.
- D. A. DeVries, “Thermal Properties of Soils,” In: W. R. van Wijk, Ed., Physics of Plant Environment, North-Holland Publishing Co., Amsterdam, 1963, pp. 210-235.
- G. Al Nakshabandi and H. Kohnke, “Thermal Conductivity and Diffusivity of Soils as Related to Moisture Tension and Other Physical Properties,” Agricultural Meteorology, Vol. 2, No. 4, 1995, pp. 271-279. doi:10.1016/0002-1571(65)90013-0
- D. Hillel, “Fundamentals of Soil Physics,” Academic Press, New York, 1980.
- W. Haines, “Studies in the Physical Properties Of Soil: V. The Hysteresis Effect In Capillary Properties, and the Modes of Moisture Distribution Associated Therewith,” Journal of Agricultural Science, Vol. 20, No. 1, 1930, pp. 97-116. doi:10.1017/S002185960008864X
- J. R. Philip, “Similarity Hypothesis for Capillary Hysteresis in Porous Materials,” Journal of Geophysical Research, Vol. 69, No. 8, 1964, pp. 1553-1562. doi:10.1029/JZ069i008p01553
- A. Poulovassilis and E. C. Childs, “The Hysteresis of Pore Water: The Non-Independence of Domains,” Soil Science, Vol. 112, No. 5, 1971, pp. 301-312. doi:10.1097/00010694-197111000-00002
- M. Kutilek and D. R. Nielsen, “Soil Hydrology,” Catena Verlag, Giessen, 1994.
- K. L. Bristow, “Measurement of Thermal Properties and Water Content of Unsaturated Sandy Soil Using DualProbe Heat-Pulse Probes,” Agricultural and Forest Meteorolgy, Vol. 89, No. 2, 1998, pp. 75-84. doi:10.1016/S0168-1923(97)00065-8
- H. S. Carslaw and J. C. Jaeger, “Conduction of Heat in Solids,” 2nd Edition, Oxford University Press, Oxford, 1959.
- K. L. Bristow, G. J. Kluitenberg and R. Horton, “Measurement of Soil Thermal Properties with a Dual-Probe Heatpulse Technique,” Soil Science Society of America Journal, Vol. 58, No. 5, 1994, pp. 1288-1294. doi:10.2136/sssaj1994.03615995005800050002x
- J. C. Vandervaere, C. Peugeot, M. Vauclin, R. Angulo Jaramillo and T. Lebel, “Estimating Hydraulic Conductivity of Crusted Soils Using Disc Infiltrometers and Minitensiometers,” Journal of Hydrology, Vol. 188-189, 1997, pp. 203-223. doi:10.1016/S0022-1694(96)03160-5
- R. Angulo-Jaramillo, J. P. Vandervaere, S. Roulier, J. L. Thony, J. P. Gaudet and M. Vauclin, “Field Measurement of Soil Surface Hydraulic Properties by Disc and Ring Infiltrometers: A Review and Recent Developments,” Soil & Tillage Research, Vol. 55, No. 1-2, 2000, pp. 1-29. doi:10.1016/S0167-1987(00)00098-2
- H. Nahlawi, A. Bouazza and J. Kodikara, “Surface Water Infiltration in a 1-Dimensional Soil-Geotextile Column,” In: J. Ameratunga, B. Taylor and M. Patten, Proceedings of the 10th Australia New Zealand Conference on Geomechanics, Brisbane, 21-24 October 2007.
- K. R. Brye, “Long-Term Effects of Cultivation on Particle Size and Water-Retention Characteristics Determined Using Wetting Curves,” Soil Science, Vol. 168, No. 7, 2003, pp. 459-468. doi:10.1097/01.ss.0000080331.10341.36
- V. K. S. Thakur, S. Sreedeep and D. N. Singh, “Parameters Affecting Soil-Water Characteristic Curves of FineGrained Soils,” Journal of Geotechnical and Geoenvironmental Engineering, Vol. 131, No. 4, 2005, pp. 521-524. doi:10.1061/(ASCE)1090-0241(2005)131:4(521)
- M. Th. Van Genuchten, “A Closed-Form Equation for Predicting the Hydraulic Conductivity of Unsaturated Soils,” Soil Science Society of America Journal, Vol. 44, No. 5, 1980, pp. 892-898. doi:10.2136/sssaj1980.03615995004400050002x
- M. Th. Van Genuchten, F. J. Leij and S. R. Yates, “The RETC Code for Quantifying the Hydraulic Functions of Unsaturated Soils,” US Environmental Protection Agency, Ada, EPA/600/2-91/065, 1991.
- D. R. Cameron, “Variability of Soil Water Retention Curves and Predicted Hydraulic Conductivities on a Small Plot,” Soil Science, Vol. 126, No. 6, 1978, pp. 364-371. doi:10.1097/00010694-197812000-00009
- S. C. Gupta, W. E. Larson, “Estimating Soil Water Characteristic from Particle Size Distribution, Organic Matter Percent, and Bulk Density,” Water Resources Research, Vol. 15, No. 6, 1979, pp. 1633-1635. doi:10.1029/WR015i006p01633
- J. Martínez-Fernández, A. Ceballos Barbancho, S. Casado Ledesma and C. Morán Tejada, “Estabilidad Temporal de la Humedad Edáfica Bajo Diferentes Condiciones Ambientales Mediterráneas y de Uso Del Suelo,” In: J. Álvarez-Benedí and P. Marinero, Eds., Estudios de la Zona No Saturada del Suelo, Vol. 7, 2003, pp. 77-82.
- A. Hadas, “Problems Involved in Measuring the Soil Thermal Conductivity and Diffusivity in a Moist Soil,” Agricultural Meteorology, Vol. 13, No. 1, 1974, pp. 105-113. doi:10.1016/0002-1571(74)90068-5
- R. C. M. Nobre and N. R. Thomson, “The Effects of Transient Temperature Gradients on Soil Moisture Dynamics,” Journal of Hydrology, Vol. 152, No. 1-4, 1993, pp. 57-101. doi:10.1016/0022-1694(93)90141-U
- D. Wobschall, “A Theory of the Complex Dielectric Permittivity of Soil Containing Water: The Semidisperse Model,” IEEE Transaction on Geoscience Electronics, Vol. 15, No. 1, 1977, pp. 49-58. doi:10.1109/TGE.1977.294513
- G. C. Topp, J. L. Davis and A. P. Annan, “Electromagnetic Determination of Soil Water Content: Measurement in Coaxial Transmission Lines,” Water Resources Research, Vol. 16, No. 3, 1980, pp. 574-582.
- N. H. Abu-Hamdeh, “Thermal Properties of Soils as Affected by Density and Water Content,” Biosystems Engineering, Vol. 86, No. 1, 2003, pp. 97-102. doi:10.1016/S1537-5110(03)00112-0
- T. E. Ochsner, R. Horton and T. Ren, “A New Perspective on Soil Thermal Properties,” Soil Science Society of American Journal, Vol. 65, No. 6, 2001, pp. 1641-1647. doi:10.2136/sssaj2001.1641
- K. L. Bristow, G. J. Kluitenberg, C. J. Goding and T. S. Fitzgerald, “A Small Multi-Needle Probe for Measuring Soil Thermal Properties, Water Content and Electrical Conductivity,” Computers and Electronics in Agriculture, Vol. 31, No. 3, 2001, pp. 265-280. doi:10.1016/S0168-1699(00)00186-1
- G. S. Campbell, J. D. Jungbauer Jr., W. R. Bidlake and R. D. Hungerford, “Predicting the Effect of Temperature on Soil Thermal Conductivity,” Soil Science, Vol. 158, No. 5, 1994, pp. 307-313. doi:10.1097/00010694-199411000-00001
- G. S. Campbell and J. M. Norman, “An Introduction to Environmental Biophysics,” 2nd Edition, Springer-Verlag, New York, 1998. doi:10.1007/978-1-4612-1626-1
- P. Koorevaar, G. Menelik and C. Dirksen, “Elements of Soil Physics. Developments in Soils Science 13,” Elsevier, New York, 1983.
- C. M. Case and A. Welch, “Pore Size Distribution, Suction and Hysteresis in Unsaturated Groundwater Flow,” Journal of Hydrology, Vol. 43, No. 1-4, 1979, pp. 99-120.