Open Journal of Modern Hydrology
Vol.06 No.04(2016), Article ID:70339,17 pages
10.4236/ojmh.2016.64016
Estimation of Unit Flood Discharge for Various Land Use Types with a Focus on Urbanization
Manabu Segawa*, Toshisuke Maruyama, Keiji Takase
Faculty of Environmental Science, Ishikawa Prefectural University, Ishikawa, Japan

Copyright © 2016 by authors and Scientific Research Publishing Inc.
This work is licensed under the Creative Commons Attribution International License (CC BY 4.0).
http://creativecommons.org/licenses/by/4.0/


Received: June 29, 2016; Accepted: August 30, 2016; Published: September 2, 2016
ABSTRACT
We proposed unit flood discharge model that defined as the discharge into end-order (smallest) drainage canals. The discharge acts an important role for estimating regional flooding by big rainfall events which leading roughly estimation of flood discharge associated with land use changes as urbanization. In some areas of Japan, increased urbanization with insufficient drainage canal capacity has led to increasingly frequent flooding and flood damage. The aim of this study was to investigate the effect of urbanization on unit flood discharge using a runoff model for the Tedori River alluvial fan area, Japan. The discharge was studied as collecting runoff from paddy fields, upland crop fields, and residential lots. A runoff model for various land use types in the study area was developed using actual and physical properties of the runoff sites, and parameters for paddy fields. The model was tested using 54 big events and inputted those. The maximum total runoff ratio among different land use types was observed for residential lots, and the ratio remained relatively constant across different flood events. The minimum total runoff ratio was observed for irrigated paddy fields. There was a positive relationship between the total runoff ratio and total precipitation for all land use types. Whereas, the relationship between the peak runoff ratio and peak precipitation was variable. The runoff analysis was carried out using 60-min and 10-min precipitation data. For agricultural land, data for both intervals produced similar results.
Keywords:
Unit Flood Discharge, Total Runoff Ratio, Peak Runoff Ratio, Runoff Model, Depression Storage

1. Introduction
Rapid urbanization in Japan since the late 1960s has been associated with increasingly frequent flood events and flood damage, primarily as a result of insufficient drainage canal capacity. This phenomenon of increased flood discharge likely reflects the widespread change in land use from paddy fields and upland crop fields to residential areas. The relevant researches have been performed widely [1] . Yoshikawa et al. [2] [3] studied the characteristics of runoff from paddy fields and investigated the effectiveness of runoff control devices in drainage outlets using a model. Masumoto et al. [4] developed a model based on runoff from cultivated and abandoned paddy fields to investigate the impact of cultivation on runoff characteristics. Yomota and Miura [5] studied flood discharge from paddy fields and upland crop fields under rotational use. To assist with flood prevention planning, Senge et al. [6] also developed a runoff simulation model and investigated the peak discharge ratio for the rotational use of paddy fields and upland crop fields.
While previous studies investigated changes in runoff related to cultivation, the effect of urbanization was not directly considered. Furthermore, runoff models of outflow from areas with different land use types have only been proposed conceptually (e.g., Maruyama et al. [7] ). There is no previous research using models of unit flood discharge based on the actual and physical properties of different runoff sites such as paddy fields, upland crop fields, and residential areas. In the present research, unit flood discharge was used as a measure of potential flooding discharge i.e., new concept of drainage. The unit flood discharge was defined as the discharge to end-order (smallest) drainage canals collecting runoff from various land use types.
Using the unit flood discharge, total discharge can be estimated by flood routing according to discharge systems and the changes in land use associated with urbanization that will be describe next research. A runoff model for various land use types was developed based on actual and physical properties and historic precipitation data were used to estimate total and peak discharge ratios. Another feature of the present research was the consideration of depression storage of precipitation as part of the runoff analysis. Special features of the Tedori River alluvial fan area where the study was conducted were that the residential areas were reclaimed from paddy fields on very steep hillsides. Most of the upland field areas were cultivated with soybean or wheat in rotation with rice paddies by rice production control.
In summary, a runoff model based on actual and physical properties of various land use types was developed [8] . The model’s input parameters were obtained from a field survey of the Tedori River alluvial fan area. Data on past precipitation events that required flood prevention planning were used to estimate potential unit flood discharge. Using the model and the available data, the relationship between precipitation and flood discharge in the Tedori River alluvial fan area was determined, and the changes associated with urbanization will be identified.
2. Materials and Methods
2.1. Study Site
The site selected for the present study, the Tedori River alluvial fan area, is bounded by the cities of Kanazawa to the northeast and Komatsu to the southwest. The study area is representative of the steep landscapes cultivated as rice paddies in the region of Hokuriku (Figure 1, Table 1). The elevation falls from about 80 m above sea level at the inland limit of the alluvial fan to sea level over about 11 km. The mean gradient is 1 m/140 m, which is relatively steep. The total area of the alluvial fan is 18,000 ha of which about 8000 ha are cultivated paddy fields. About 30% of the paddy fields are used as upland crop fields on the basis of the rice production control. The non-cultivated area of the alluvial fan is made up of residential developments, rivers, canals, and roads. The study area includes many rivers and numerous irrigation ditches and drainage canals. Because of the steep landscape, the lag time between peak of heavy precipitation and flood discharge is only about 2 hours from top to end of alluvial fan. The drainage river have not affected by backwater except special river mouth. Therefore, runoff is strongly affected by discharge from paddy (rice) fields, upland crop fields, and residential areas, i.e., unit flood discharge.
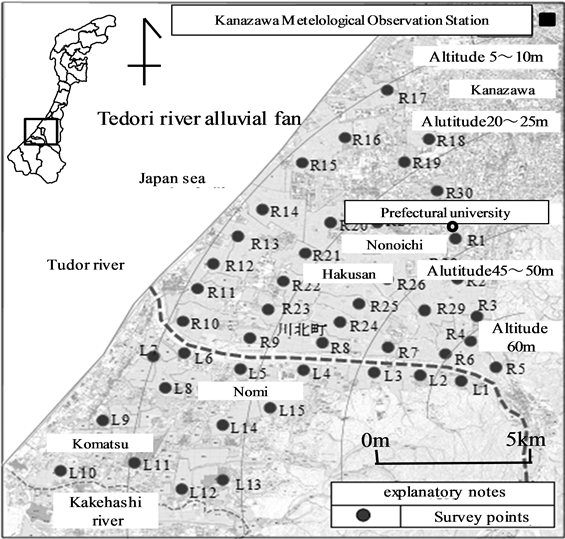
Figure 1. Outline of the Tedori River alluvial fan area and location of percolation test.

Table 1. Land use of the Tedori River alluvial fan area [9] .
2.2. Runoff Model for Various Land Use
Cultivated paddy fields are enclosed by levees and each individual field (lot) has a drainage outlet (Figure 2). The cross section of a rectangular weir as used for the runoff model is shown in Figure 2. During a flood, irrigation canals are closed so the only water input into paddy fields is from precipitation. The output is from discharge into the drainage canals, evapotranspiration, and percolation. To estimate the outflow discharge, it is necessary to apply a formula for weir discharge and a continuity equation.
2.2.1. Change in Standing Water Level and Discharge from Irrigated Paddy Fields
The continuity equation and discharge from a rectangular weir are expressed as follows [10] . Equation (2) shows the backward difference scheme for Equation (1).
 (1)
(1)
 (2)
(2)
 (3)
(3)
where Ht−1 and Ht are, respectively, water depth (mm) on the paddy field before and after calculation. q is the discharge from the weir (m3∙h−1), A is area of an individual paddy field (set as 1760 m2 based on the average size of paddy fields in the study area), R is precipitation (mm∙h−1), ET is evapotranspiration (mm∙h−1), P is percolation rate (mm∙h−1), ∆t is time difference (h) and Hmin is height of the outlet (mm). α is the discharge coefficient of the weir (set as 1.838), and b is the width of the weir (m) set as [b − 0.2 (Ht − Hmin)] [10] . The units of some parameters had to be converted to account for different time intervals (∆t) of the precipitation data. In addition, ET is usually quite small amount during flooding period.
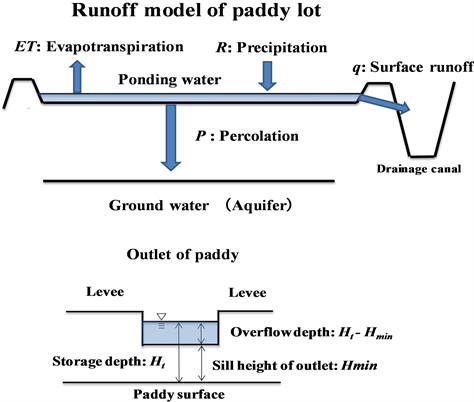
Figure 2. Schematic of a paddy field showing parameters for the runoff model.
2.2.2. Discharge from Non-Irrigated Paddy Fields and Upland Crop fields
Even at times when paddy fields and upland crop fields are not irrigated, some water from precipitation builds up in the depressions between levees. When this water exceeds the storage capacity of the fields, it is discharged into drainage channels. The volume of depression storage varies depending on the land use type (see the section on Depression storage in Results below).
In upland crop fields previously used as paddy fields, outlets into drainage weirs are usually opened. In this case, Hmin in Equation (3) is replaced by depression storage (Dep) and discharge q is calculated using Equation (2) and Equation (3) with percolation rate P (irrigated paddy) replaced by infiltration rate I (non-irrigated paddy, upland and residential area) as follows:
 (4)
(4)
 . (5)
. (5)
The area of individual fields A is again set as 1760 m2.
2.2.3. Discharge from Residential Areas
For runoff analysis for residential areas, to determine the unit time (∆t) runoff analysis was estimated before the runoff model was generated. First, the size of the average residential lot was estimated based on statistical data from the 2010 national census [11] . The total residential area in the study site was 6049 ha and there were 134,425 individual residential lots. Based on the total population of 364,425 with an average of 2.7 people per lot, the average residential lot was calculated as 449 m2. Second, the stream length in residential areas was estimated by assuming the shape of a standard residential lot to be a 25 m × 18 m rectangle. Third, the runoff time from waterways upstream of residential areas to drainage ditches below residential areas was estimated. The runoff time was calculated using a kinematic wave model [12] .
The results for precipitation rates of 10, 30, and 50 mm∙h−1; lot gradients of 0.001 and 0.01 m∙m−1; and roughness of 0.03 and 0.05, are shown in Table 2. If the runoff time is shorter than the time unit (∆t) of the precipitation data, lag time cannot be considered in the analysis. The longest calculated runoff time was 25.3 min in Table 2, so the runoff hydrograph could not be accurately estimated using a precipitation data interval of 60-min. Therefore, the runoff analysis for residential lots was carried out using 10-min precipitation data.
The runoff from residential lots was estimated using Equation (2) and Equation (6) with percolation rate P replaced by infiltration rate I in Equation (2), to satisfy Equation (4) and Equation (5). The units of some of the parameters in each equation had to be changed to account for the 10-min precipitation data. A' in Equation (6) is the area of the average residential lot (449 m2).
 . (6)
. (6)
2.3. Percolation Rate in Irrigated Paddy Fields
The percolation rate was surveyed at 135 lots (3-lot per 1 point) in irrigated paddy fields
Table 2. Runoff time from water bodies upstream of residential areas to drainage ditches for different precipitation rates, lot gradients, and roughness.
Note: Slope length: 25 m, N is roughness coefficient.
(Figure 1) before the midsummer drainage period (27th-30th May and 30th June-3th July 2014) and after midsummer drainage (31st July-1st August 2014). The percolation rate was observed as the change in the distance from the standing water level in the paddy field to the top of outlet height into the drainage weir over 24 h, minus the evaporation when no precipitation period. At the same time, the height of the levee, and the width and height of the drainage weirs were also measured. The evaporation was measured using a pan with 30 cm of diameter placed in standing water among rice plants in the paddy fields.
2.4. Infiltration Rate in Non-Irrigated Paddy Fields, Upland Crop Fields, and Residential Lots
Infiltration rate was measured at five sites for each land use type in September 2014 using infiltrometers. The infiltrometers had a diameter of 27 - 30 cm and a height of 35 cm, and were inserted about 20 cm into the ground. The measurement conducted at non-irrigation paddy lots, upland crop lots and residential area. The infiltration rate was calculated based on the method of Philip using Equation (7) [13] .
 (7)
(7)
where I is the infiltration rate (mm∙h−1), S is the sorptivity (mm∙h−1/2), t is the time (h) from the start of the measurement, and a is the final percolation rate (mm∙h−1).
2.5. Precipitation
Precipitation data were obtained from the Kanazawa Meteorological Observation Station. The station has data for 1883-2015. The data interval has increased over that time from 6 hourly in 1883-1885, to 4 hourly in 1886-1939, to hourly in 1940-2015. Since 2009, 10-min data have also been collected. For the present study, hourly precipitation data from 1940-2015 were used for paddy fields and upland crop fields, and 10-min data for 2009-2015 were used for residential areas. Events that met the flood-planning standard [14] were identified and selected.
For the analysis of paddy fields and upland crop fields, 26 flood events with rainfall > 130 mm∙24-h−1 and seven events with rainfall > 100 mm∙24-h−1 including 10 min. intensity precipitation data were selected. For residential areas, 21 flood events with rainfall > 80 mm∙24-h−1 including 10 min. intensity precipitation data were selected. There- fore, the analysis included 33 events with hourly data and 21 events with 10-min data for a total of 54 flood events. Most of the flood events occurred from June to September (81%), with one event in May, eight in June, 11 in July, nine in August, 16 in September, four each in October and November, and one in December.
3. Result of Investigation
3.1. Required Data for the Runoff Model
The statistical data of drainage weir height and levee height above the soil surface is shown in Table 3. The mean (±standard deviation [SD]) weir outlet height was 84.5 ± 27.4 mm (range, 30 - 190 mm) and the mean (±SD) levee height was 196.6 mm ± 43.6 mm (range, 100 - 360 mm). The weir width was constant at about 250 mm. The storage capacity (the difference between the weir outlet height and the water level in the paddy field) is an important parameter in calculating the runoff ratio associated with initial loss. It differs before and after midsummer drainage (Table 3). Before midsummer drainage there is standing water in the paddy fields most of the time and the mean (±SD) storage capacity was 43.1 ± 37.1 mm (range, 0 - 180 mm). After midsummer drainage, there is standing water in the fields only intermittently and the mean (±SD) storage capacity was 58.5 ± 39.9 mm (range, 0 - 190 mm).
3.2. Investigation of Percolation
The percolation of standing water in paddy fields was calculated by dividing before and after midsummer drainage. The mean percolation rate before midsummer drainage was 12.5 mm∙d−1 ± 12.5mm∙d−1 (range 0 - 62.0 mm∙d−1). The mean percolation rate after midsummer drainage was 20.5 ± 14.6 mm∙d−1 (range, 0 - 57 mm∙d−1). The values for
Table 3. Statistical properties of related items of the fields for runoff model.
*Standard deviation, **relative standard deviation.
percolation rate were not normally distributed despite the regular distribution of survey points (Figure 1). The percolation rate is estimated by subtracting evapotranspiration from decreasing of standing water depth.
In addition, comparisons were carried out between percolation rates on the right side and left side of the Tedori River, among different elevations, and before and after midsummer drainage. There was a significant difference in percolation rate before and after midsummer drainage (P-value is 0.06% < 5.0%). Therefore, the analysis was conducted separately for the periods before and after midsummer drainage.
3.3. Estimation of Percolation Rate for Each Land Use Type Using the Infiltration Test
Based on the infiltration equation, the related parameters determined using observed data by least square method and averaged at five points of those. The estimated sorptivity rate S and the final percolation rate a were, respectively, 4.6 mm∙h−1/2 and 3.4 mm∙h−1 for paddy fields, 4.1 mm∙h−1/2 and 1.7 mm∙h−1 for upland crop fields, and 11.3 mm∙h−1/2 and 1.58 mm∙h−1 for residential lots. However, if these estimations are applied directly to the runoff model, there is likely to be considerable error because of the large differences between sites [15] . Conversely, the estimated values for areas irrigated with a percolation rate of 20.5 mm∙d−1 after midsummer drainage because the examined events occurs mainly after mid-summer drainage. Therefore, this percolation rate was applied for irrigated areas. Based on the percolation rate of irrigated area, the infiltration test was used for relative values of non-irrigated paddy fields, upland crop fields, and residential areas.
In previous studies, Ando et al. [16] reported infiltration rates for residential areas of 16 mm∙h−1, and Watanabe and Toyokuni [17] applied a rate of 1.5 mm∙h−1 for their runoff recharge model for residential areas. However, if the total amount of rainfall is > 100 mm∙d−1, the accuracy of the percolation estimation has a minimal effect on the estimated peak discharge.
3.4. Depression Storage
If outlet weirs are removed from non-irrigated paddy fields and upland crop fields, the surface drainage is incomplete because of depression storage. There is also a small amount of depression storage in some residential areas. Therefore, depression storage must be included in runoff analysis. Maruyama [18] investigated the relationship between depression storage and initial ponding depth and the depression ratio by simulation at 24 non-irrigation lots in Hikone Shiga prefecture. About 35 mm of 50 mm of precipitation (70%) was stored on the soil surface.
In the present study area, there is non-irrigation of paddy fields and upland crop fields. Therefore, depression storage should be divided into two categories; cultivation that requires furrows, such as soybean crops; and cultivation that does not require furrows, such as wheat crops. Non-irrigated paddy fields can be included in the non-fur- rowed category. Maruyama and Tomita [19] investigated the storage capacity of non- furrowed fields at Toyooka and Wadayama in Hyogo prefecture and at Dainakanoko in Shiga prefecture. The results of that study were applied to the present runoff model. The furrow required for soybean cultivation account for 33% of the total area. Above investigated data applied for estimation of depression storage by simulation and put into our model because the character of agricultural land would be quite similar with the Tediri River alluvial fan area.
For residential area, previous research of depression storage in residential was applied in which lots have 4 - 6 mm [20] , 5.0 mm [17] and 6.4 mm [21] . The value of 6.4 mm was used for the present runoff model. The relationships between depression storage and precipitation for non-irrigated paddy fields, upland crop fields, and residential areas are shown in Figure 3.
3.5. Setting the Initial Conditions
The shape of generated hydrographs differs not only in terms of the amount of the precipitation input into the runoff model but also in terms of the initial conditions. The initial conditions used in the present study to investigate the unit discharge for various land use types were based on the different sites and periods of major flooding (Table 4). For example, for irrigated paddy fields, the initial condition was set as a storage capacity of 58.5 mm, which was estimated based on a mean weir outlet height of 84.5 mm
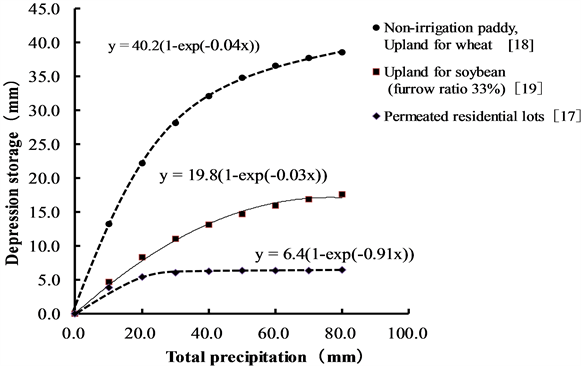
Figure 3. Relationship between total precipitation and depression storage.
Table 4. Initial conditions for runoff analysis.
*Before mid-summer percolation is 0.52 (mm/hr).
minus mean ponding depth of 26.0 mm. For non-irrigated paddy fields, upland crop fields, and residential areas, the initial condition was the depression storage. The standing water depth before precipitation was assumed to be 0 mm. In addition, evapotranspiration having limited effect on runoff discharge estimated by complementary relationship using Penman equation [22] .
4. Consideration and Discussion
The runoff model for the Tedori River alluvial fan area was based on the data described above. If precipitation data are entered into this model, the flood discharge (potential) can be estimated for various land use types. The following is an overview of simulated potential flood discharge for various land use types.
4.1. Analysis of Total Runoff Ratio
The relationship between total precipitation and total runoff ratio (total runoff/total precipitation) was relatively smooth except for residential areas (Figure 4). The total runoff ratio increased in the following order: paddy fields, non-irrigated paddy fields and upland wheat fields, upland soybean fields, and residential lots. The ratio varied depending on the initial conditions, such as the irrigation season. There was a marked difference in irrigated paddy fields, in which the total runoff ratio was strongly affected by paddy water management. The present study focused on the late irrigation season because heavy precipitation tended to occur during this time, and for this reason, the initial loss in irrigated paddy fields was 26.0 mm. Although the relationship between total runoff ratio and total precipitation was relatively smooth, this may change among flood events. The reason for this is the large storage capacity of agricultural land, which averages out the variation in runoff. In contrast, the relationship for residential lots was not smooth because of the low storage capacity.
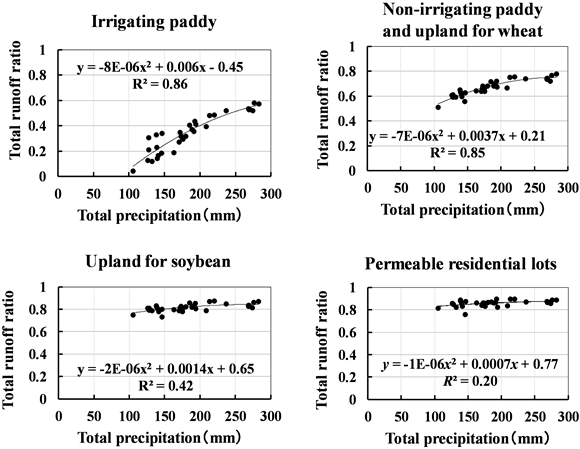
Figure 4. Relationship between total precipitation and total runoff for various land uses.
4.2. Representative Flood Discharge Estimated by 10-min and 60-min Precipitation Intensity
An example of the analysis of a flood event estimated by 10-min and 60-min is shown in Figure 5. This flood event occurred on 6th-7th of July 2012. The total discharge and
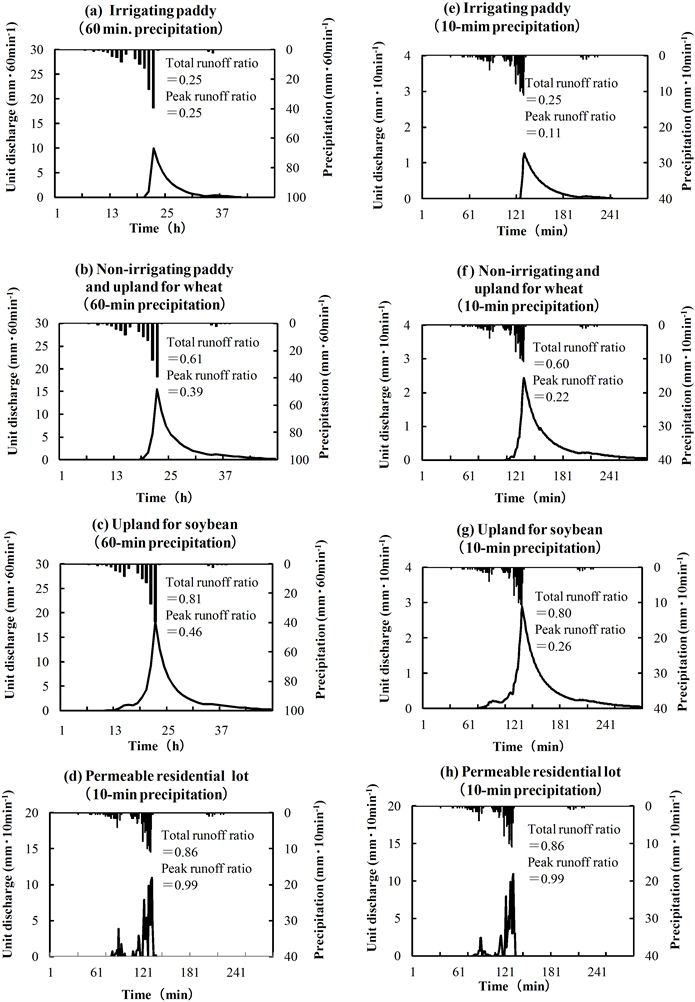
Figure 5. An example flooding discharge estimated by 10-min and 60-min precipitation intensity for various land use [Note: (a) ~ (c) show representative flood discharge for various land use estimated by 60-min unit time precipitation except residential area. (e) ~ (g) show representative flood discharge for various land use estimated by 10-min unit time precipitation except residential area. For residential lot, (d) estimated discharge by Equation (6) while (h) estimated by kinematic wave method]. There is no remarkable difference between right (10-min) and left (60-min) column.
peak discharge increased in the following order with 10-min and 60-min precipitation intensity together: irrigated paddy fields, non-irrigated paddy fields and upland wheat fields, upland soybean fields, and residential lots. The initial loss from irrigated paddy fields was larger than that for other land use types which can be observed the runoff ratio and peak runoff ratio. Especially upland crop fields with non-furrowed crops had larger initial loss than upland crop fields with furrowed crops. The hydrograph estimated by 10-min and 60-min precipitation intensity is quite similar.
4.3. Comparison of Peak Discharge between 10-min and 60-min Precipitation Intensity
In the previous sections, the flood discharge analysis was conducted using precipitation data with a time interval of 60-min, except for residential lots for which a time interval of 10-min was used. In this section, the entire analysis was carried out with precipitation data at an interval of 10-min and 60-min to determine whether the results would be the same because of the large storage capacity of agricultural land. The 21 precipitation events for which 10-min data was available were used. The 21 events were classified as flood events based on The Disaster Recovery Project [14] with precipitation > 80 mm∙24-h−1 and > 20 mm∙h−1.
The analysis was conducted as follows: For agricultural land, hourly and 10-min and 60-min precipitation data were entered into the runoff model expressed as outlined in Equation (2) and Equation (3), and the results were compared. For residential lots, the analysis was conducted using 10-min precipitation data input into Equation (2) and Equation (6) and the kinematic wave model [12] . The two analyses were then compared to verify the effectiveness of the proposed method.
The hydrographs obtained from this analysis are shown in Figure 6. For this comparison, unit of the 10-min peak discharge can be converted into a 60-min hydrograph
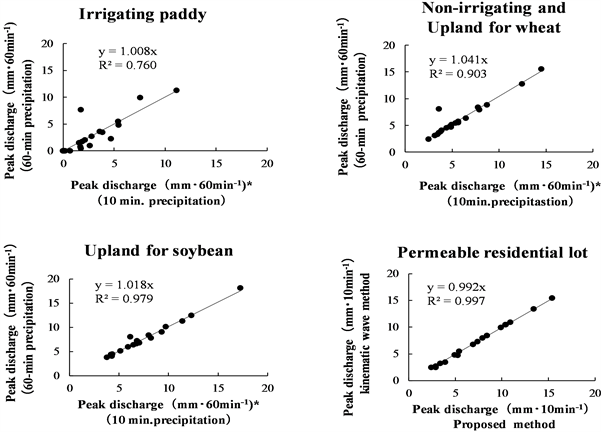
Figure 6. Relationship between peak discharge estimated by 10-min and 60- min precipitation (Note: *: 60 min. converted).
except residential lot. For residential lots, the latitudinal axes describe flood discharge calculated as precipitation minus infiltration and depression storage, that is, the effective precipitation calculated using Equation (6), while the abscise axis describe the discharge estimated by the kinematic model analysis. There was no difference between the results using the 10-min and 60-min precipitation data for all land use types.
Consequently, 60-min precipitation data are sufficient for practical estimation of agricultural land discharge. In addition, in residential lots, the effective precipitation was almost equal to the flood discharge.
4.4. Peak Runoff Ratio Depending on Lag Time between Precipitation and Runoff
Estimation of the peak discharge is very important for drainage planning. The peak runoff ratio and lag time (the time between peak precipitation and peak discharge tp), are important parameters to determine the peak discharge. However, the estimation of lag time is very difficult because the hyetograph shows random variation i.e., not smooth variation.
The peak runoff ratio can be estimated in two ways. The first is the ratio Fp1 between the average effective precipitation intensity (rpe) and the peak precipitation intensity (rp) during the unit time (∆t) of the analysis (Fp1 = rpe/rp). The second is the ratio Fp2 between the average effective precipitation intensity (rpe) and the average precipitation intensity (rae) during the lag time tp (Fp2 = rpe/rae). The average effective precipitation intensity (rpe) is reciprocally determined using the rational formula [23] . The tp is estimated usually using observation data but not here. The tp was relatively longer in paddy fields and upland crop fields, and shorter in residential lots. There was little difference between upland wheat fields and upland soybean fields.
4.5. Analysis of Peak Runoff Ratio
Figure 7 shows the peak runoff ratio Fp1 and peak precipitation intensity for the time unit of the analysis (left column), the peak runoff ratio Fp2 and peak precipitation intensity for the lag time tp (center column), and a comparison between Fp1 and Fp2 (right column). The relationship between both peak runoff ratios Fp1 and Fp2 and peak precipitation was not as smooth as the relationship between the total runoff ratio and total precipitation. The Fp1 and Fp2 increased in the following order: paddy fields, upland wheat fields, upland soybean fields, and residential lots. The peak runoff ratio Fp1 was smaller than Fp2 because the time unit of the analysis is usually shorter than the lag time tp. The values for Fp1 and Fp2 were scattered but the maximum values of the two ratios (the dotted lines in the top and middle rows of Figure 7) are useful to estimate the maximum potential flood discharge. There was little difference between Fp1 and Fp2 for residential lots; therefore, both ratios could be used.
Theoretically, the peak runoff ratio Fp2 is more appropriate for runoff analysis than Fp1. However, as shown in the left and center column in Figure 7, the scatter of the data differs little between the two ratios, although each individual value is different. Therefore,
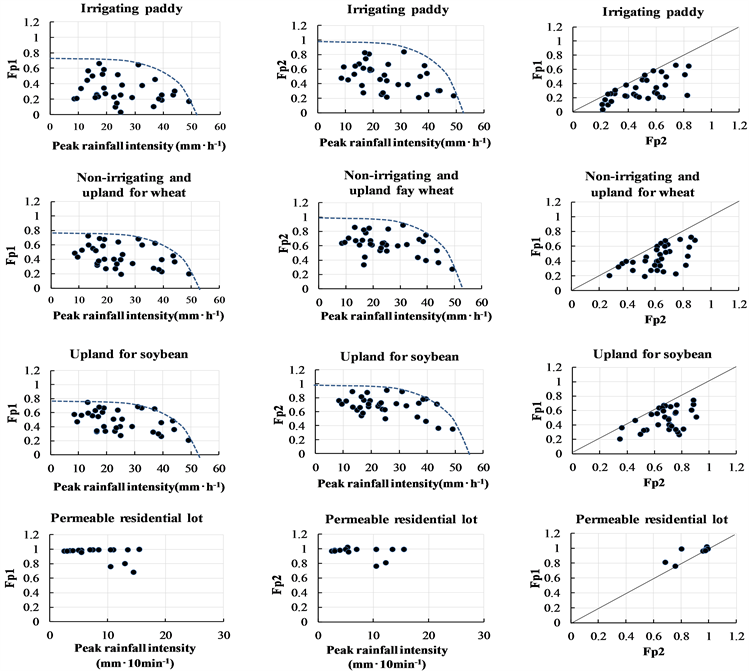
Figure 7. Relationship between peak rainfall intensity and peak runoff ratio for various land use. There is no remarkable difference in trend between Fp1 and Fp2 although the amount has small difference.
Fp1 is more practical for the runoff analysis because the estimation of lag time tp is very difficult. However, since the relationship between Fp1 and Fp2 and peak precipitation is not smooth, which indicate that there are limitations of the use of peak discharge estimation for individual precipitation events. To accurately estimate potential flood discharge, actual precipitation data must be input into the runoff model. In addition, the maximum runoff intensity in upland crop fields is 32 mm∙h−1. There is no overflow of levee because the depth is set as 102 mm at the outlet.
5. Summary and Conclusions
We proposed the unit flood discharge concept as a measure of flooding discharge potential to investigate the impact of urbanization on flooding and flood damage. First, a runoff model for paddy fields was proposed. This model differed from models proposed in previous research at that point actual and physical properties of the runoff sites were used. In other word, the previous research on runoff analysis of agricultural land is limited in to conceptual model rather than physical model, but the proposed model is basing on physical properties of agricultural land including depression storage. The discharge acts an important role for estimating regional flooding by big rainfall event and is roughly estimate of flood discharge associated with land use changes as urbanization.
Data on the area and shape of paddy fields, upland crop fields, and residential lots, the height of drainage outlets, and standing water before and after midsummer drainage were collected from 135 lots and used as input for the runoff model. The paddy field storage capacity was 40.3 mm before midsummer drainage and 58.5 mm after midsummer drainage. Percolation of 12.5 and 20.5 mm∙d−1, respectively, was observed in paddy fields before and after midsummer drainage. Second, the runoff model as expressed in Equation (2) and Equation (3) was used to analyze 54 rainfall events using 74 years of rainfall data from the Kanazawa Metrological Observation Station. In addition, parameters such as the initial standing water depth and percolation rate were determined by observation at each survey site.
The relationship between total runoff ratio and total precipitation was relatively smooth. The ratio increased in the following order: irrigated paddy fields, non-irrigated paddy fields, upland wheat fields, upland soybean fields, and residential lots. The initial runoff from paddy fields was smaller than that from other land use types and the runoff from upland crop fields was larger for crops requiring furrows (e.g., soybean) than for those that did not require furrows (e.g., wheat). The total runoff ratio is very useful to estimate the impact of urbanization on total runoff.
Runoff analysis for agricultural land was conducted using 60-min and 10-min precipitation data. There was little difference between the results using the two data intervals. Therefore, the use of 60-min precipitation data is practical and there are abundant data available. For residential lots, kinematic wave analysis was compared with analysis based on 10-min precipitation data. There was little difference between the results of the two methods. Therefore, 10-min precipitation data can be used to directly estimate potential flood discharge in residential areas.
The relationship between peak runoff ratio and peak precipitation was not as smooth as the relationship between total runoff ratio and total precipitation. There was a difference between the peak runoff ratio calculated using 60-min precipitation data (Fp1) and the peak runoff ratio calculated using the lag time between peak precipitation and peak discharge (Fp2). For the runoff analysis, Fp2 is more theoretically appropriate. However, Fp1 is more practical because estimation of lag time is very difficult. The peak runoff ratio is very useful to estimate peak discharge from precipitation; in particular, the highest peak runoff ratio is useful to estimate the maximum potential flood discharge.
It was not possible to compare observed and estimated flood discharge in the present study. However, this study confirms the value of unit flood discharge to measure the potential for flooding and flood damage in areas with various land use types, and to assess the impact of urbanization on flooding.
Acknowledgements
We wish to thank the staff of Ishikawa Prefectural Government for providing valuable information and the students of the Prefectural University for help with the infiltration investigation.
Cite this paper
Segawa, M., Maruyama, T. and Takase, K. (2016) Estimation of Unit Flood Discharge for Various Land Use Types with a Focus on Urbanization. Open Journal of Modern Hydrology, 6, 195- 211. http://dx.doi.org/10.4236/ojmh.2016.64016
References
- 1. The Japanese Industrial Standards Committee (1994) Sampling Methods for Industrial Water and Industrial Wastewater, Standard K0094. 19-25.
http://kikakurui.com/k0/K0094-1994-01.html - 2. Ishikawa Prefectural Cultural Affairs Public Access Division Statistics Information Office (2013) Population Such as Basic Aggregate Results in Ishikawa Prefectural of 2010 National Census. 128-132.
http://toukei.pref.ishikawa.jp/dl/2332/H22census_jinkou_shiryo.pdf - 3. Japanese Society of Irrigation, Drainage and Rural Engineering (1989) Handbook of Irrigation, Drainage and Rural Engineering. Version 5, Maruzen Ltd., Tokyo, 862-863.
- 4. Philip, J.R. (1957) The Theory of Infiltration, 1. The Infiltration Equation and Its Solution. Soil Science, 83, 345-357.
http://dx.doi.org/10.1097/00010694-195705000-00002 - 5. Tanakamaru, H., Kobayashi, S. and Maruyama, T. (1984) Runoff Analysis in Reclaimed Agricultural Land Considering Spatial Variability of Permeability—Change in Runoff Properties due to Reclamation (Ⅱ). Japanese Society of Irrigation, Drainage and Rural Engineering, 113, 8-16.
- 6. Ando, Y., Takahashi, Y., Izumi, K. and Kanao, K. (1985) Flood Runoff Analysis for Urban Basin Considering Infiltration Capacity for Various Land Uses. Proceedings of the Japanese Conference on Hydraulics, 29, 49-54.
- 7. Watanabe, M. and Toyokuni, E. (1989) Urban Catchment Modeling and Storm Water Runoff Simulations. Natural Disaster Science, 8, 46-63.
- 8. Maruyama, T. (1975) Water Balance of Paddy Field, Especially, on Residual Water for Surface Runoff in Paddy Field. Physical Properties of Soil, 32, 11-15.
- 9. Maruyama, T. and Tomita, M. (1975) Drainage for Residual Water at Furrows. Japanese Society of Irrigation, Drainage and Rural Engineering, 59, 9-14,
- 10. Yamaguchi, T., Matsubara, S. and Yamamori, T. (1973) Investigation of Rainfall and Runoff Relationship at Urban Area. Technical Report of Civil Engineering, 15, 37-46.
- 11. Tolin, A.L. and Keifer, C.J. (1959) The Hydrology of Urban Runoff. Journal of the Sanitary Engineering Division, American Society of Civil Engineers, 85, 47-106.
- 12. Brustsaert, W. and Stricker, H. (1979) An Advection-Aridity Approach to Estimate Actual Regional Evapotranspiration. Water Resources Research, 15, 443-450.
http://dx.doi.org/10.1029/WR015i002p00443 - 13. Disaster Management Office (2011) Ministry of Agriculture, Forestry and Fisheries Rural Development Office Maintenance Section. Disaster Prevention Division, Summary of Farmland and Agricultural Facilities Disaster Recovery Business, 1-7.
http://www.maff.go.jp/j/nousin/bousai/bousai_saigai/b_hukkyuu/pdf/panfu.pdf#search=' %E8%BE%B2%E5%9C%B0%E7%81%BD%E5%AE%B3+%E5%AE%9A%E7%BE%A9' - 14. Japanese Society of Irrigation, Drainage and Rural Engineering (1989) Handbook of Irrigation, Drainage and Rural Engineering. Version 5, Maruzen Ltd., Tokyo, 858.
- 15. Maruyama, T., Noto, F., Yoshida, M., Nakamura, K., Horino, H., Murashima, K. and Takimoto, H. (2012) Analysis of Water Balance at the Tedori River Alluvial Fan Areas in Japan. Journal of Japan Society of Hydrology and Water Resources, 25, 20-29.
http://dx.doi.org/10.3178/jjshwr.25.20 - 16. Segawa, M., Maruyama, T. and Takase, K. (2016) Estimation of Rainfall-Runoff Discharge from Unit Area of Paddy, Upland and Residential Area in the Tedori River Alluvial Fan Area. Japanese Society of Irrigation, Drainage and Rural Engineering, 302, 103-112.
- 17. Maruyama, T., Tomita, M. and Kobayashi, S. (1979) Water Balance Analysis in Special Area Using Composite Reservoir Model, 1. Feature and Structure of the Model. Journal of Agricultural Engineering, 47, 97-102.
- 18. Senge, M., Nishide, T. and Adachi, T. (1987) Runoff Simulation Model and Unit Area Surface Design Peak Runoff Coefficients of a Rotational Paddy Field. Japanese Society of Irrigation, Drainage and Rural Engineering, 131, 43-50.
- 19. Yomota, A. and Miura, T. (1982) Evaluation of Surface Discharge of Rotational Land Use of Paddy and Upland. Journal of the Agricultural Engineering Society, Japan, 50, 1027-1031.
- 20. Masumoto, T., Nozoe, M., Yoshimura, A. and Matsuda, S. (2003) A Paddy Runoff Model in Hilly Rural Areas for Evaluating Runoff Change due to Abandoned Rice Cultivation. Japanese Society of Irrigation, Drainage and Rural Engineering, 224, 175-184.
- 21. Yoshikawa, N., Nagao, N. and Misawa, S. (2009b) Watershed Scale Evaluation of Flood Mitigation Function of Paddy Field Installed with Runoff Control Devices. Japanese Society of Irrigation, Drainage and Rural Engineering 261, 273-280.
- 22. Yoshikawa, N., Nagao, N. and Misawa, S. (2009a) Evaluation of Runoff Detention Function of the Paddy Field Installed with Runoff Control Devices. Japanese Society of Irrigation, Drainage and Rural Engineering, 261, 263-271.
- 23. Kadoya, M. (1985) A Review of the Study on Runoff Changes Due to Urbanization. Journal of Japan Society of Civil Engineers, 363, 2-4, 23-34.
http://dx.doi.org/10.2208/jscej.1985.363_23