Open Journal of Modern Hydrology
Vol.4 No.1(2014), Article ID:41709,9 pages DOI:10.4236/ojmh.2014.41001
ICESat-Derived Elevation Changes on the Lena Delta and Laptev Sea, Siberia
Geophysical Institute, University of Alaska Fairbanks, Fairbanks, USA.
Email: reginald.muskett@gmail.com
Copyright © 2014 Reginald R. Muskett. This is an open access article distributed under the Creative Commons Attribution License, which permits unrestricted use, distribution, and reproduction in any medium, provided the original work is properly cited. In accordance of the Creative Commons Attribution License all Copyrights © 2014 are reserved for SCIRP and the owner of the intellectual property Reginald R. Muskett. All Copyright © 2014 are guarded by law and by SCIRP as a guardian.
Received November 19th, 2013; revised December 5th, 2013; accepted December 12th, 2013
Keywords:ICESat; GLAS; Elevation-Change; Lena Delta; Siberia; Tides; Laptev Sea
ABSTRACT
We employ elevation data from the Ice, Cloud, and land Elevation Satellite (ICESat) Geoscience Laser Altimeter System (GLAS) to investigate surface changes across the Lena Delta and sea ice of the coastal Laptev Sea, Siberia during winters of 2003 through 2008. We compare ICESat GLAS-derived elevation changes on sea ice and the Bykovskaya and Sardakhskaya Channels with datum-corrected tide gauge height measurements from Danai, Sannikova and Tiksi stations. We find the coastal sea ice and large inland ice covered channels elevation changes are in phase with the tide-height changes on a same month-year and datum-controlled basis. Furthermore, we find elevation change on tundra drained lake basins to be +0.03 ± 0.02 m, on average. These findings indicate that ICESat GLAS is capable of detection of tide fluxes of ice covered coastal rivers, and with a small error range, it is suitable for investigations of active-layer and permafrost dynamics associated with seasonal freezing (heave) and thawing (subsidence) using repeat-location profiles.
1. Introduction
The Lena River is one of the three Great Siberian River systems, as can be seen in Figure 1 [1]. It drains an area of 2.5 billion square kilometers from the Baikal Mountains to the Laptev Sea of the Arctic Ocean1. The Lena Delta is the largest delta of the Arctic freshwater river systems [2,3]. Covering more than 32,000 square kilometers this delta is a unique complex of anastomosing rivers, fluvial sediments, tundra, permafrost, Yedoma (ice and organic rich permafrost), thermokarst lakes and islands. It is the product of coastal-fluvial sedimentation and cryogenic processes, both old and younger seisomogenic fault motions and seismicity associated with the landward propagation of the Gakkel Ridge. Within the Lena Delta complex are outcrops of Devonian bedrock, remnants of a quaternary coastal plain and sand terrace of distinctive geomorphic units with the modern delta having been formed during the Late Pleistocene and Holocene with interconnected island units such as Arga Island being the largest. Cenozoic fault zones control the orientation of the Bykovskaya, Olenyokskaya and many smaller channels.
The surface morphology relief of the Lena Delta is low, mostly 5 to 10 m over a distance of 100 km (Figures 2 and 3). Very low relief is dominated by high-low centered polygons typically having 0.5 rim-height and 20 m across [4]. Numerous thaw and thermokarst lakes dot a surface broken by the anastomosing rivers of the modern fluvial system built on a relative thin active layer and underlying permafrost and ice-wedges [2,3]. Dwarf shrubs and grasses are the dominant vegetations on the delta [5].
Our research interest is to investigate elevation change on the Lena Delta and coastal sea ice of the Laptev Sea, (Figure 1). We use data from a NASA space-borne laser altimeter system referenced to the International Terrestrial Reference Frame (ITRF) and compare with datum-controlled geodetic tide gauge measurements at three stations on the coast of the Laptev Sea on a same time and datum basis.
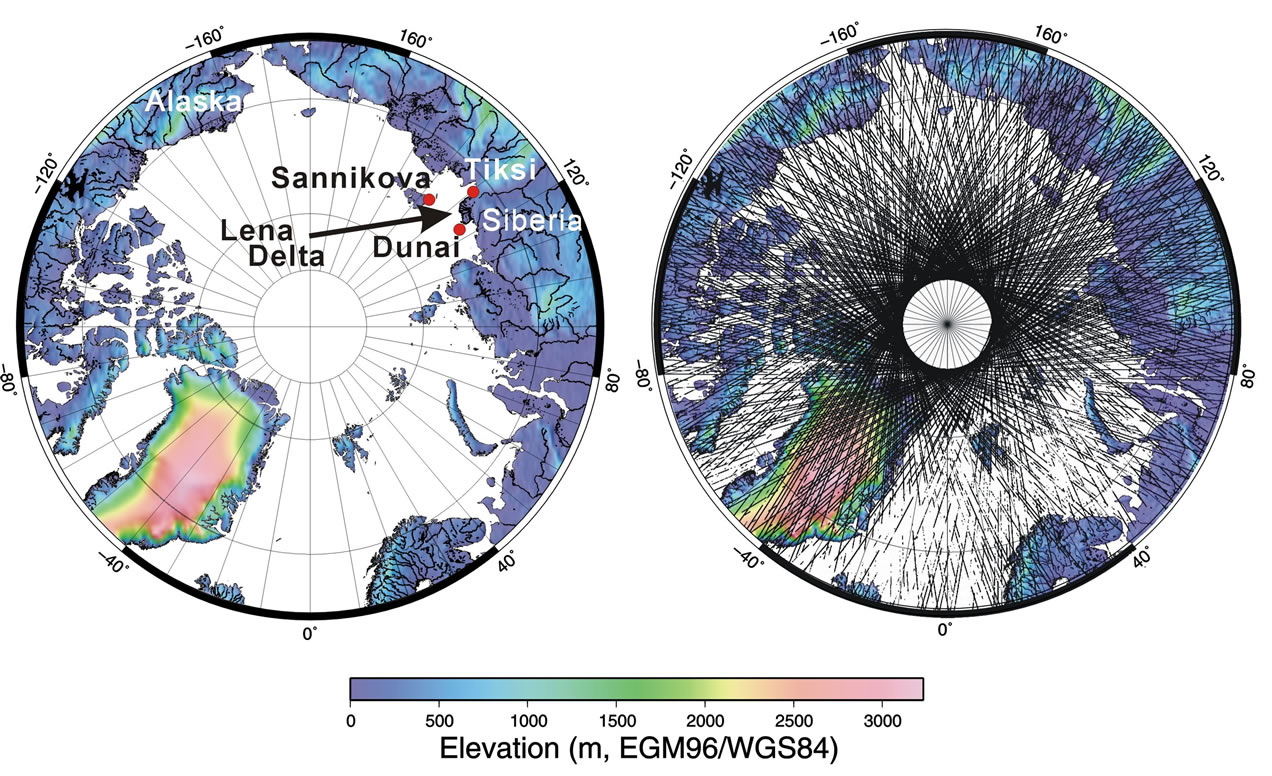
Figure 1. Northern hemisphere illustrated by elevations from the ESA-funded Altimetry Corrected Elevation 2 Digital Elevation Model (ACE2 DEM). The right plot shows the ground track of ICESat GLAS laser campaign L2D. Russian tide-gauge stations Dunai, Sannikova and Tiksi are shown for reference.
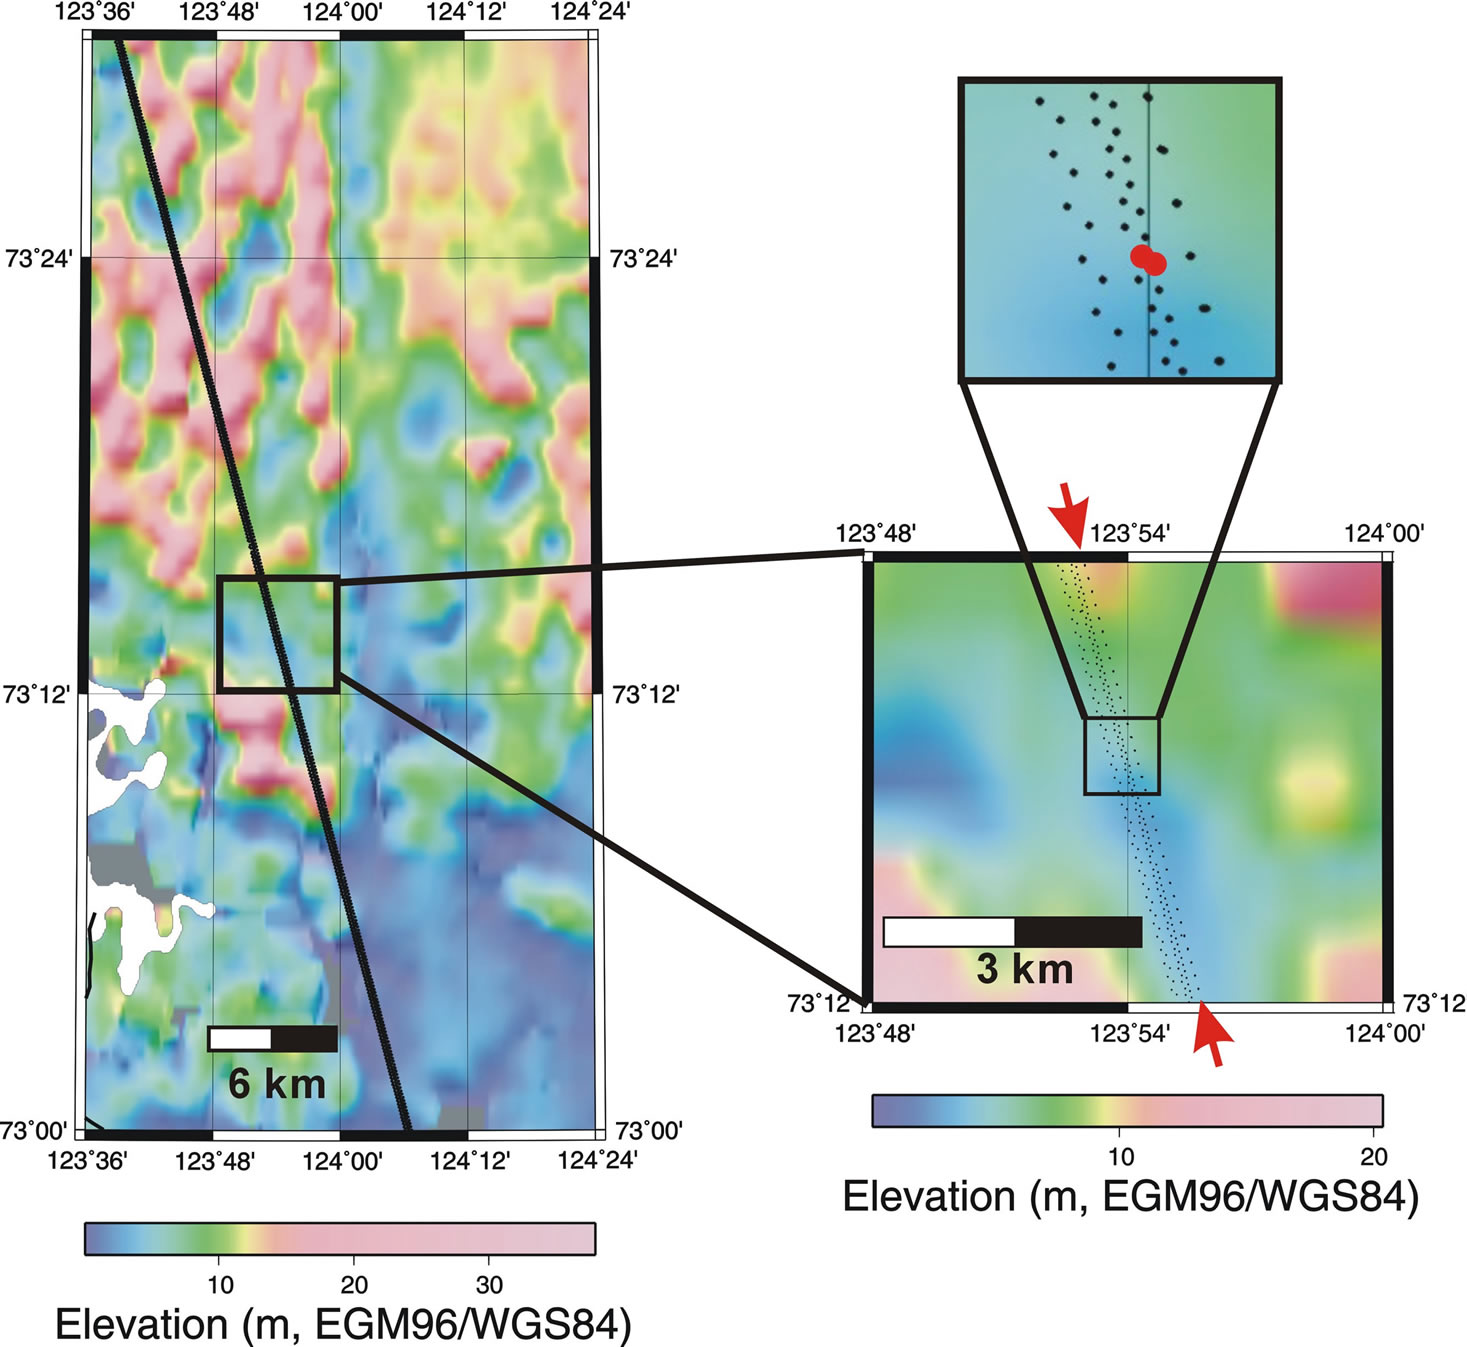
Figure 2. Close-up plots of ICESat GLAS ground points crossing the west side of the Lena Delta. The ACE2 DEM provides elevation and geomorphology within the plots. The highest magnification zoom shows six ground tracks, points, of which only one par identified by red 60 m spots forms a repeat-location pair for elevation differencing.
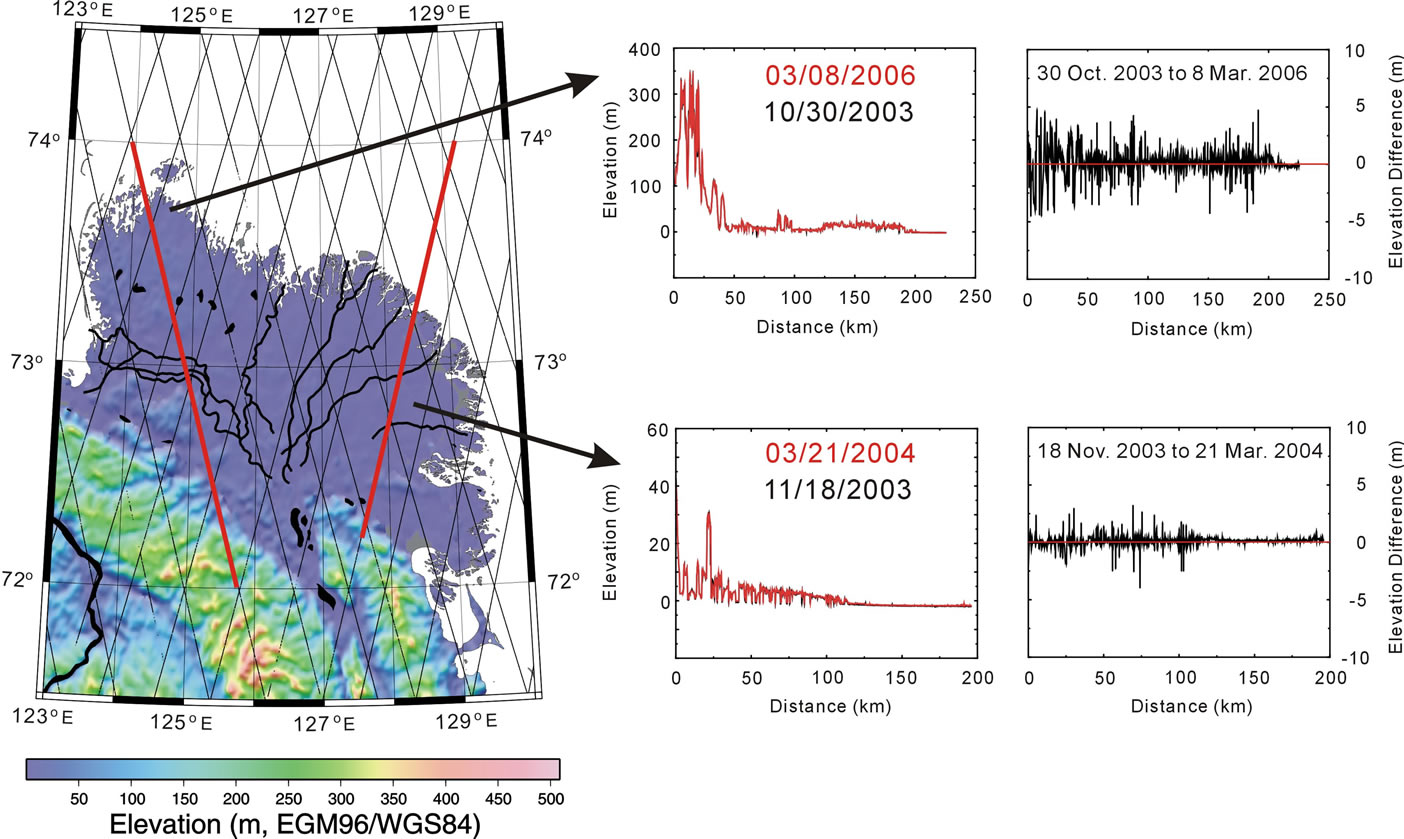
Figure 3. Two sets of repeat-location pairs of ICESat GLAS elevation profiles and differences (i.e. changes) crossing different geomorphic units of the Lena Delta. Pattern of ICESat ground tracks shown for reference.
During the recent decades Arctic permafrost especially coastal and sub-sea bed areas are showing indications of degradation, thawing and increasing vulnerability from physical processes driven by climate change [1,6-13]. The Lena Delta contains numerous thaw and thermokarst lakes. Degradation, erosion and thawing of Yedoma associated with thermokarst lake expansion have the potential to release significant quantities of CH4 and CO2 to the atmosphere. On the hemispheric scale these fluxes have the potential to cause a positive feedback loop with climate change processes [13]. The Lena Delta offers a test region for the application of space geodesy methods for surface change detection at the centimeter scale of measure.
2. Data
2.1. NASA Ice, Cloud and Land Elevation Geoscience Laser Altimeter Mission
Launched January 2003 the NASA ICESat mission utilizing the 2-channel 3-laser GLAS, Light Detection and Ranging system, provides high-quality global atmosphere, elevation and vegetation measurements [14]. Regional studies of Arctic Ocean basin dynamic topography and freeboard, large inland lakes and tides of the Ross Ice Shelf illustrate its uses [15-17]. ICESat’s polar orbit from 600 km altitude covered 86˚ N to 86˚ S latitude in a period of 14.8 orbits per 24 hours [18]. The original mission design called for laser acquisitions on 8-day and 91-day repeat orbit cycles to be completed in the 3-year expected mission-length. After the failure of Laser 1 on day-38 of the mission, operation of Lasers 2 and 3 were scheduled for roughly 30-day intervals within the 91-day repeat cycle on seasonal campaigns relative to Earth’s ice sheets, Figure 1. This effectively extended the mission well beyond the original design. The data acquisition part of the mission ended in October 2009, with the failure of Laser 2 (which had been successfully restarted after the failure of Laser 3 in 2008). ICESat was subsequently retired-decommissioned February 2010 and atmosphere re-entry occurred August 20102.
GLAS utilized 532 nm (atmosphere channel) and 1064 nm (surface channel) lasers pulsing at 40 times per second [18]. The nominal-circular footprint diameter is about 60 m to 70 m and displaced about 170 m along track, Figure 2. Onboard GPS (dual system), star camera and down-point reflector cones for ground-station laser ranging provides for precise orbit determination and mapping ICESat inertial reference frame to the International Terrestrial Reference Frame for precise positioning knowledge. Shot-to-shot error budget utilizing mission calibration-validation campaigns show accuracy better than 5 cm on flat terrain, Table 1 [14,19]. During and
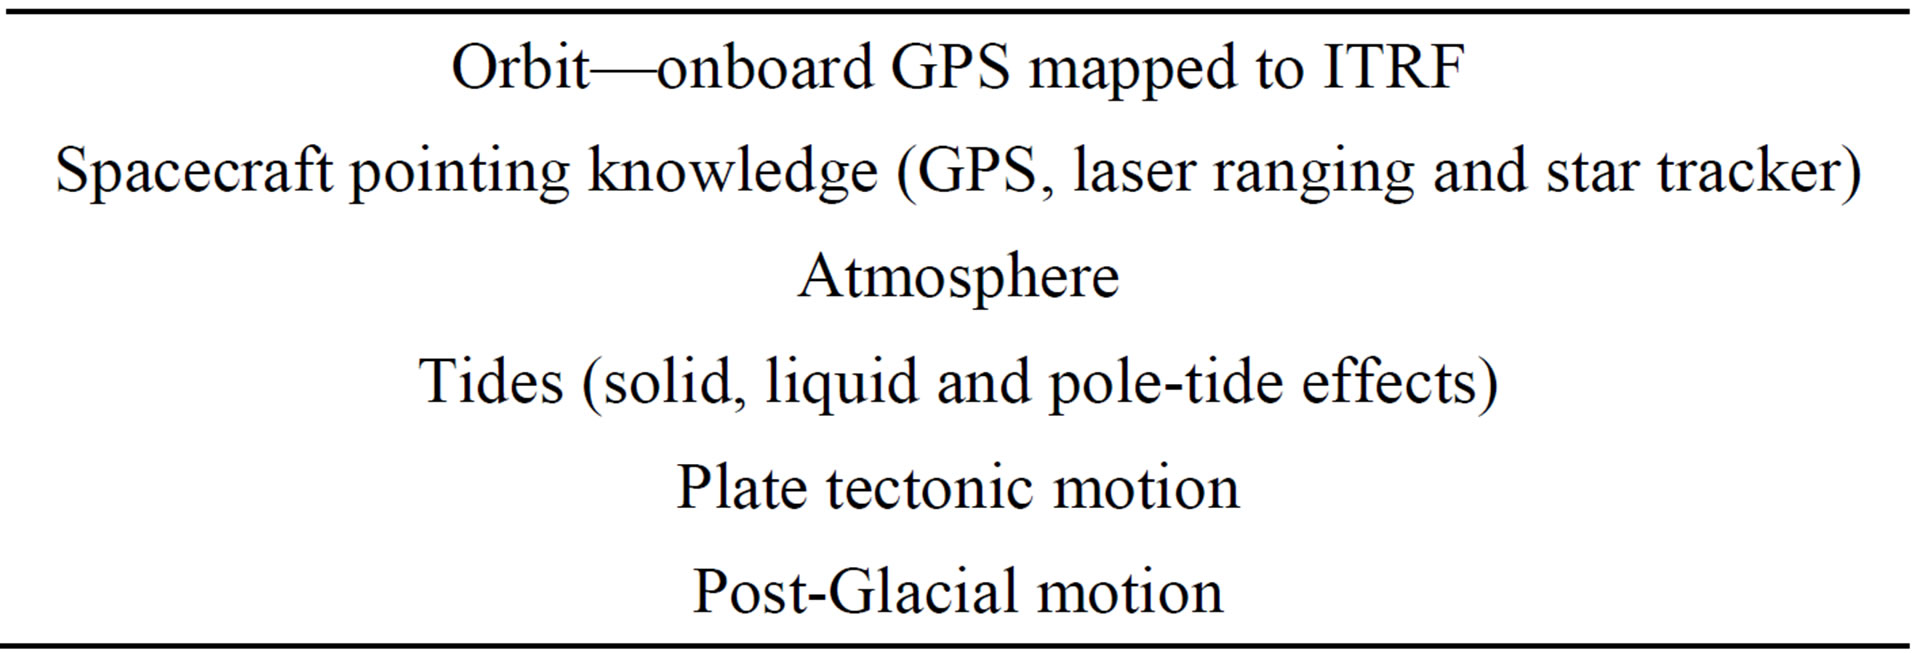
Table 1. Mission processing adjustments.
post-mission re-processing of the data continues with refinement of orbit-pointing knowledge and corrections for atmosphere parameters and tidal effects, Table 23.
In previous investigations we used ICESat GLAS global elevation data GLA06 in the assessments of glacier mass balance and frozen tundra lake surface elevation comparisons to near-concurrent static and kinematic GPS surveys [19-22]. For this investigation we selected GLA06 versions 28 through 33 at quality levels 4 through 6 from campaigns of Laser 2 (L2) and Laser 3 (L3), Table 3, that have overlapping footprints by geolocation, Figure 2. Prior to data version 33 the ellipsoid reference was TOPEX-Poseidon, which we converted to WGS-84. Version 33 and on uses ellipsoid reference WGS-84. To convert the ellipsoid heights to elevations we utilize the Earth Geopotential Model 1996 (EGM96), which is consistent with ITRF epochs.
2.2. PSMSL Datum Controlled Tide Heights
We utilize monthly mean tide height records from the Permanent Service for Mean Sea Level (PSMSL) under the auspices of the International Council for Sciences [23]. Out of the global data bank of 2067 (850 active) station records we use those that are quality inspected (nearest neighbor checking and expert evaluation) and are datum corrected, revised local reference, for consistency. Hourly and 4-per-hour tide height recordings have an accuracy of 0.01 m. It is estimated that the monthly records error does not exceed 0.02 m at the probability of 99.7%4. Since 2000 many of the datum controlled stations have been equipped with Global Navigation System of Systems receivers. This allows for greater datum reference constraints with respect to global isostatic adjustments within the confines of the ITRF realizations [23]. We use three stations in Siberia on the Laptev Sea coast at Dunai (Dunay Island), Sannikova (Kotelny Island) and Tiksi, Table 4. These are the closest to our ICESat ground tracks whose monthly records span 60 years through 2010, Figure 1. The data authority of these tide stations is the Arctic and Antarctic Research Institute, Russian Federal Service for Hydrometeorology and En-
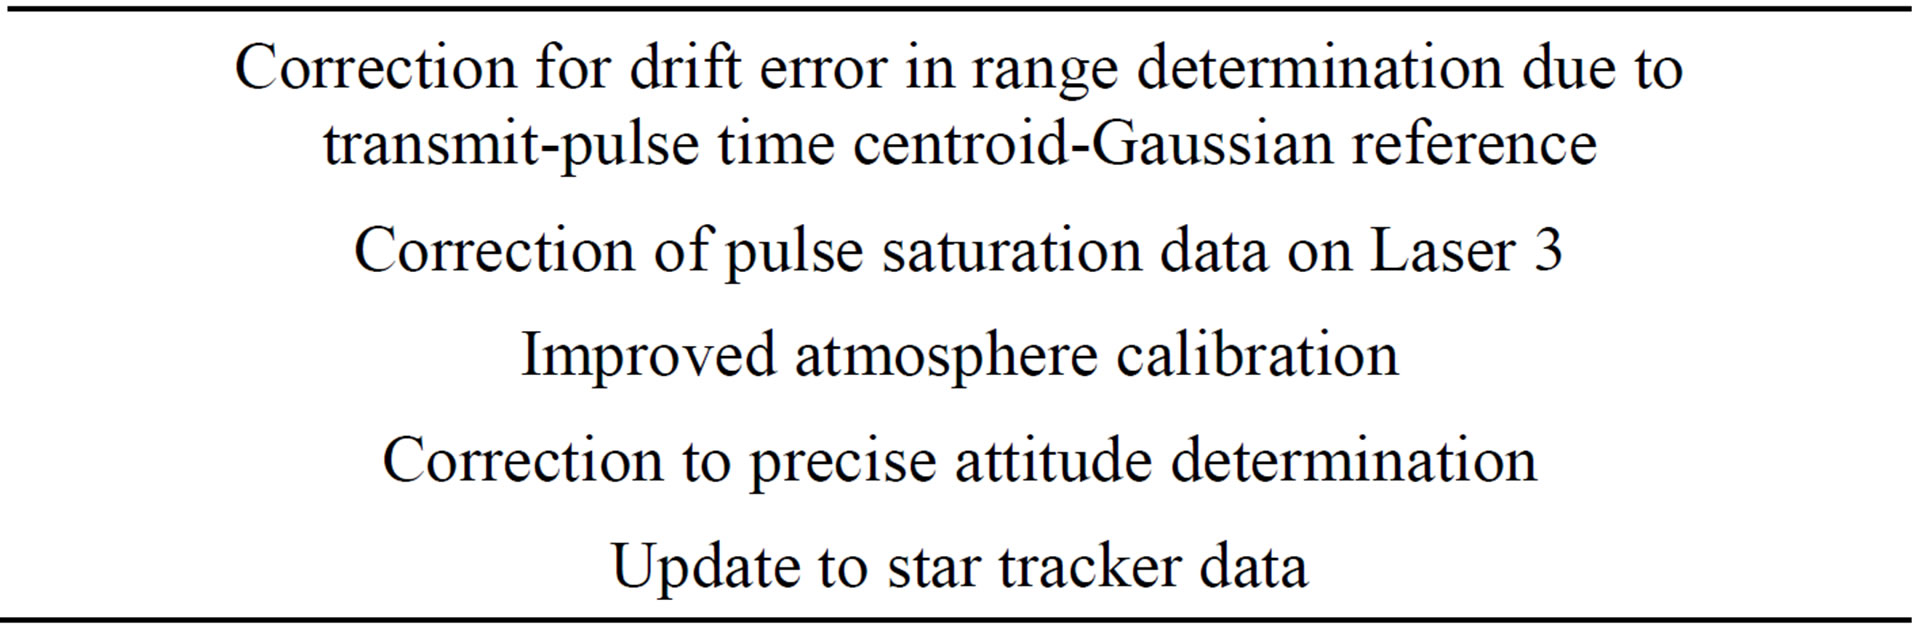
Table 2. Post-mission adjustments.
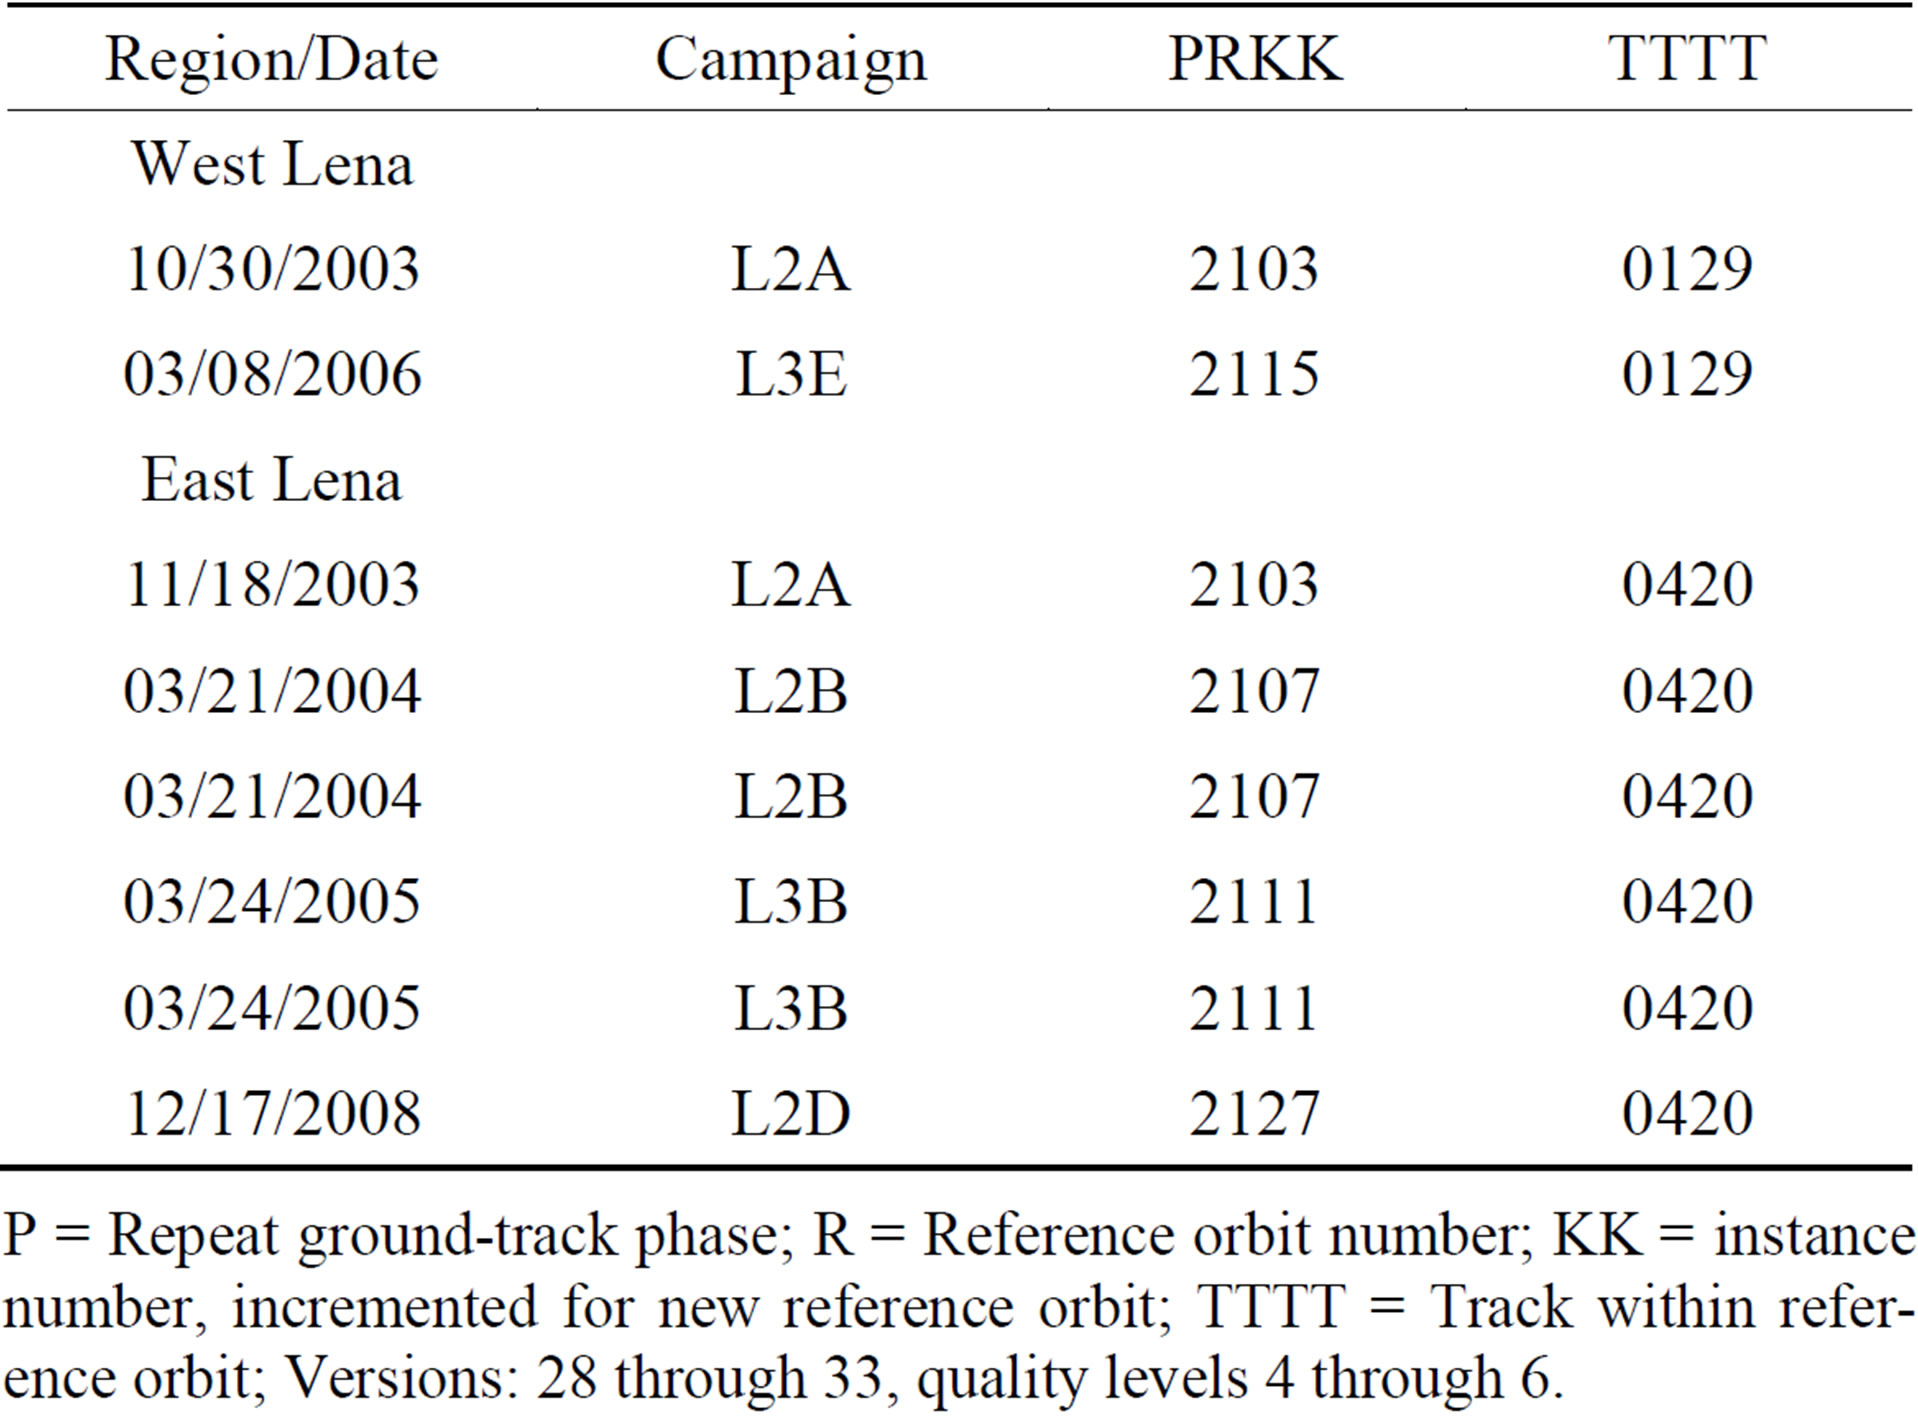
Table 3. ICESat glas data pairs used for elevation change detection.
P = Repeat ground-track phase; R = Reference orbit number; KK = instance number, incremented for new reference orbit; TTTT = Track within reference orbit; Versions: 28 through 33, quality levels 4 through 6.
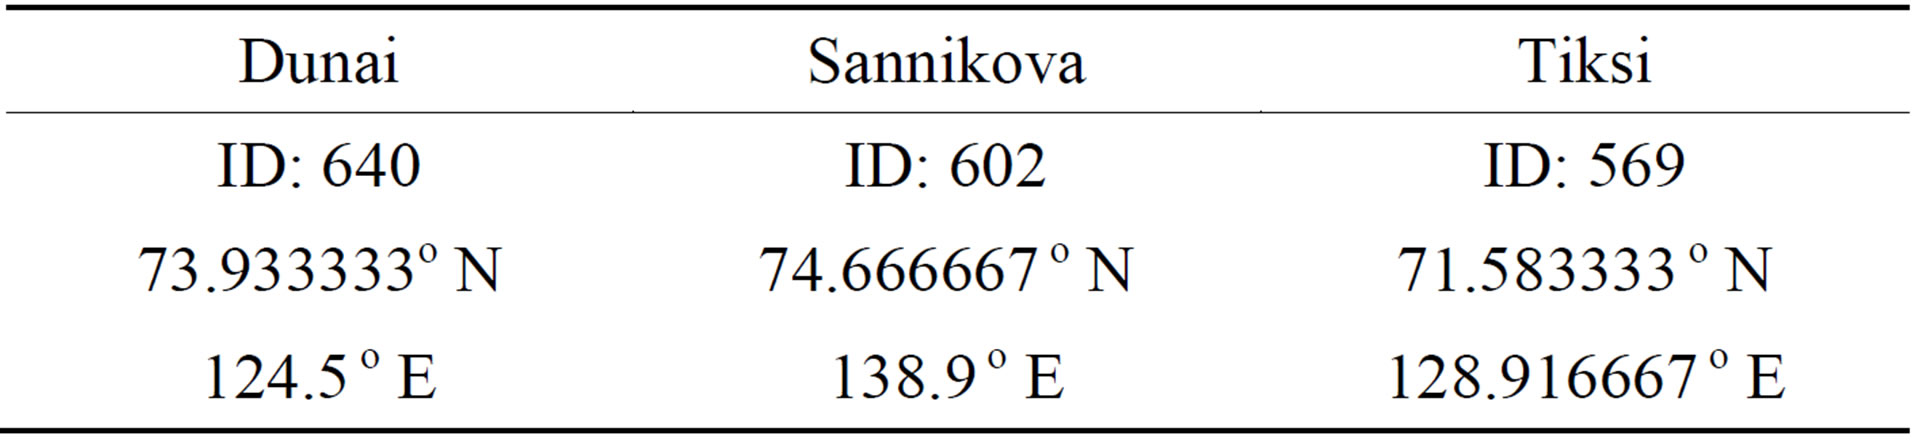
Table 4. Datum controlled tide stations, Laptev Sea.
vironmental Monitoring, St. Petersburg, Russia.
3. Results
The results of our investigation are presented in Figures 3 through 6 and Tables 5 through 9. Figure 3 shows the ICESat GLAS repeat-location elevation and difference (i.e. elevation changes) profiles crossing the Lena Delta and on the sea ice of the Laptev Sea. The elevation profiles and changes are distinctive relative to the land-portion and the sea ice-portion. The left-side profiles and change cross Arga Island show a wider variation in the east-side profile and change. This is an expression of the different geomorphic units, snow-depth character and icesnow covered thermokarst lake and river water level changes at their respective winter years. The sea ice portions of the profiles show smaller elevation change variations.
Figure 4 shows the repeat-location elevation change profiles crossing the eastside of the Lena Delta and sea ice. Least-squares regressions, R2 better than 0.97, of the changes relative to their time frames reveal phased temporal variation. The regression of the 11/18/2003 to
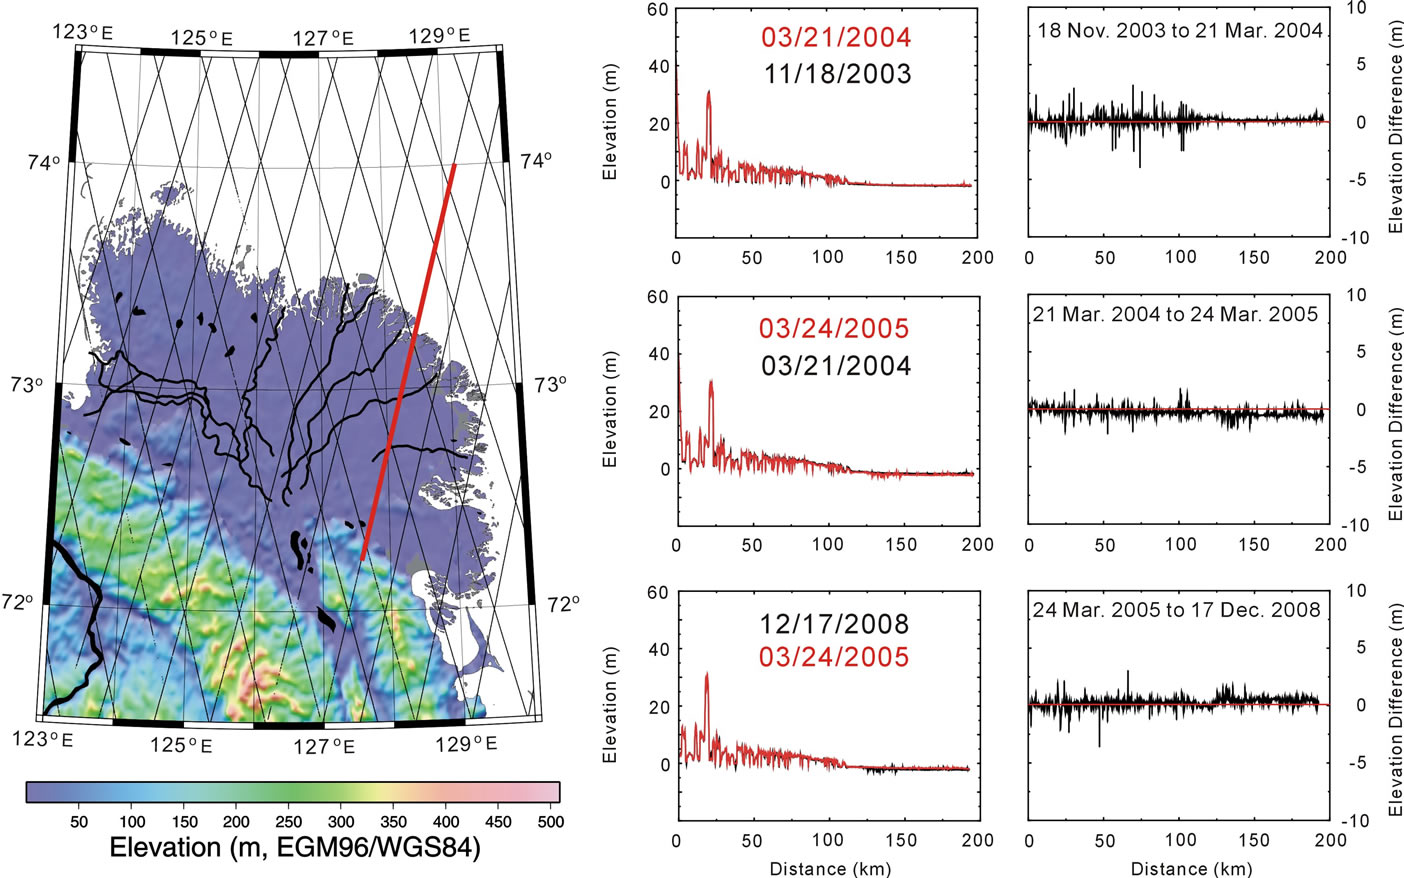
Figure 4. Three sets of repeat-location pairs of ICESat GLAS elevation profiles and differences (i.e. changes). The difference profiles show distinct temporal patterns of elevation changes relative to the zero-line (red) near the 200 km mark. Pattern of ICESat ground tracks shown for reference.
03/21/04 shows an increasing slope. The regression of the 03/21/04 to 03/24/05 shows a decreasing slope. The regression of the 03/24/05 to 12/17/08 shows an increasing slope. We checked the sea ice end-point (EP) and near-shore point of the elevation change profiles with the regressions and confirmed the temporal phase with high significance, Table 5. Checking portions of the elevation change profiles crossing the Sardakhskaya and Bykovskaya Channel ice covered at the crossing times, Tables 6 and 7, also confirms the temporal phase pattern. Lastly we checked elevation change profiles points on snowcovered land between the channels. Here the elevation differences are not phased and have a small mean difference of + 0.03 m with a standard error of 0.02 m, Table 8. Figure 5 shows a visual comparison of the ICESat GLAS profiles plotted on a co-located Landsat 7 mosaic from August 2000; the sun angle is too low for winter illumination thus negating visible image acquisition.
4. Discussion
In our results we presented ICESat GLAS-derived elevation changes at repeat-locations crossing the Lena Delta and sea ice of the Laptev Sea during winters from March 2003 to December 2008. The repeat-location profiles show a temporal phase in the elevation change regressions and specific point changes on sea ice and near coastal river ice. It is well known that coastal rivers possess tide-forced water level variations whose magnitude is dependent on channel and coastal shelf bathymetry morphology. To test this hypothesis we used datumcontrolled tide height measurements from Danai, Sannikova and Tiksi and composed tide height differences at the same time of month as the ICESat GLAS-derived elevation changes, Figure 6 and Table 9. Figure 6 shows the datum-corrected tide heights, blue dots, in monthly time series with a polynomial regression, thick black curve. The red-dots in the figure are the tide height differences (at ICESat GLAS time, Table 9) added to the series mean. This illustrates their magnitude relative to the polynomial regression. The phase of the datum-corrected tide height changes are in phase with the ICESat GLAS elevation change regressions (slopes) and sea ice and river ice crossing points, Tables 5 and 6. This confirms that ICESat GLAS repeat elevation profiles capture the phase of the tides of the Laptev Sea with high significance. Furthermore, we have confidence that the overall error of ICESat GLAS elevation data is near 0.03 ± 0.02 m (Table 8) with high significance. This small error range indicates that ICESat GLAS is capable of detecting active-layer and permafrost changes associated with
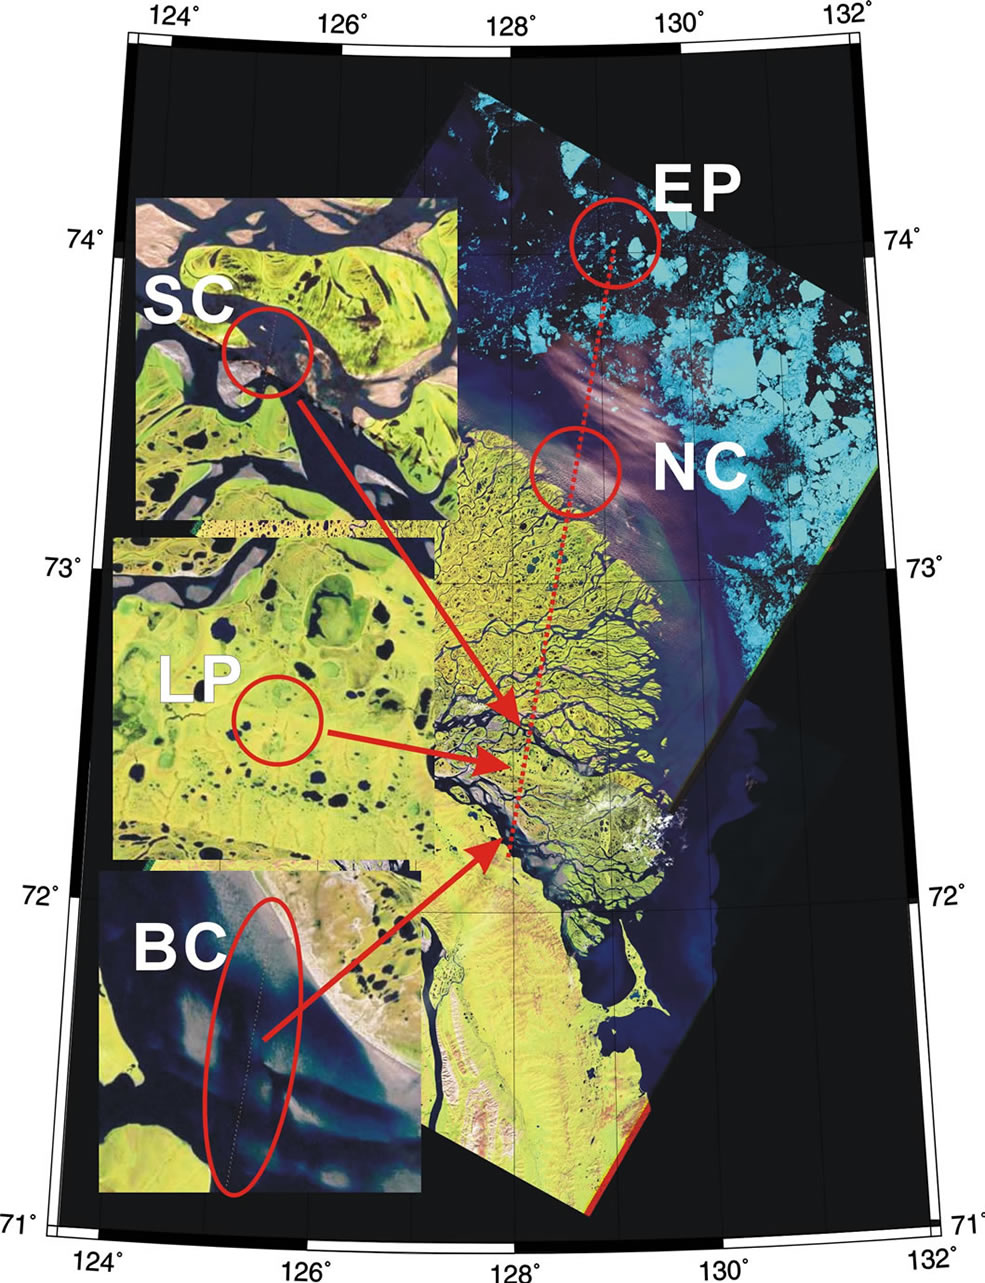
Figure 5. LANDSAT 7 mosaic August 2000 of the Lena Delta and repeat-location pairs ofICESat GLAS as in Figure 4 with close-ups: EP End Point, NC Near Coast, SC Sardakhskaya Channel, LP Land Point and BC Bykovskaya Channel.
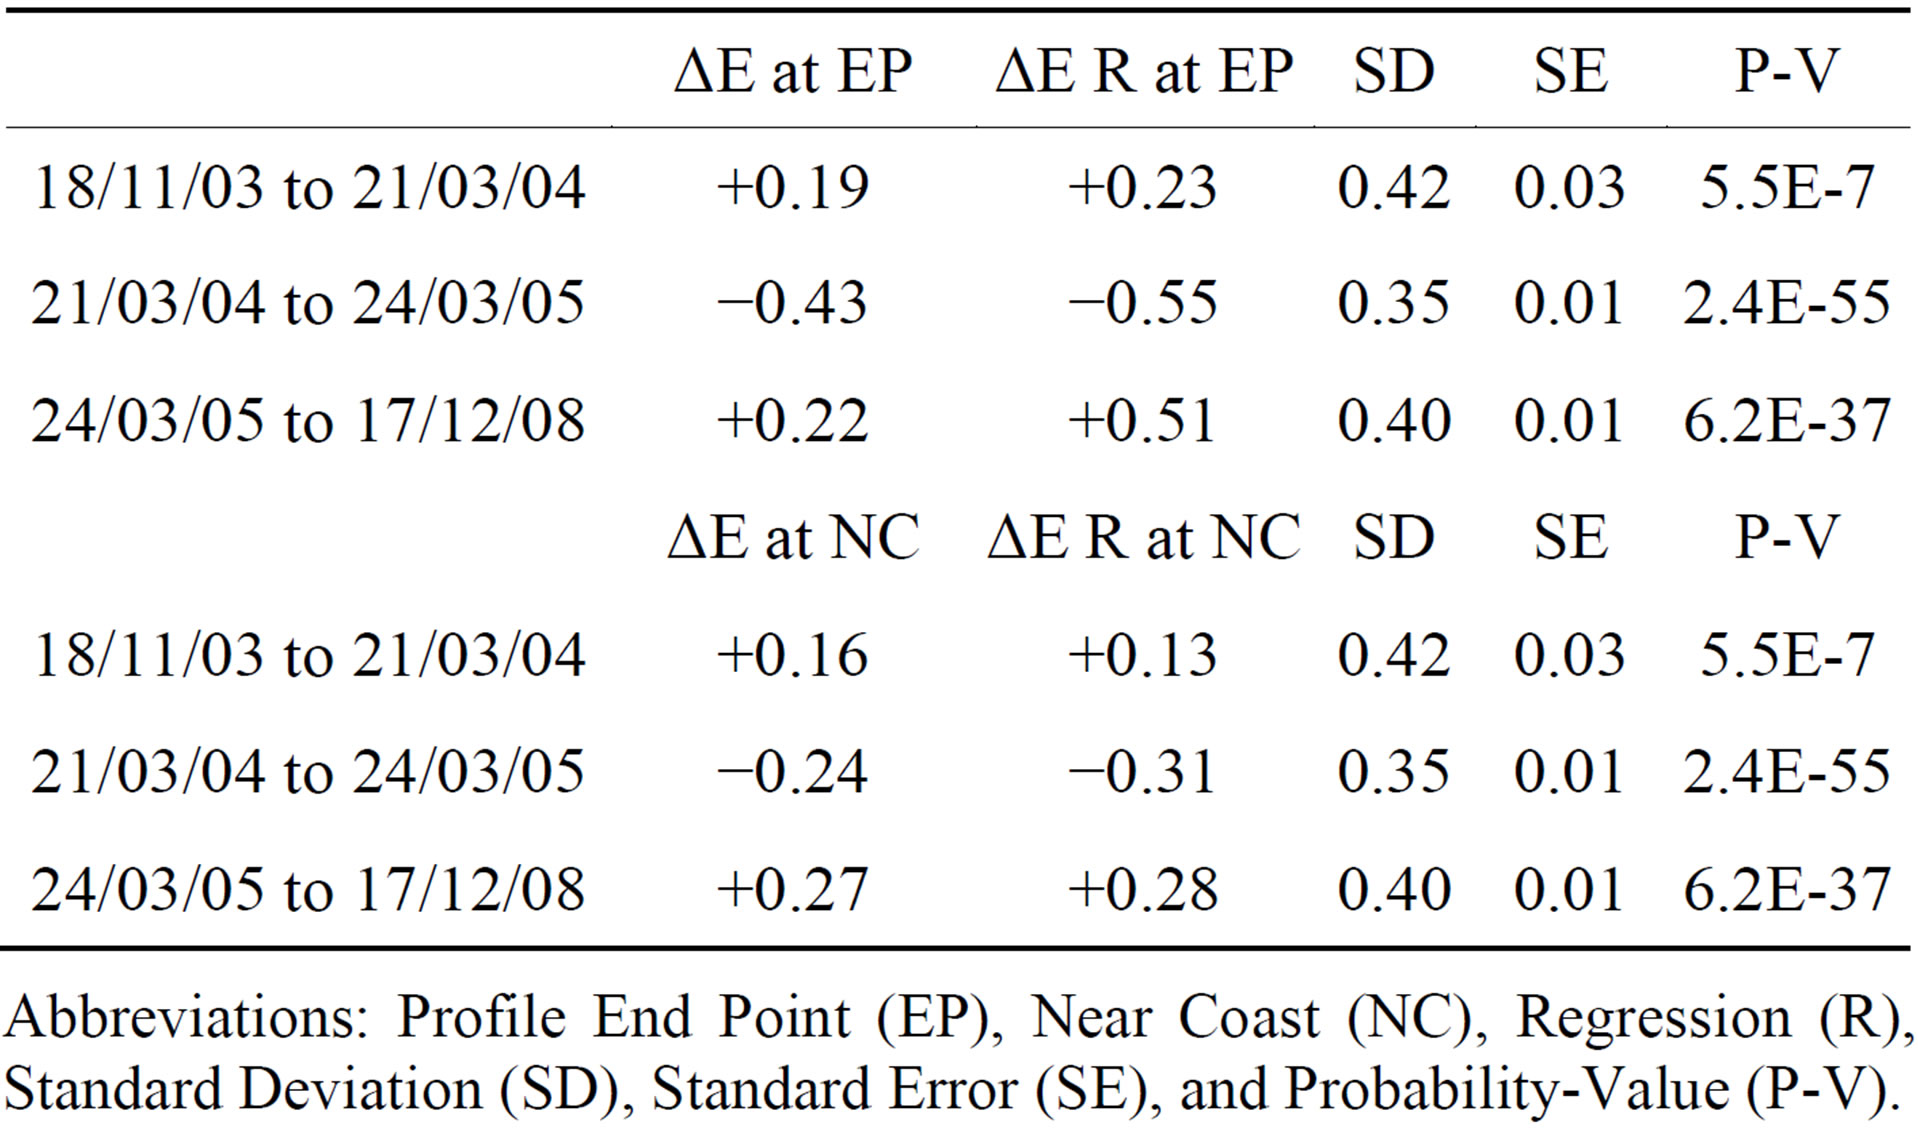
Table 5. Elevation changes (ΔE, m) at profile points on sea ice and regression statistics.
Abbreviations: Profile End Point (EP), Near Coast (NC), Regression (R), Standard Deviation (SD), Standard Error (SE), and Probability-Value (P-V).
freezing (heave) and thawing (subsidence) in excess of the ICESat GLAS error range using repeat-location profiles.
ICESat-2 the second generation NASA space-based laser altimeter mission is scheduled for launch July 2016. It’s improved laser altimeter systems and algorithms are in development using experimental test-flight data acquired by the Multiple Altimeter Beam Experimental LIDAR flown by the NASA Proteus aircraft with the
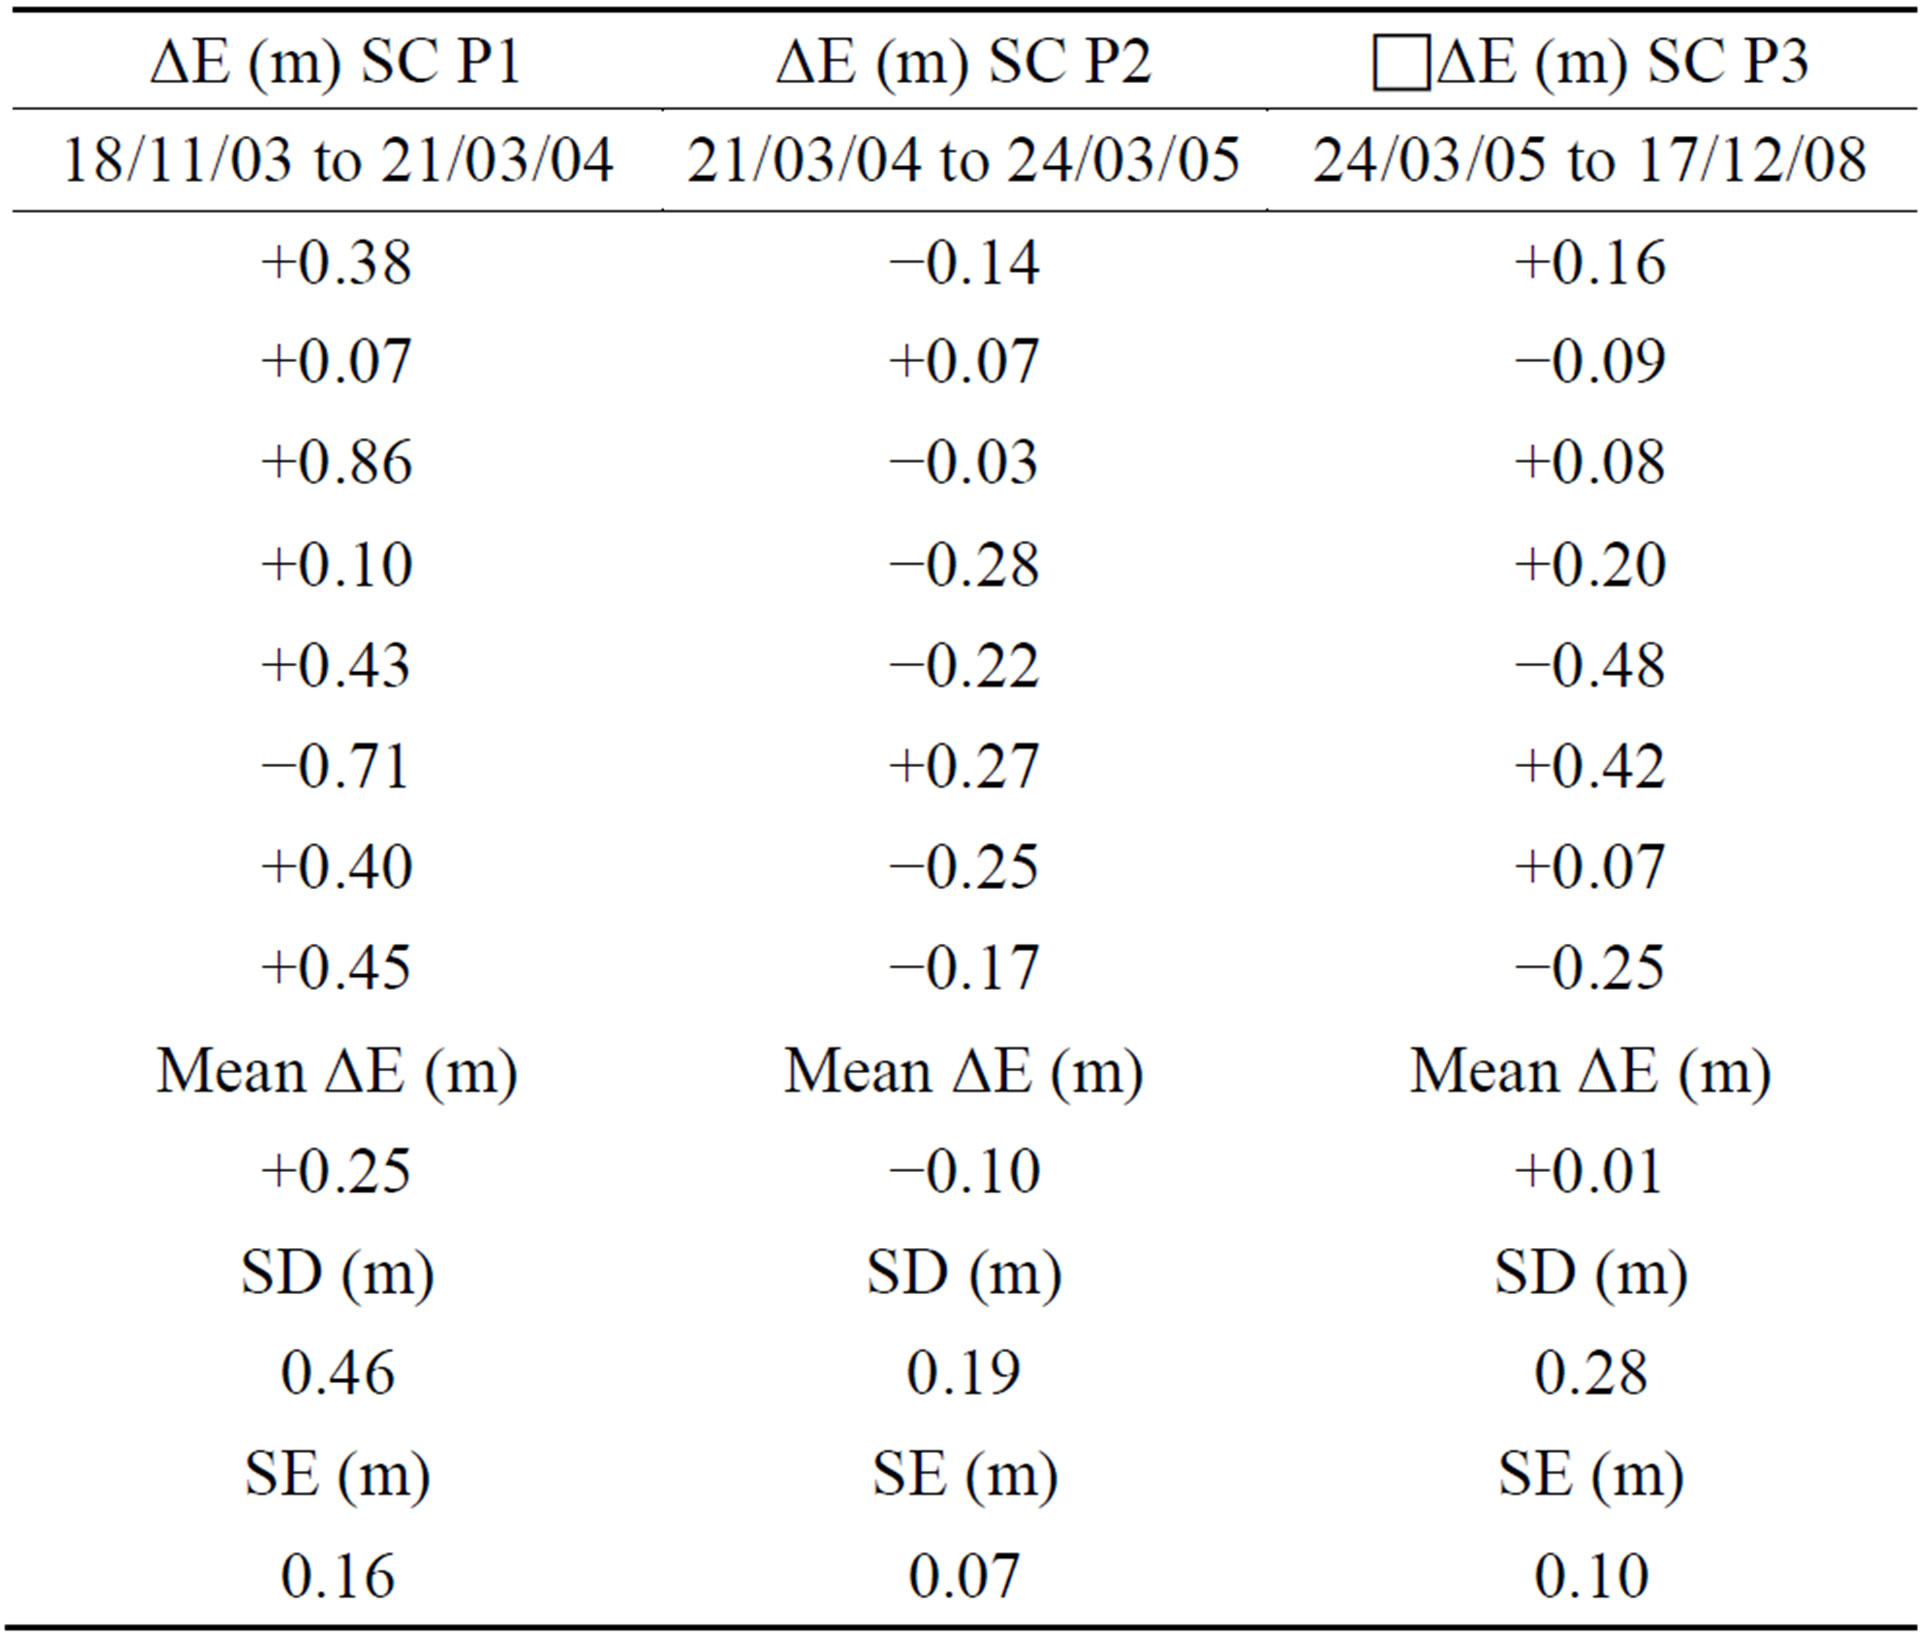
Table 6. Profile elevation changes (ΔE) across sardakhskova channel (SC) aproximately 40 km inland from mouth on the Buor-Khaya Gulf.
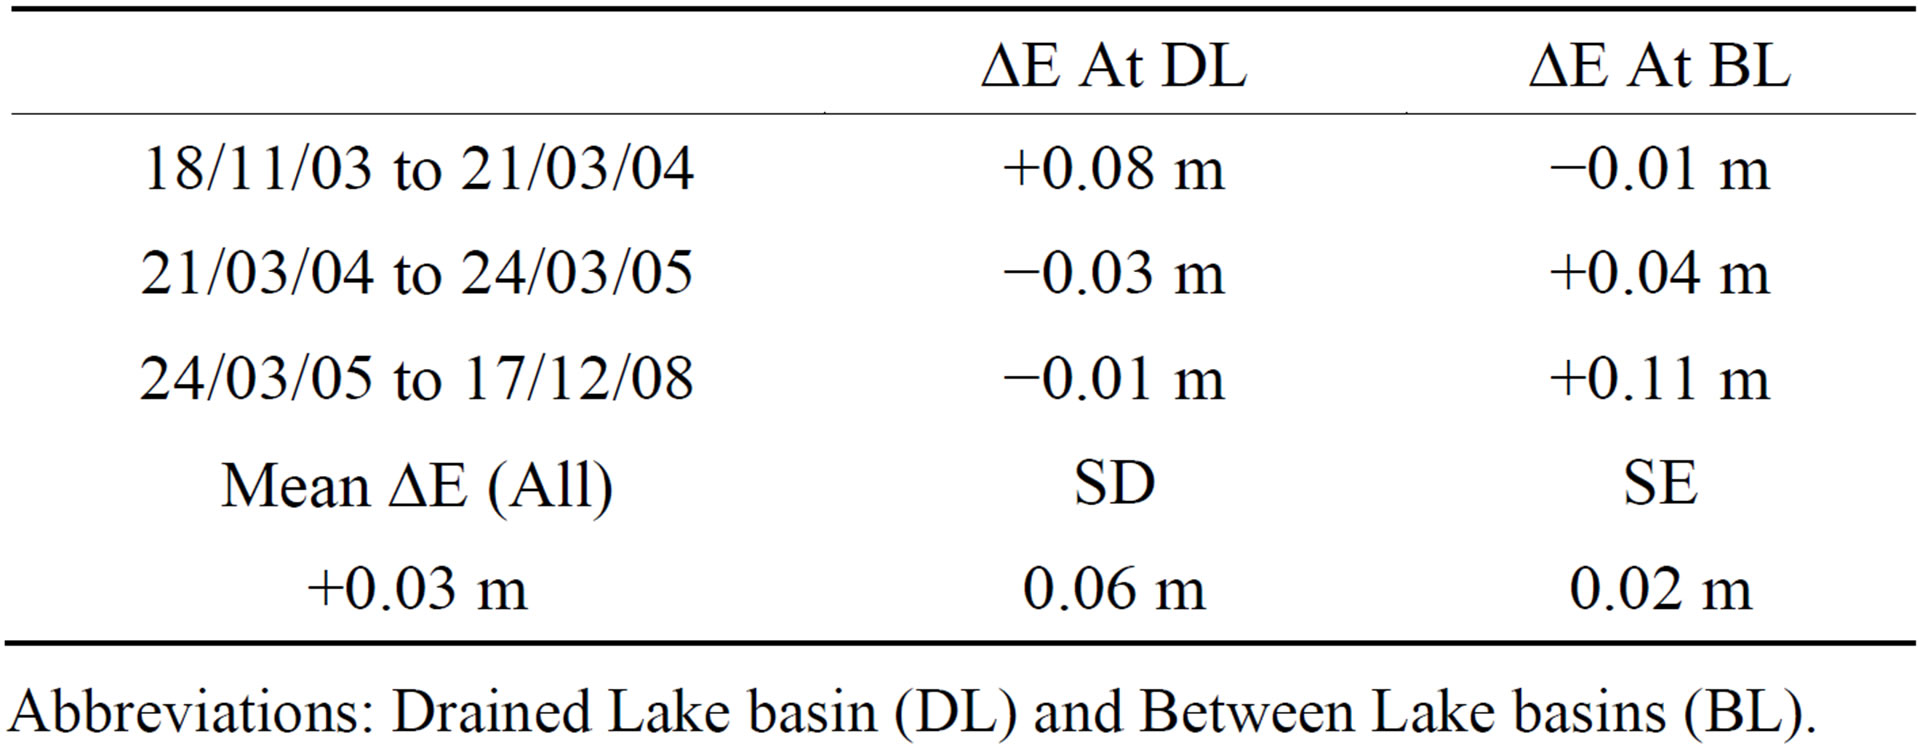
Table 7. Elevation changes (ΔE) on land points between Sardakhskaya and Bykovskaya channel.
Abbreviations: Drained Lake basin (DL) and Between Lake basins (BL).
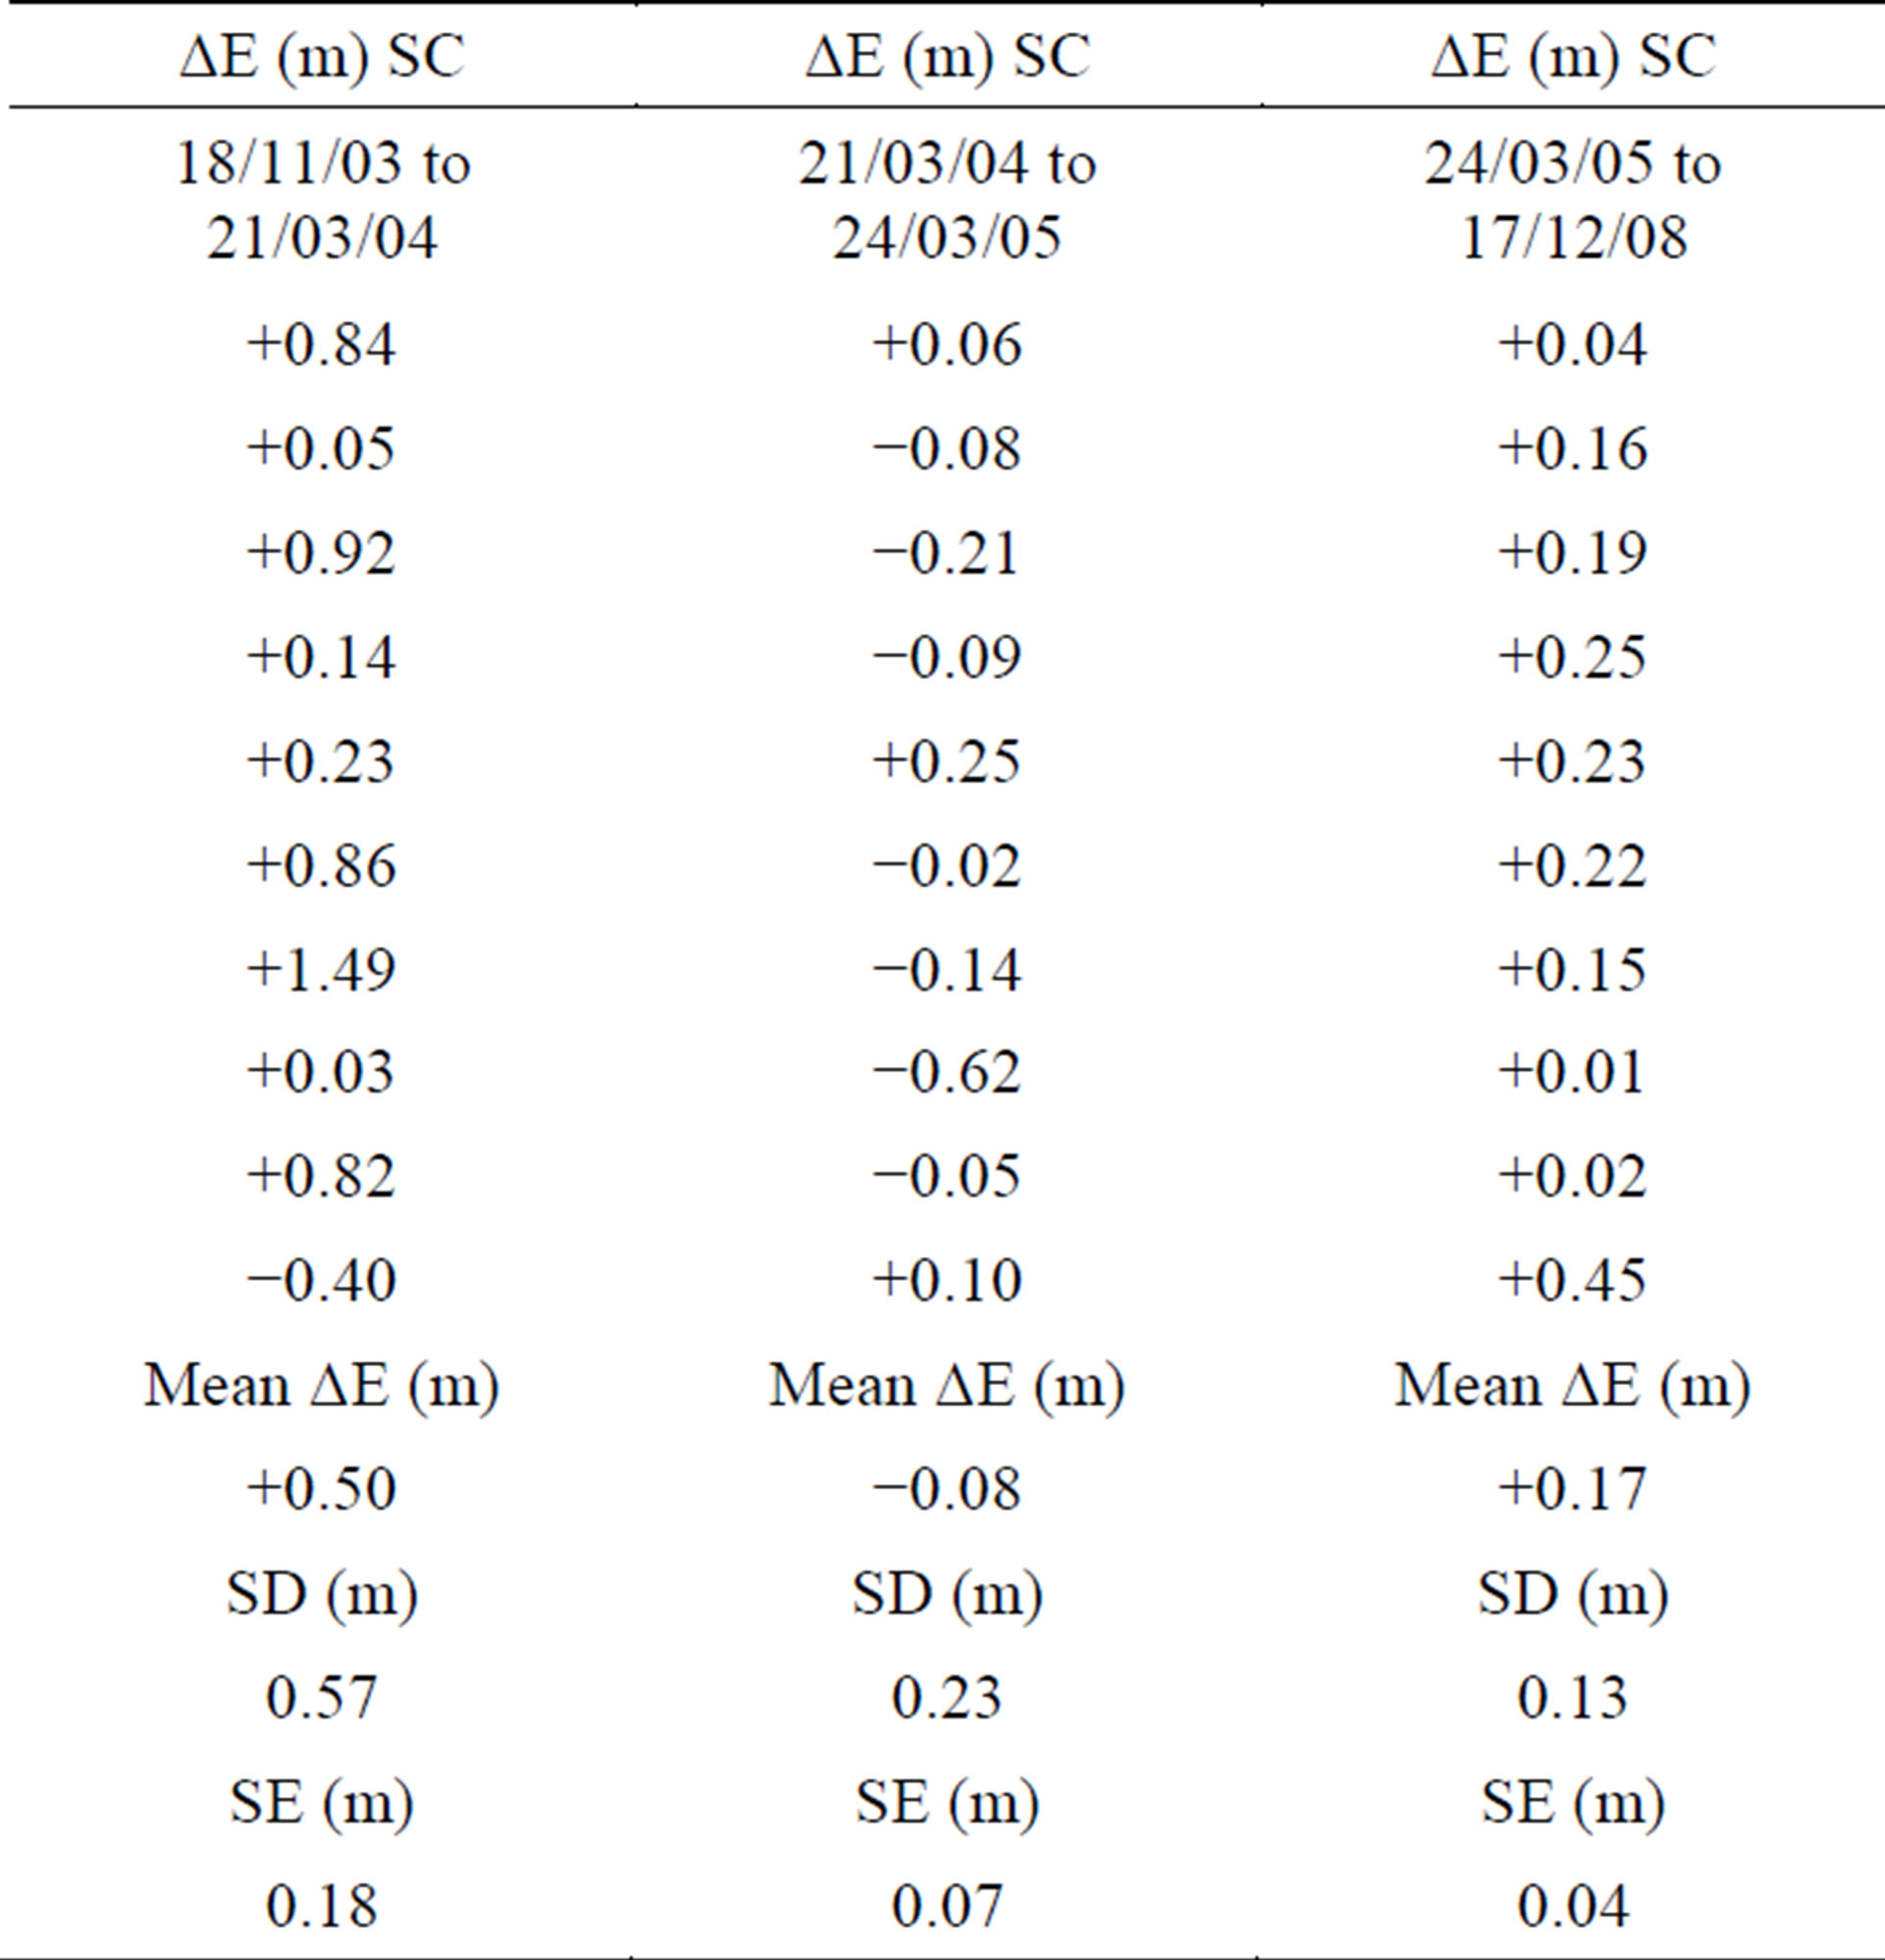
Table 8. Profile elevation changes ((ΔE) across Bykovskaya Channel (BC) aproximately 48 km inland from mouth on the Buor-Khaya Gulf.
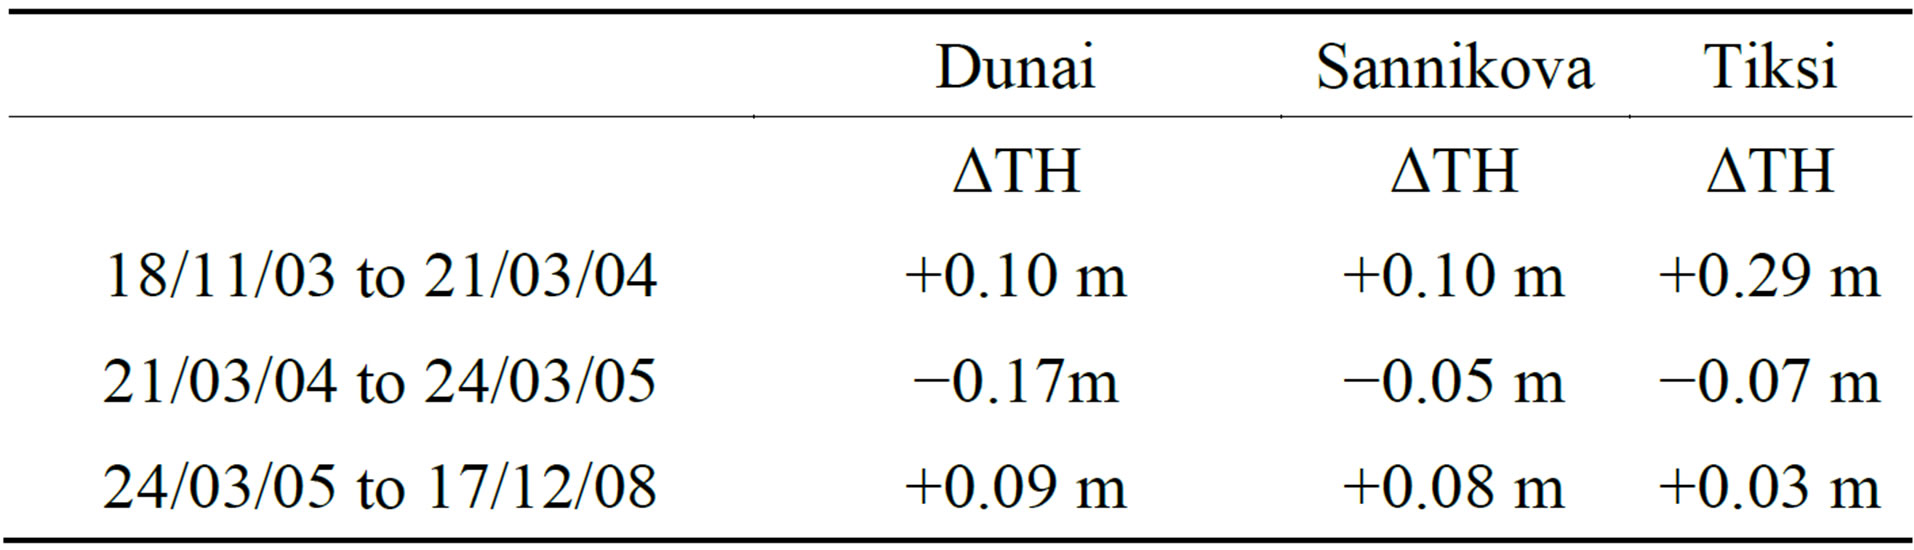
Table 9. Datum corrected tide height change (ΔTH) relative to ICESat overpass dates.
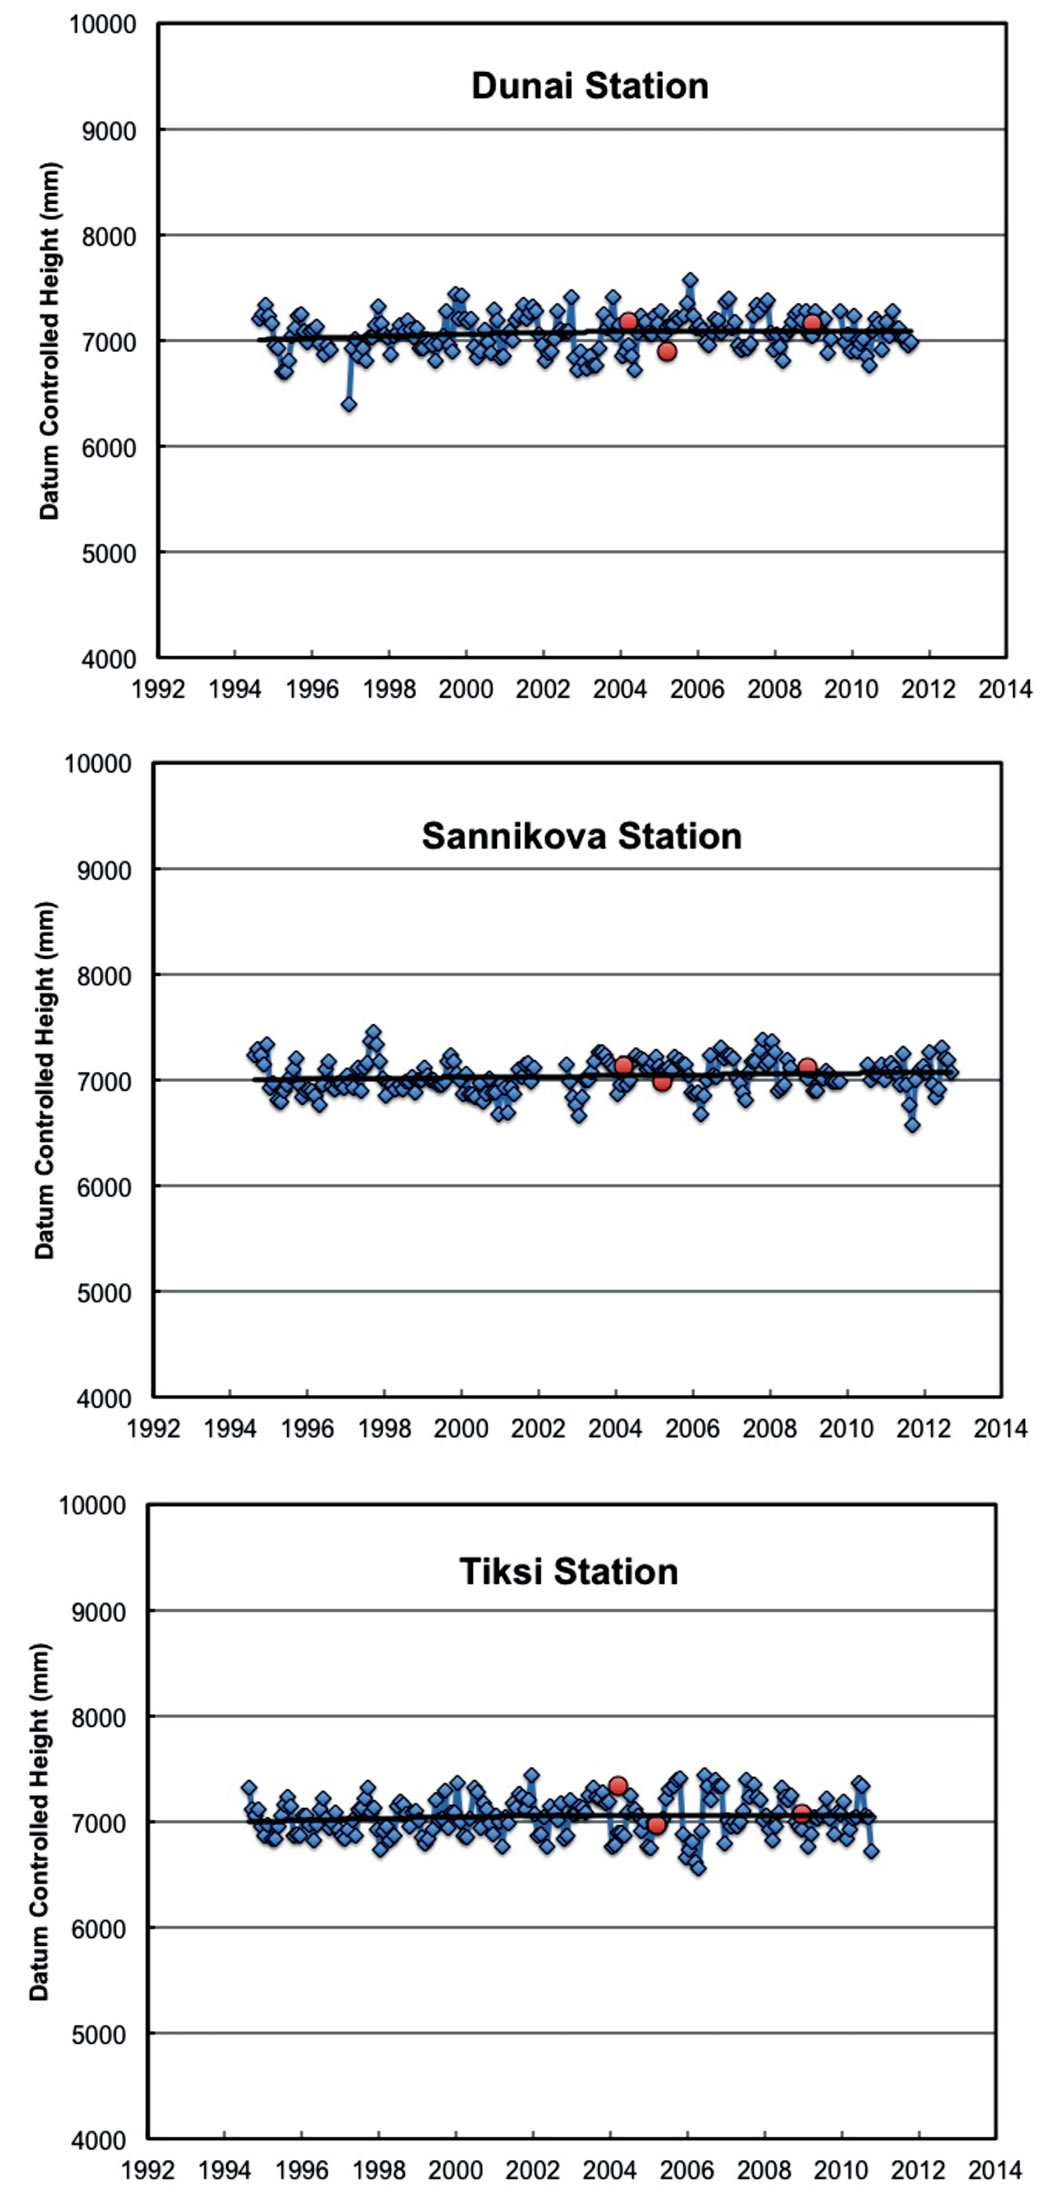
Figure 6. PSMSL datum-corrected tide height measurements monthly time series from the Russian stations Danai, Sannikova and Tiksi. Blue dots are tide heights, red dots are height differences (series mean added) at the time of ICESat GLAS and the thick black curve is a polynomial regression for reference.
expertise and science learned during the ICESat mission5. The new mission will give added emphasis toward measuring inland water levels.
5. Conclusion
We investigate elevation changes across the Lena Delta and coastal sea ice of the Laptev Sea using space-based geodetic measurements in comparison to datum-corrected tide stations. ICESat GLAS-derived elevation changes using repeat-location profiles crossing sea ice and inland channels from March 2003 through December 2008 show elevation changes in phase with tide-height changes. On tundra-permafrost terrain between the Sardakhskaya and Bykovskaya Channel elevation mean change is +0.03 ± 0.02 m with high significance in accordance with ICESat GLAS error knowledge. Our results indicate ICESat GLAS is capable of detection of tide fluxes of ice covered coastal rivers. With a small error range ICESat GLAS is suitable for investigations of active-layer and permafrost dynamics associated with seasonal freezing (heave) and thawing (subsidence) in excess of the error range using repeat-location profiles.
Acknowledgements
Vladimir E. Romanovsky, Geophysical Institute University of Alaska Fairbanks (GI UAF) supported this research through grants from the National Science Foundation awards #0856864 and AON Development of Sustainable Observation of Thermal State of Permafrost in North America and Russia: The US Contribution to the Global Terrestrial Network for Permafrost. Alexander Kholodov (GI UAF) is thanked for valuable discussions regarding the Lena Delta. We thank the National Snow and Ice Data Center, University of Colorado for providing the ICESat GLAS datasets. We thank the NASA Landsat Program, USGS EROS Data Center Sioux Falls, South Dakota for the use of LANDSAT 7 ETM+ datasets. We thank the Permanent Service for Mean Sea Level, www.psmsl.org, for providing Russian tide-gauge station data. We thank the De Montfort University, UK, Earth And Planetary Remote Sensing Laboratory for the ACE2 DEM datasets. We thank the Arctic Region Super Computing Center, University of Alaska Fairbanks for providing computing facilities support. The Generic Mapping Tools (http://gmt.soest.hawaii.edu, P. Wessel and W. H. F. Smith) and ENVI/IDL, ITT Exelis, were used in this research.
REFERENCES
- R. R. Muskett and V. E. Romanovsky, “Energy and Mass Changes of the Eurasian Permafrost Regions by MultiSatellite and In-Situ Measurements,” Natural Science, Vol. 3, No. 10, 2011, pp. 827-836. http://dx.doi.org/10.4236/ns.2011.310108
- F. Are and E. Reimnitz, “An Overview of the Lena River Delta Setting: Geology, Tectonic, Geomorphology and Hydrology,” Journal of Coastal Research, Vol. 16, No. 4, 2000, pp. 1083-1093.
- S. Wetterich, S. Kuzmina, A. A. Andreev, F. Kienast, H. Meyer, L. Schirrmeister, T. Kuznetsova and M. Sierralta, “Palaeoenvironmental Dynamics Inferred from Late Quaternary Permafrost Deposits on Kurungnakh Island, Lena Delta, Northeast Siberia, Russia,” Quaternary Science Reviews, Vol. 27, No. 15-16, 2008, pp. 1523-1540. http://dx.doi.org/10.1016/j.quascirev.2008.04.007
- L. Kutzbach, D. Wagner and E. M. Pfeiffer, “Effect of Microrelief and Vegetation on Methane Emission from Wet Polygonal Tundra, Lena Delta, Northern Siberia,” Biogeochemistry, Vol. 69, No. 3, 2004, pp. 341-362. http://dx.doi.org/10.1023/B:BIOG.0000031053.81520.db
- J. Schneider, G. Grosse and D. Wagner, “Land Cover Classification of Tundra Environments in the Arctic Lena Delta Based on Landsat 7 ETM+ Data and Its Application for Upscaling of Methane Emissions,” Remote Sensing of Environment, Vol. 113, No. 2, 2009, pp. 380-391. http://dx.doi.org/10.1016/j.rse.2008.10.013
- R. R. Muskett and V. E. Romanovsky, “Groundwater Storage Changes in Arctic Permafrost Watersheds from GRACE and in Situ Measurements,” Environmental Research Letters, Vol. 4, No. 4, 2009, 8 p. http://dx.doi.org/10.1088/1748-9326/4/4/045009
- V. E. Romanovsky, S. S. Smith and H. H. Christiansen, “Permafrost Thermal State in the Polar Northern Hemisphere during the International Polar Year 2007-2009: A Synthesis,” Permafrost and Periglacial Process, Vol. 21, No. 2, 2010, pp. 106-116. http://dx.doi.org/10.1002/ppp.689
- R. R. Muskett and V. E. Romanovsky, “Alaskan Permafrost Groundwater Storage Changes Derived from GRACE and Ground Measurements,” Remote Sensing, Vol. 3, No. 2, 2011, pp. 378-397. http://dx.doi.org/10.3390/rs3020378
- A. N. Charkin, O. V. Dudarev, I. P. Semiletov, A. V. Kruhmalev, J. E. Vonk, L. Sánchez-García, E. Karlsson and Ö. Gustafsson, “Seasonal and Interannual Variability of Sedimentation and Organic Matter Distribution in the Buor-Khaya Gulf: The Primary Recipient of Input from Lena River and Coastal Erosion in the Southeast Laptev Sea,” Biogeosciences, Vol. 8, No. 1, 2011, pp. 2581-2594. http://dx.doi.org/10.5194/bg-8-2581-2011
- P. P. Overduin, S. Westermann, K. Yoshikawa, T. Haberlau, V. Romanovsky and S. Wetterich, “Geoelectric Observations of the Degradation of Nearshore Submarine Permafrost at Barrow (Alaskan Beaufort Sea),” Journal of Geophysical Research, Vol. 117, No. F2, 2012, Article ID: F02004. http://dx.doi.org/10.1029/2011JF002088
- I. Bussmann, “Distribution of Methane in the Lena Delta and Buor-Khaya Bay, Russia,” Biogeosciences, Vol. 10, No. 7, 2013, pp. 4641-4652. http://dx.doi.org/10.5194/bg-10-4641-2013
- H. Lantuit, P. P. Overduin and S. Wetterich, “Recent Progress Regarding Permafrost Coasts,” Permafrost Periglacial Processes, Vol. 24, No. 2, 2013, pp. 120-130. http://dx.doi.org/10.5194/bg-10-4641-2013
- E. A. G. Schuur, B. W. Abbott, W. B. Bowden, V. Brovkin, P. Camill, J. G. Canadell, J. P. Chanton, F. S. Chapin III, T. R. Christensen, P. Ciais, B. T. Crosby, C. I. Czimczik, G. Grosse, J. Harden, D. J. Hayes, G. Hugelius, J. D. Jastrow, J. B. Jones, T. Kleinen, C. D. Koven, G. Krinner, P. Kuhry, D. M. Lawrence, A. D. McGuire, S. M. Natali, J. A. O’Donnell, C. L. Ping, W. J. Riley, A. Rinke, V. E. Romanovsky, A. B. K. Sannel, C. Schädel, K. Schaefer, J. Sky, Z. M. Subin, C. Tarnocai, M. R. Turetsky, M. P. Waldrop, K. M. Walter Anthony, K. P. Wickland, C. J. Wilson and S. A. Zimov, “Expert Assessment of Vulnerability of Permafrost Carbon to Climate Change,” Climatic Change, Vol. 119, No. 2, 2013, pp. 359-374. http://dx.doi.org/10.1007/s10584-013-0730-7
- H. J. Zwally, B. Schutz, W. Abdalati, J. Abshire, C. Bentley, A. Brenner, J. Bufton, J. Dezio, D. Hancock, D. Harding, T. Herring, B. Minster, K. Quinn, S. Palm, J. Spinhirne and R. Thomas, “ICESat’s Laser Measurements of Polar Ice, Atmosphere, Ocean, and Land,” Journal of Geodynamics, Vol. 34, No. 3-4, 2002, pp. 405-445. http://dx.doi.org/10.1016/S0264-3707(02)00042-X
- R. Kwok and J. Morrison, “Dynamic Topography of the Ice-Covered Arctic Ocean from ICESat,” Geophysical Research Letters, Vol. 38, No. 2, 2011, Article ID: L02501. http://dx.doi.org/10.1029/2010GL046063
- T. J. Urban, B. E. Schutz and A. L. Neuenschwander, “A Survey of ICESat Coastal Altimetry Application: Continental Coast, Open Ocean Island and Inland River,” Terrestrial Atmospheric and Oceanic Sciences, Vol. 19, No. 1-2, pp. 1-19, 2008. http://dx.doi.org/10.3319/TAO.2008.19.1-2.1(SA)
- L. Padman and H. A. Fricker, “Tides on the Ross Ice Shelf Observed with ICESat,” Geophysical Research Letters, Vol. 32, No. 14, 2005, Article ID: L14503. http://dx.doi.org/10.1029/2005GL023214
- B. E. Schutz, H. J. Zwally, C. A. Schuman, D. Hancock and P. J. DiMarzio, “Overview of the ICESat Mission,” Geophysical Research Letters, Vol. 32, No. 14, 2005, Article ID: L21S01. http://dx.doi.org/10.1029/2005GL024009
- D. K. Atwood, R. M. Guritz, R. R. Muskett, C. S. Lingle, J. M. Sauber and J. T. Freymueller, “DEM Control in Arctic Alaska with ICESat Laser Altimetry,” IEEE Transactions Geoscience and Remote Sensing, Vol. 45, No. 11, 2007, pp. 3710-3720. http://dx.doi.org/10.1109/TGRS.2007.904335
- R. R. Muskett, C. S. Lingle, J. M. Sauber, B. T. Rabus and W. V. Tangborn, “Acceleration of Surface Lowering on the Tidewater Glaciers of Icy Bay, Alaska, USA, from InSAR DEMs and ICESat Altimetry,” Earth and Planetary Science Letters, Vol. 265, No. 3-4, 2008, pp. 345- 359. http://dx.doi.org/10.1016/j.epsl.2007.10.012
- R. R. Muskett, C. S. Lingle, J. M. Sauber, A. S. Post, W. V. Tangborn and B. T. Rabus, “Surging, Accelerating Surface Lowering and Volume Reduction of the Malaspina Glacier System, Alaska, USA, and Yukon, Canada, from 1972 to 2006,” Journal of Glaciology, Vol. 54, No. 188, 2008, pp. 788-800. http://dx.doi.org/10.3189/002214308787779915
- R. R. Muskett, C. S. Lingle, J. M. Sauber, A. S. Post, W. V. Tangborn, B. T. Rabus, and K. A. Echelmeyer, “Airborne-Spaceborne DEMand Laser Altimetry-Derived Surface Elevation and Volume Changes of the Bering Glacier System, 1972 through 2006,” Journal of Glaciology, Vol. 55, No. 190, 2009, pp. 316-326. http://dx.doi.org/10.3189/002214309788608750
- S. J. Holgate, A. Matthews, P. L. Woodworth, L. J. Rickards, M. E. Tamisiea, E. Bradshaw, P. R. Foden, K. M. Gordon, S. Jevrejeva and J. Pugh, “New Data Systems and Products at the Permanent Service for Mean Sea Level,” Journal of Coastal Research, Vol. 29, No. 3, 2013, pp. 493-504. http://dx.doi.org/10.2112/JCOASTRES-D-12-00175.1
NOTES
*Corresponding author.
1http://en.wikipedia.org/wiki/Lena_River
2http://en.wikipedia.org/wiki/Icesat
3http://nsidc.org/data/icesat/past_releases.html and http://nsidc.org/data/docs/daac/glas_icesat_l1_l2_global_altimetry.gd.html
4http://www.psmsl.org/data/obtaining/stations/640.php
5http://icesat.gsfc.nasa.gov/icesat2/