Open Journal of Modern Hydrology
Vol.3 No.4(2013), Article ID:37535,7 pages DOI:10.4236/ojmh.2013.34020
Statistical Change Detection in Water Cycle over Two Decades and Assessment of Impact of Urbanization on Surface and Sub-Surface Water Flows
![]()
Department of Architecture & Planning, Maulana Azad National Institute of Technology (MANIT), Bhopal, India.
Email: sheetalsharmaplanner@gmail.com, vinaymdas@yahoo.com, alka_bharat@yahoo.com
Copyright © 2013 Sheetal Sharma et al. This is an open access article distributed under the Creative Commons Attribution License, which permits unrestricted use, distribution, and reproduction in any medium, provided the original work is properly cited.
Received January 22nd, 2013; revised February 22nd, 2013; accepted March 1st, 2013
Keywords: Urban; Impervious Layer; Runoff; Runoff Calculations; Recharge Calculations; Built-Up Areas
ABSTRACT
Urbanization is termed as physical transformation of landscapes that alter the natural regime of the environment of its surrounding resulting in further changes in macro as well as micro climate of the region [1]. Urban areas are continually facing problems of water scarcity and urban flash floods. Recent news from IPCC report 2010, CIESIN’s Global Rural Urban Mapping Project [2] and World Water Vol. 7 2007, it is clear that urban land area has doubled and affected the hydrological cycle. The components of hydrological cycle affected are Infiltration, Runoff and Evaporation and the causing components are derived by studies as land use, land cover, water withdrawal and urban developments. Thus water availability, water recharge and water cycle are all destabilized in course or urban development. The paper is an attempt to correlate and identify the periodical changes in urban water cycle, during urbanization of Bhopal City, India, during last twenty years and above. The observations are based on GIS mapping of the study area from 1991 to 2009 using rational method of runoff and recharge calculations and statistical analysis of related built-up areas. Also change in natural course of drainages with the help of GIS imageries which have been detected during twenty years that help to observe the adaptation of natural system to urban course. Also the observations show an interesting relation which can be used for further research and sustainable development [3].
1. Introduction
Urban planning has been left quite behind, by the speed of urbanization as it has steadily replaced open spaces and forced dramatic changes to watersheds in the process. Natural drainages have been replaced by human structures, or reengineered for human purposes. Human land use activities have imposed significant influences on watershed processes. The activities proposed or going on land surfaces do not favor the natural processes many times and hence hamper their working. Urban planners are facing limitations in coping up with these particular problems of decreasing water resources and shortage in natural recharging of ground water.
Several urban cities are facing water related problems in India and overseas [4].
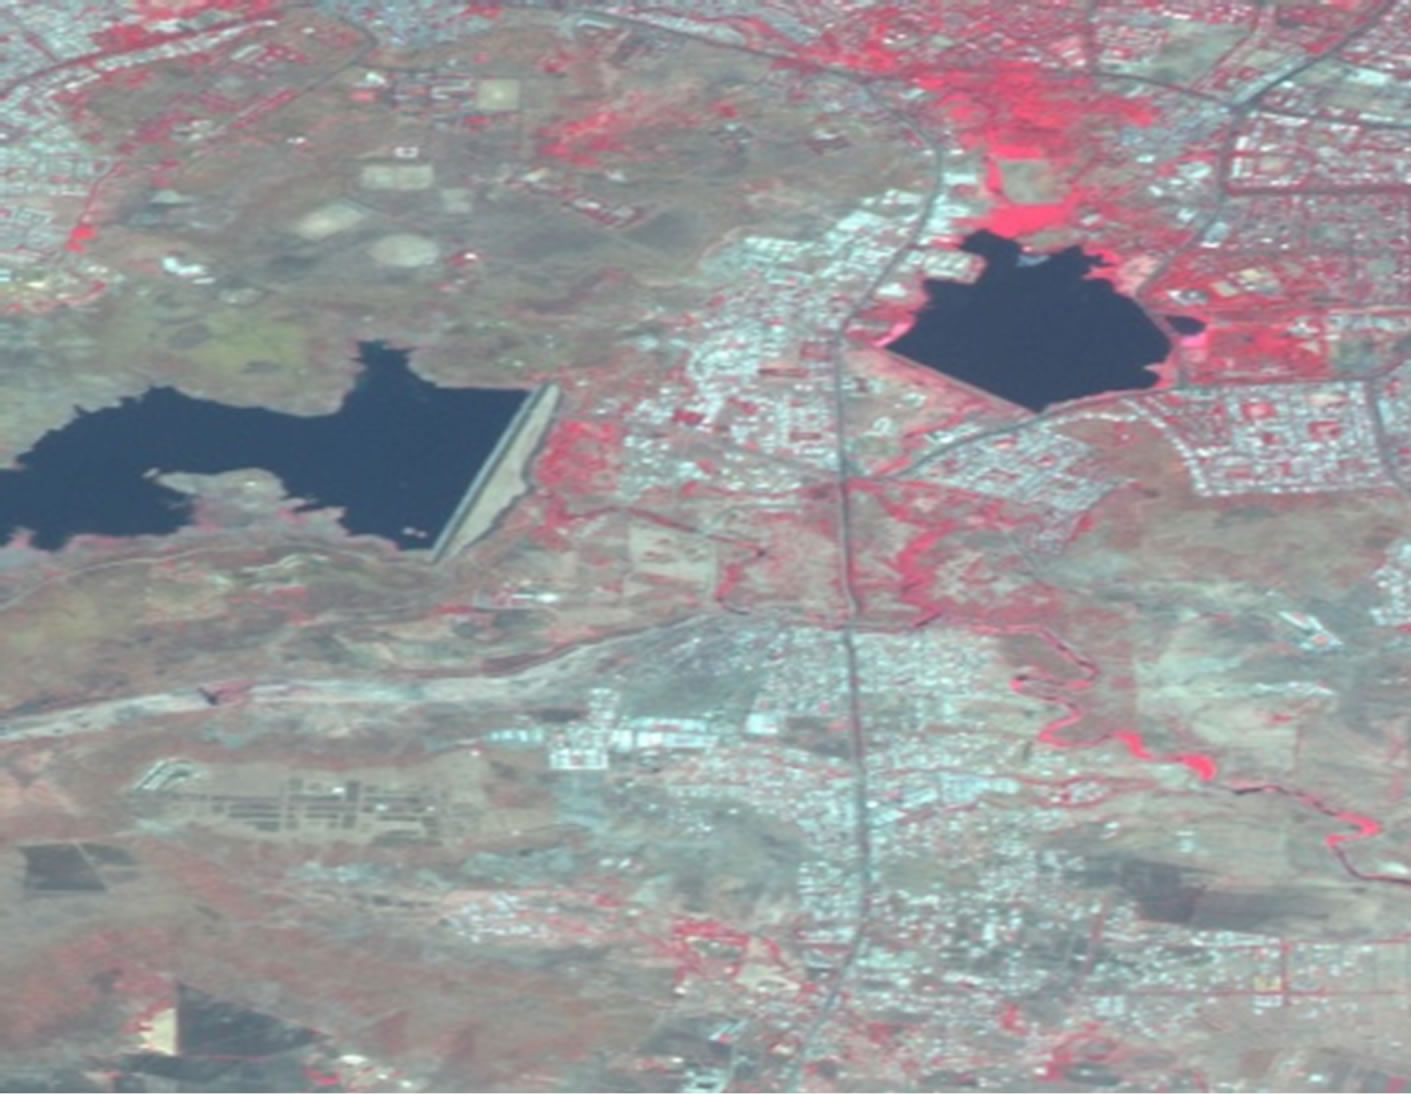
Bhopal (Figure 1), a rapidly growing city in India, is blessed with natural physiography along with more than six beautiful lakes and hence called as “city of lakes”. Still the unplanned growth and rapid urbanization has affected the water cycle here and the largest man made lake in Bhopal called Upper lake reduced to 9 sqkm in surface water spread from 36 sqkm in 2009.
Also the water level has gone rapidly below several meters in last decade producing an alarming situation for the city dwellers. But some Areas do still enjoy satisfactory water levels and some don’ts.
Hence a study was done to find the effects of urbanization on the water (Sub Surface and Surface) and a corealtion was developed for the said differences.
2. Study Area
The study area (Figure 2) comprises of urbanized area of Zone 6 and part of developing area of Kolar Nagar Palika, along with natural boundaries around, Phanda block, Bhopal, India. The study area covers a natural drainage of Kaliasot River along with Kaliasot Dam, Bhadbhada area (soil way of Upper Lake), Southern Por-
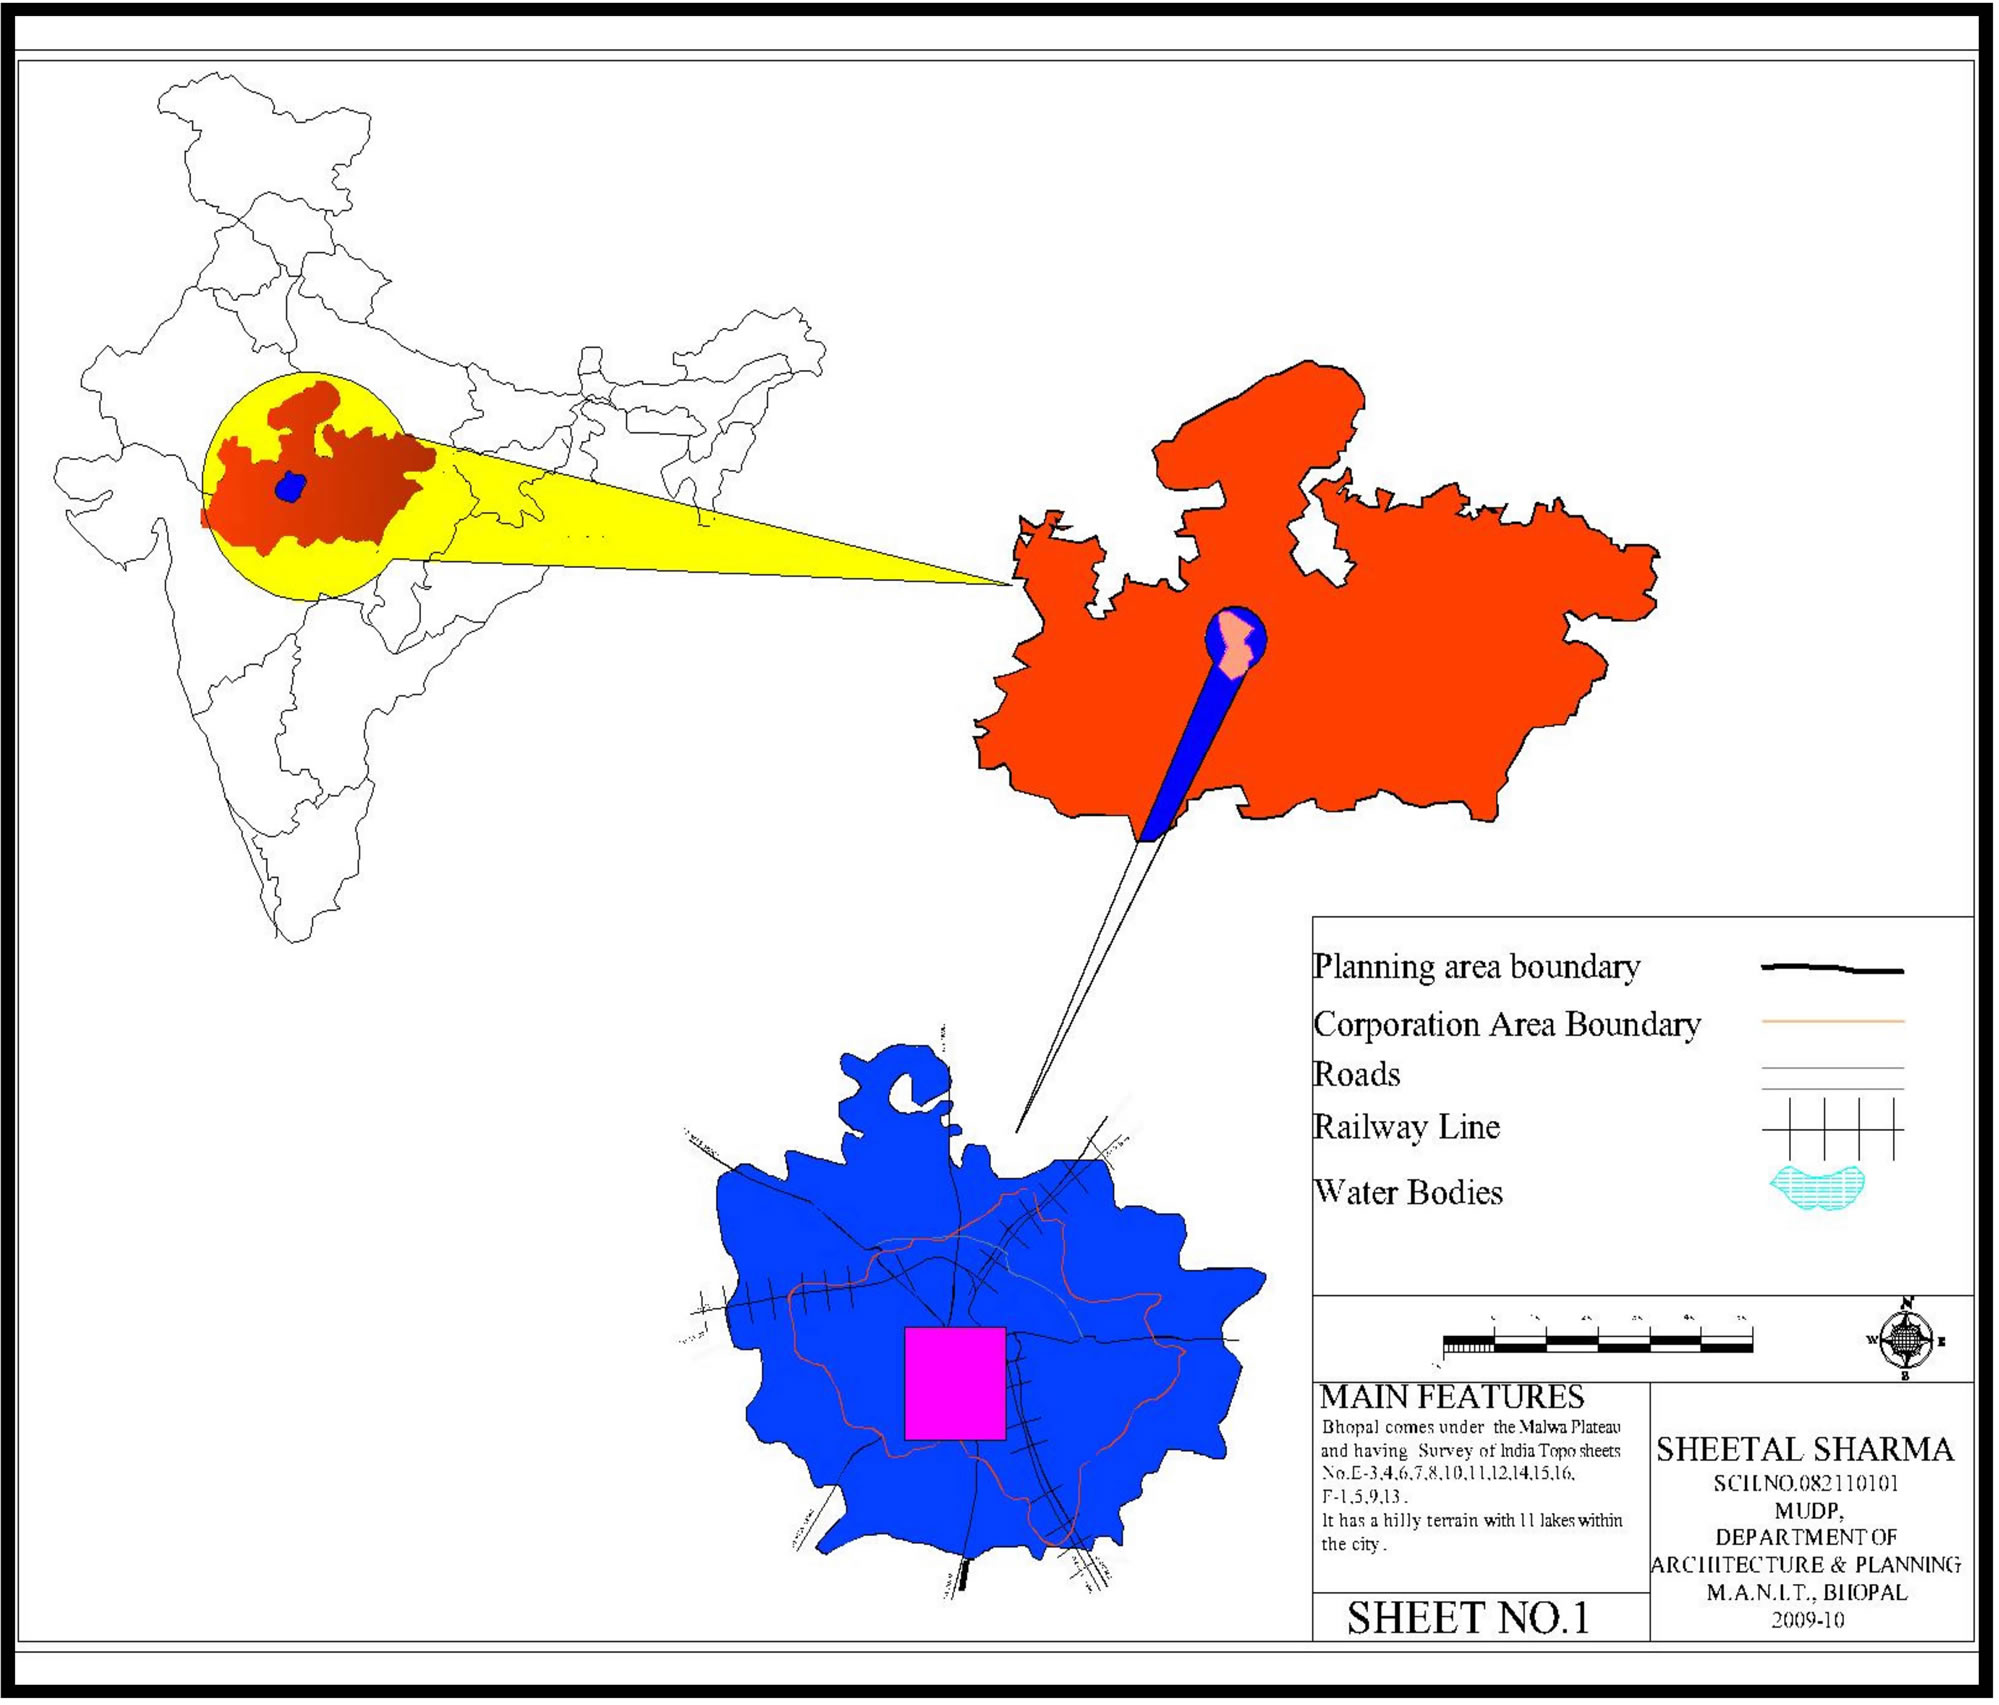
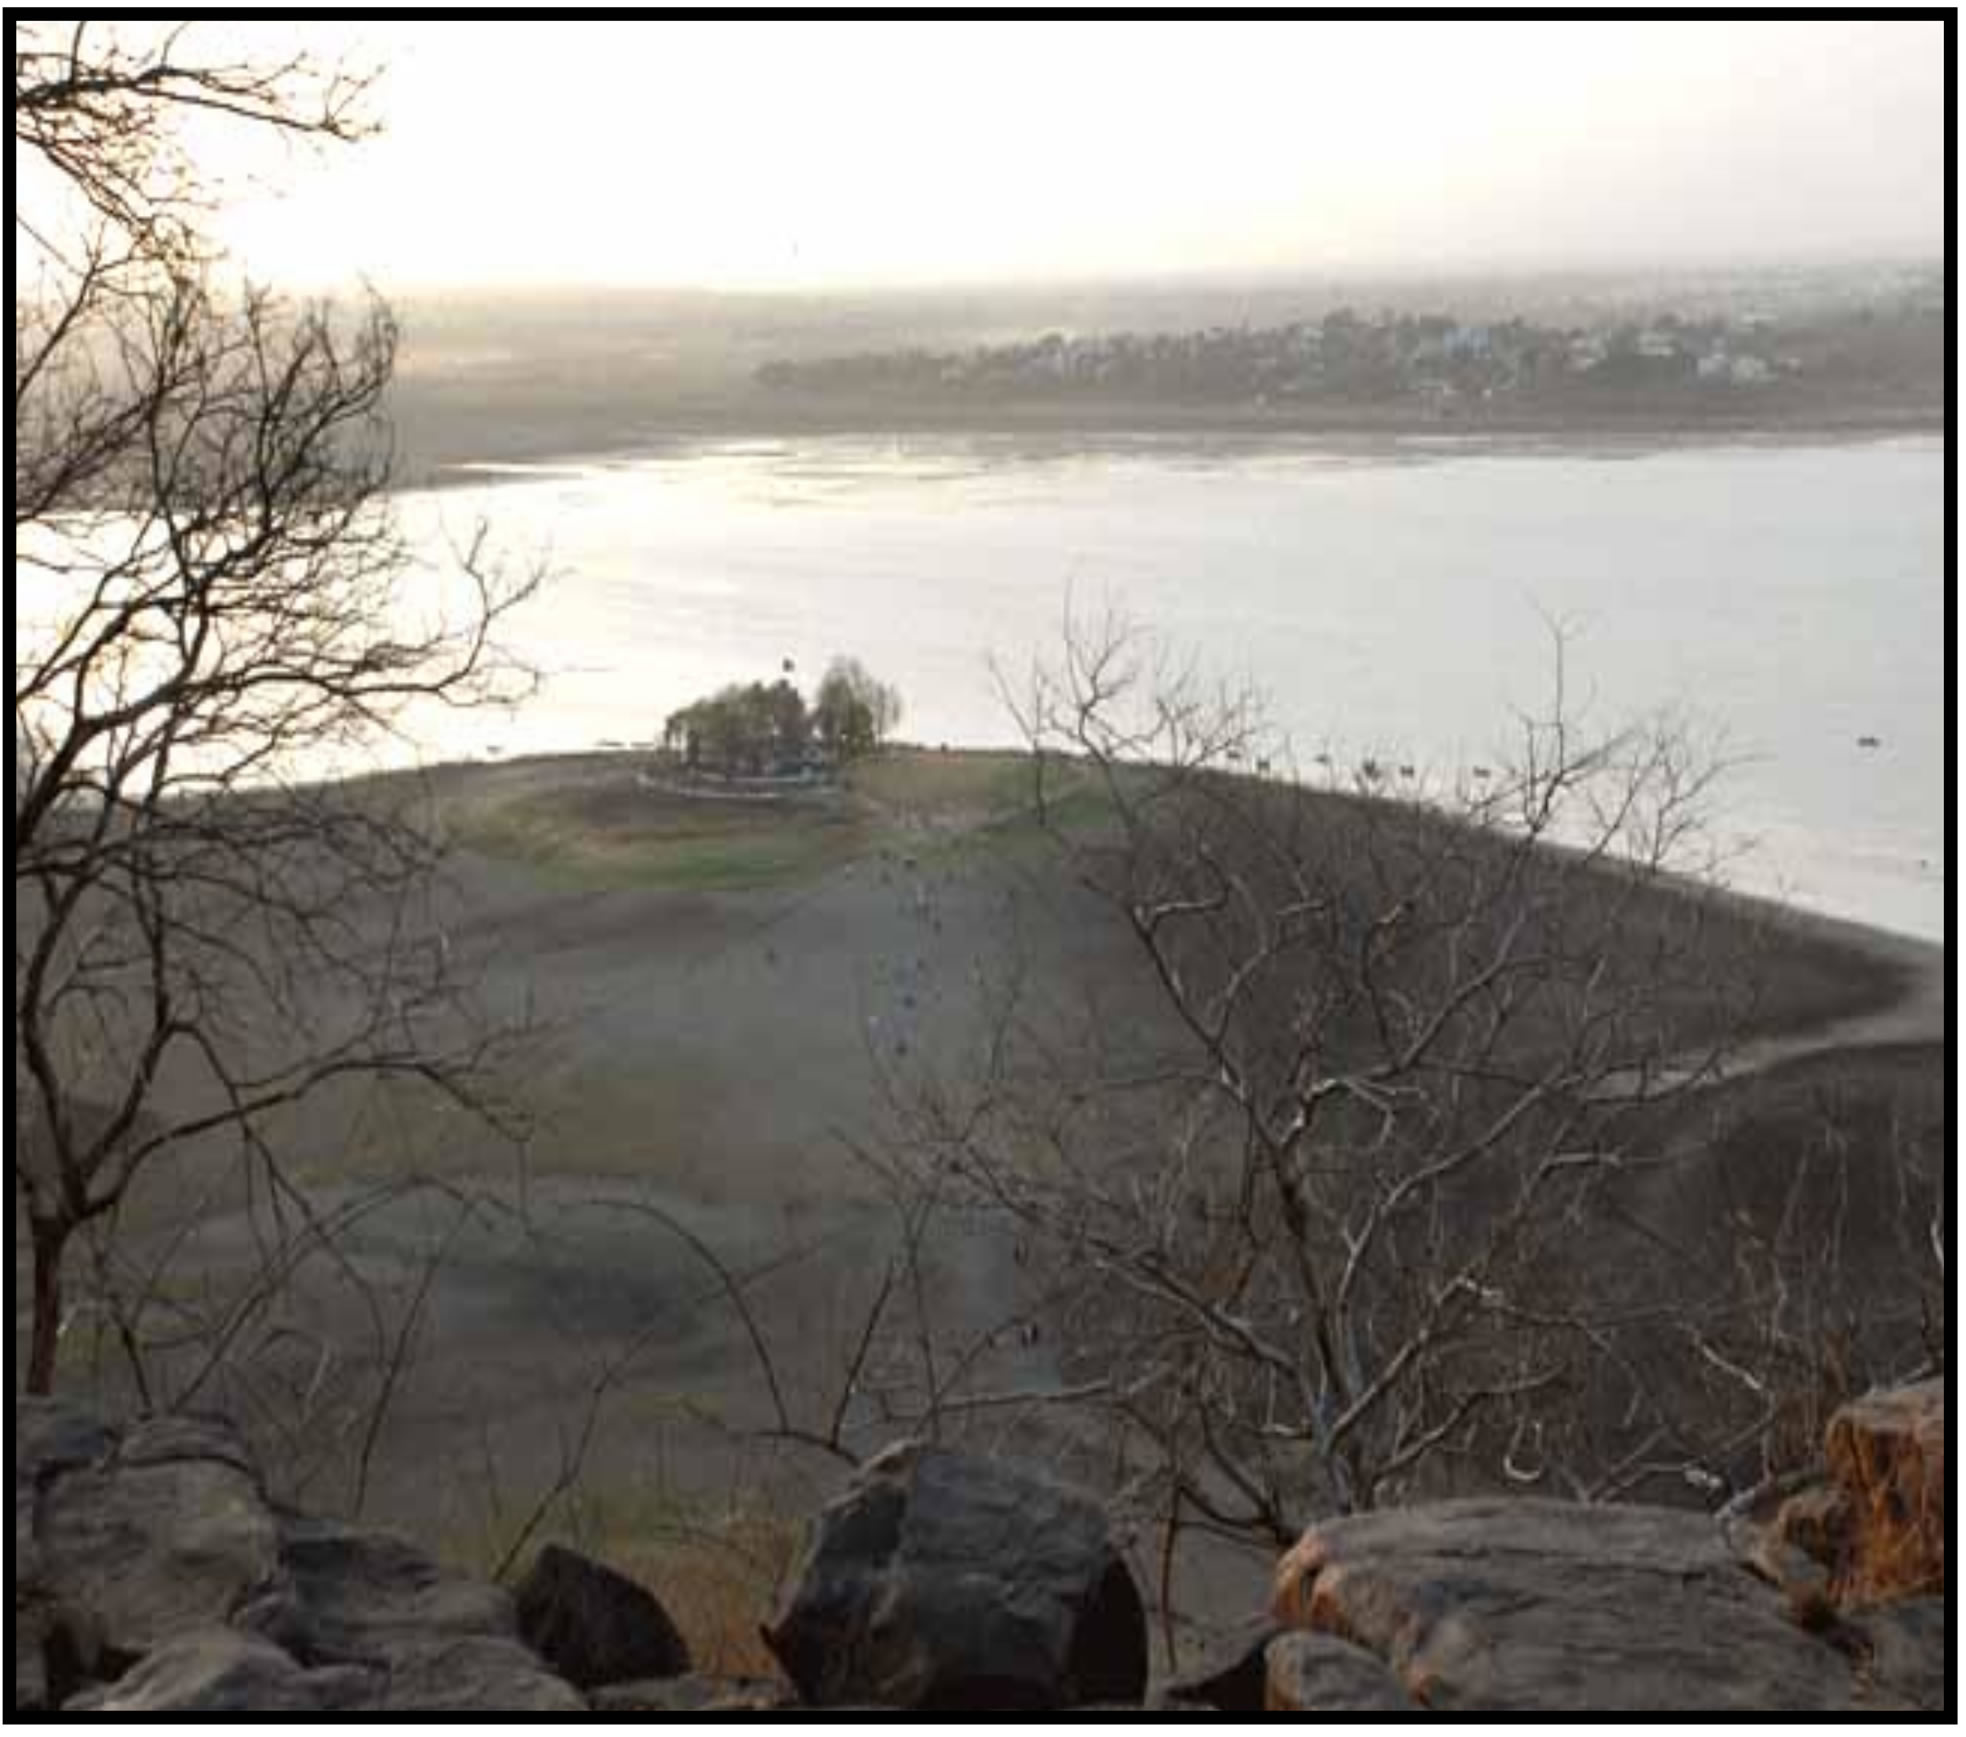
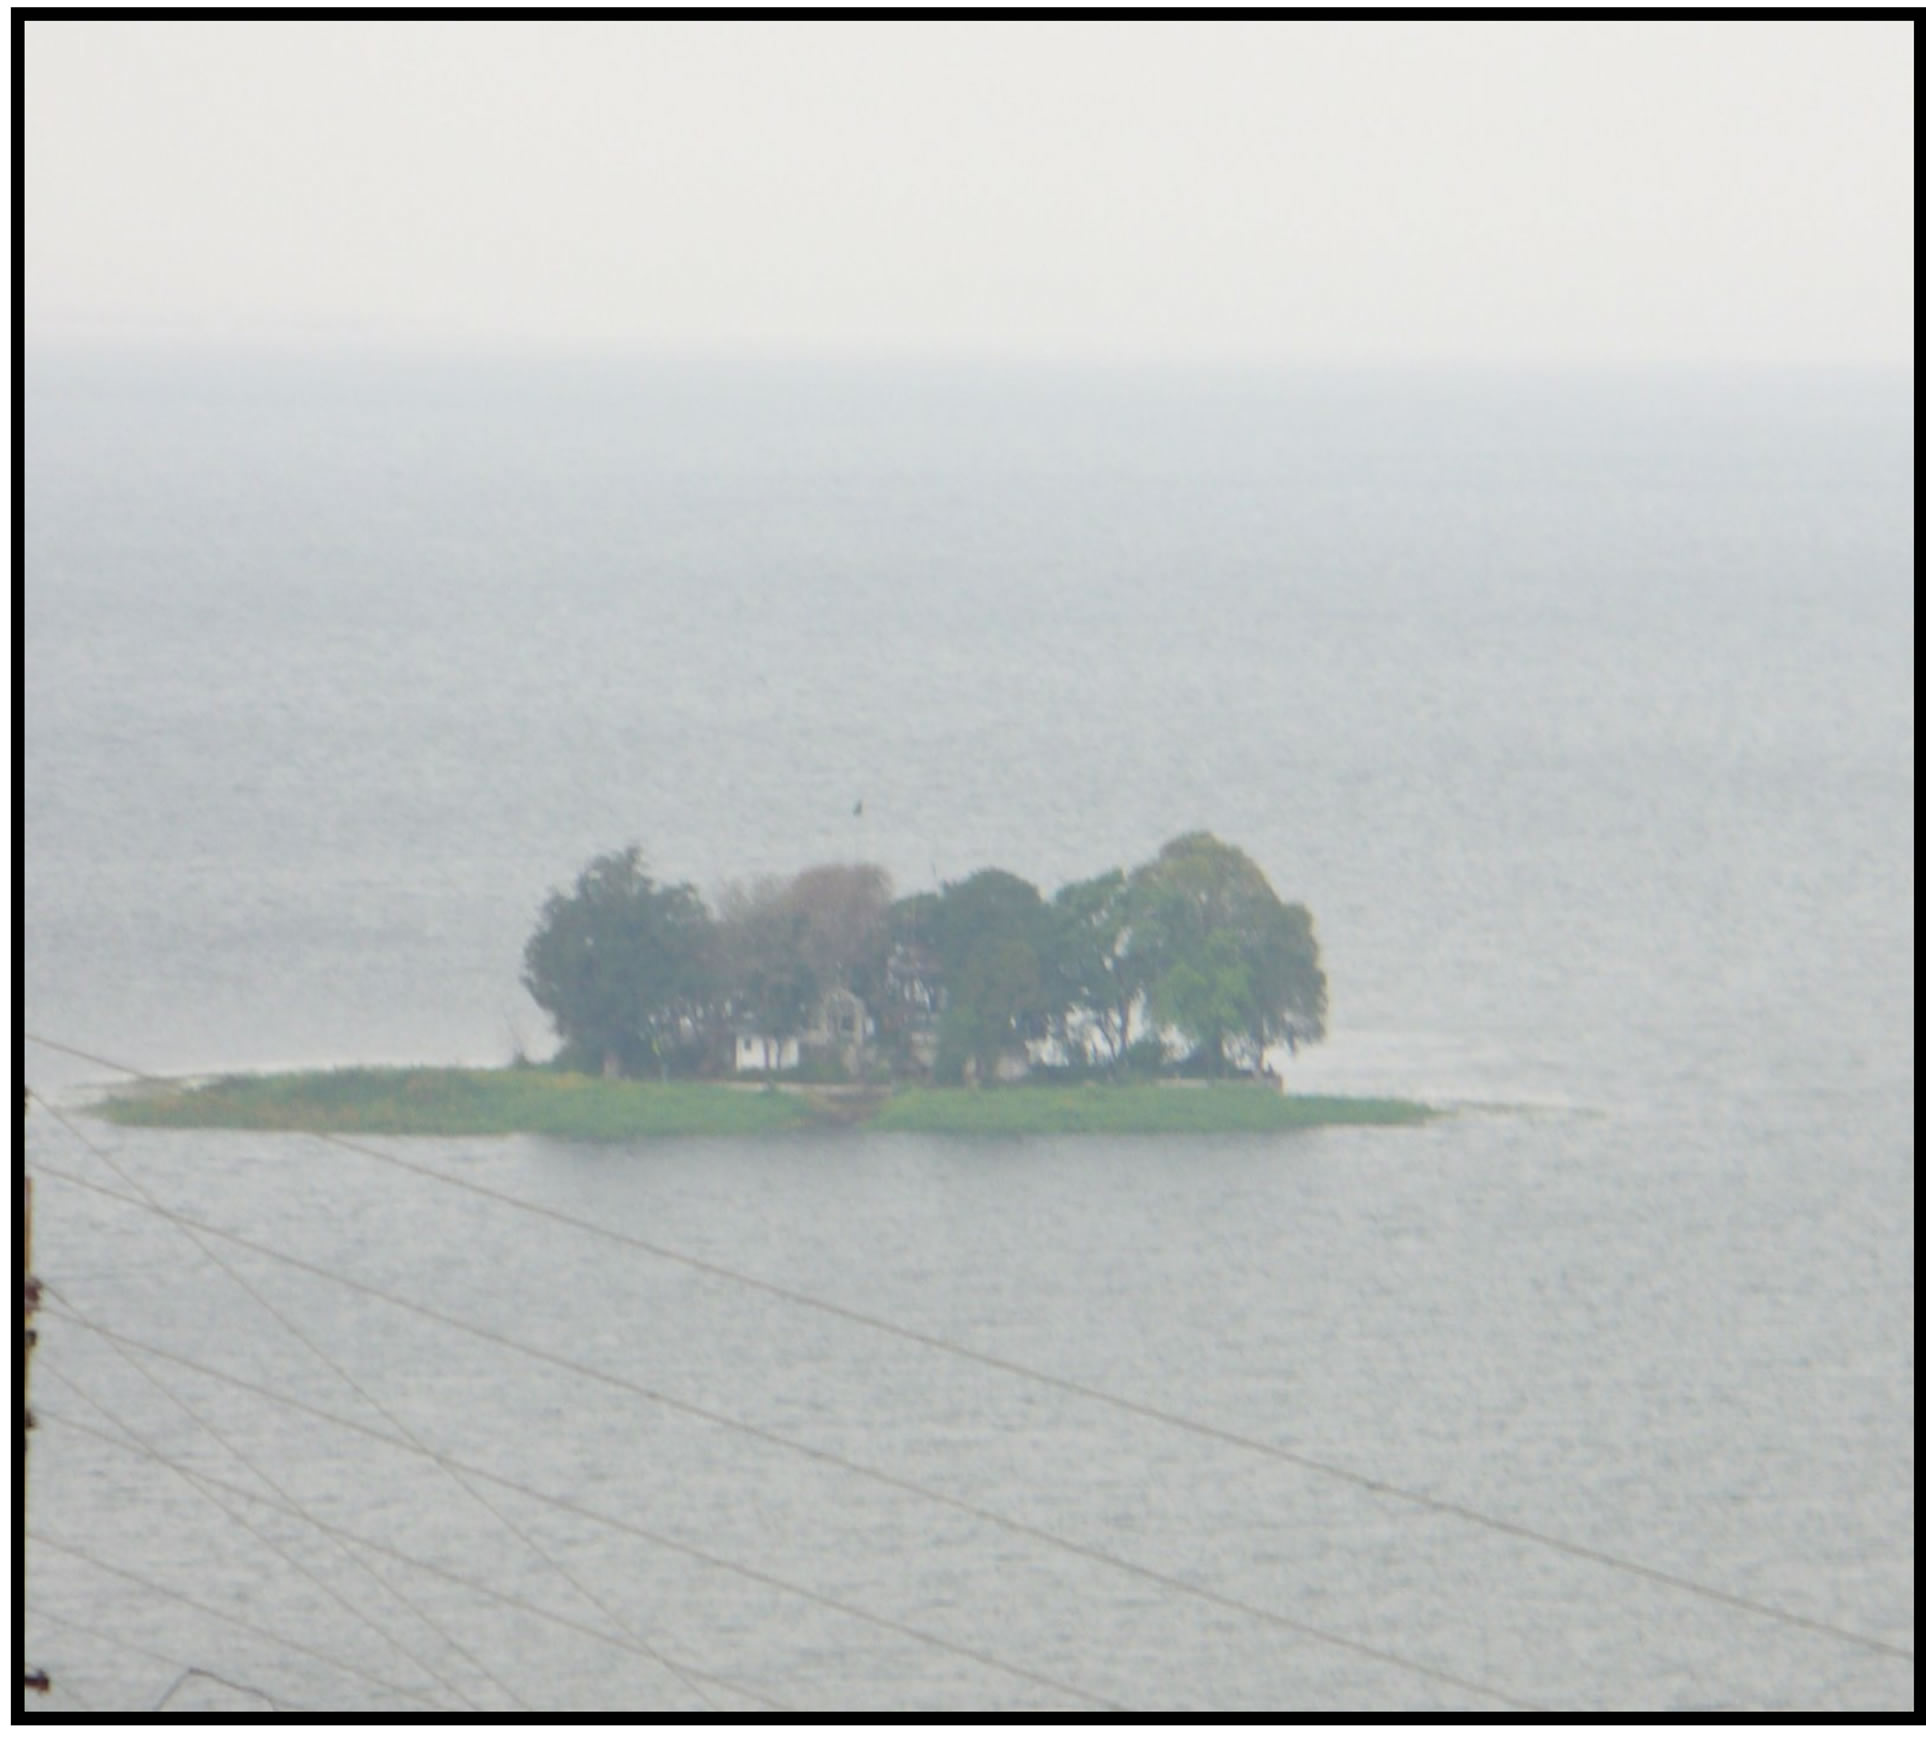
Figure 1. Bhopal, Upper Lake (original), Upper Lake (dried) 2009.
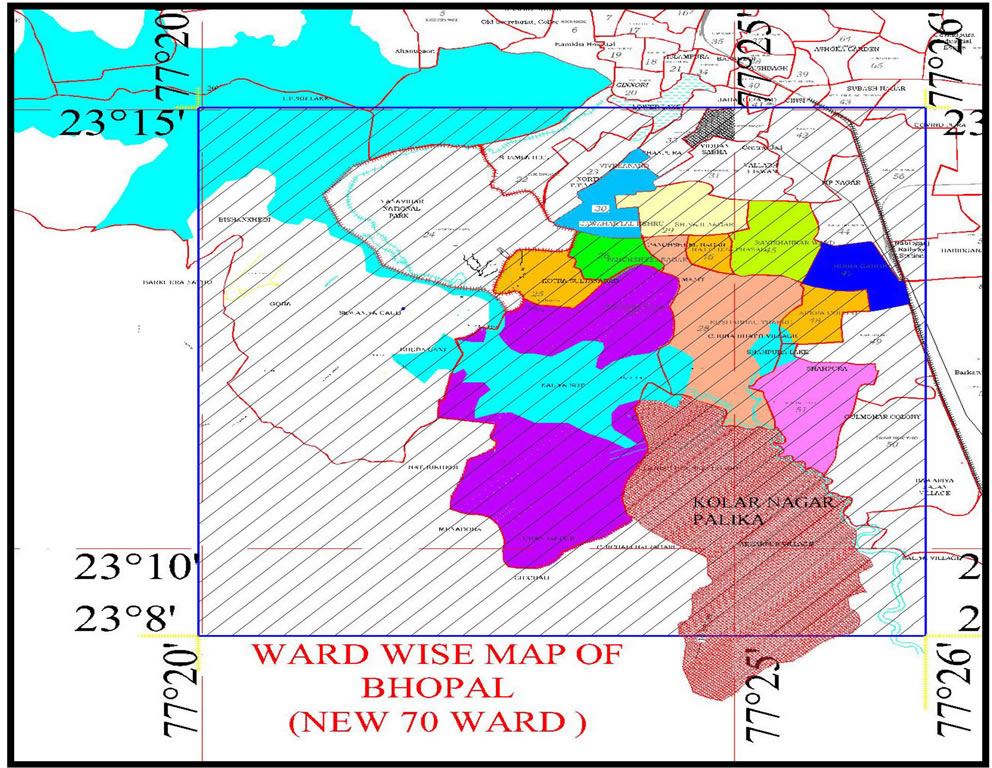
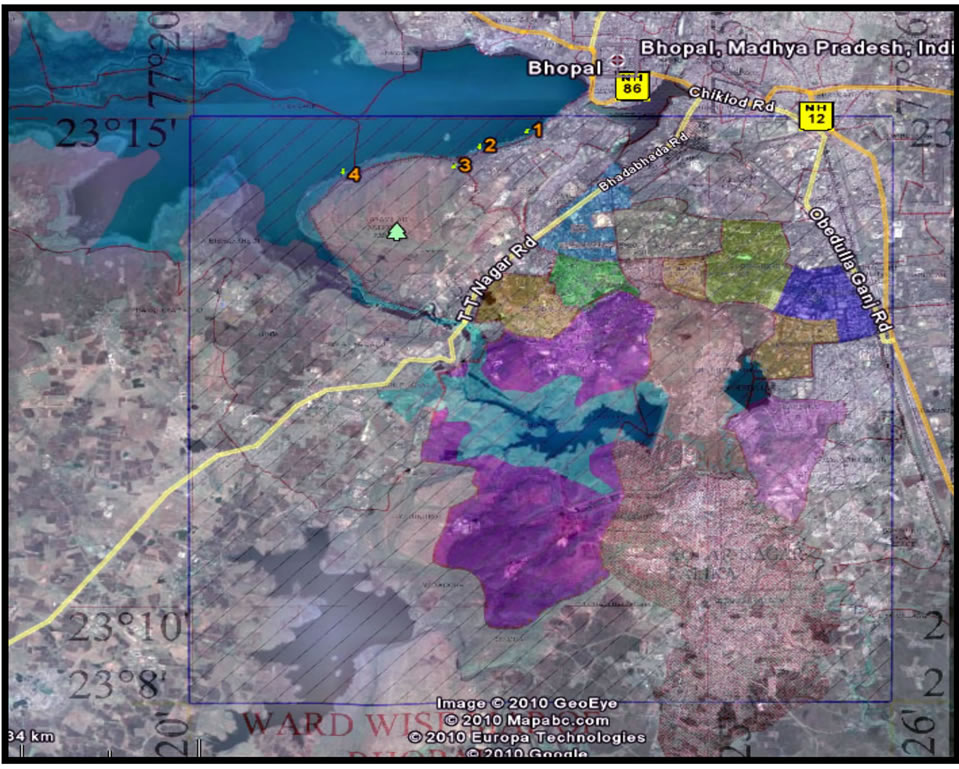
Figure 2. Study area.
tion of Upper Lake, Hills like Samasgarh, Forest Areas near Chichli, Nayagoan, Part of Kerwa River, Kerwa dam, Neelbad agriculture area all coming under Kolar Nagar Palika and Phanda Block of Bhopal and Zone 6 of Bhopal municipal corporation comprising ward No. 25, 26, 27, 28, 34, 45, 48, 52.
Physiography: There are many Vindhyan Hills observed in the southern part of Chichli. (Latitute 2309' and Longitude 77,024') Maladongre (Latitude 2308' and Longitude 77,019') and Satgari (Latitude 2308' and Longitude 77,023'). The Vindhyan rocks in the area have scarp faces towards south and gentle slope towards north, whereas the western part of the area is covered by traps.
2.1. Drainage
The rivers and their tributaries have a dentritic pattern. The major reason for development of dentritic drainage pattern is that the rocks in this are almost homogenous and nearly horizontal.
2.2 Rainfall
The average yearly rainfall has been observed as 1160 cm. the average monthly rainfall data and its cumulative departure from average annual precipitation is tabulated in tables.
• It is observed that 93.6% of annual rainfall takes place in the months June to September.
• 75% dependable rainfall has been worked out which is about 800 mm (Table 1).
1. 3. Collected Data [5-10]
2. SOI Toposheets map on 1:10,000;
3. Remotely sensed data—3 February 1991 (Sheet No. 1158), 6 January 1994 (Sheet No. 2209), 24 January 1996 (Sheet No. 2974), 24 March 2001 (Sheet No. 1287), 3 May 2009, from MPCST, Bhopal;
4. Geological Map 55-E (From GSI, Bhopal);
5. Georesource Map of Bhopal District (From GSI Bhopal);
6. Physiography map (Topo Sheet 1975);
7. Built up area ward wise and village wise (imageries);
8. Water table fluctuations, premonsoon & post monsoon water level data from CGWB (Centre for Ground Water Board) M.P & SWDC (State water Data Centre, M.P);
9. Water quality data (optional);
10. Rainfall data, SWDC;
11. District Census Handbook, Bhopal District;
12. SOI Toposheets map on 1:50,000 scale, Sheet No. 55E/8.
4. Research Methodology: Figure 3
5. Calculation of Recharge and Built-Up: (1. Chuna Bhatti and 2. Arera Colony, Tables 2 and 3) [11-14]
5.1. Comparative Charts: Figure 4 [11,12]
Similarly almost 22 maps have been prepared to depict the increasing built up area over the study area and changes in natural flow of drainages (See Maps (a) and (b)).
6. Observations
Recharge percentage in ground water level (observed):
• 65%—0 m to 3 m;
• 37.50%—3 m to 6 m;
• 52.10%—6 m to 9 m;
• 9.75%—above 9 m.
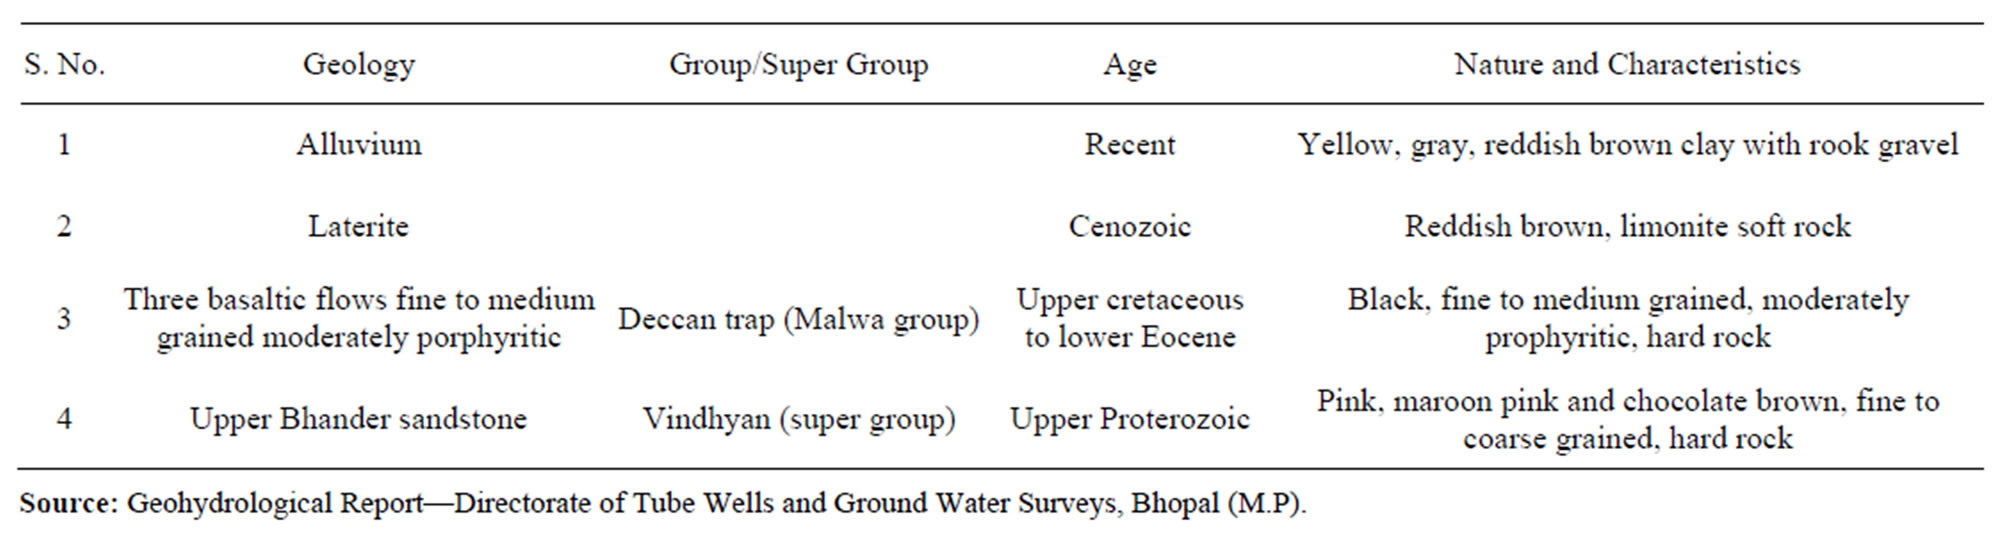
Table 1. Geological characteristics of Bhopal.
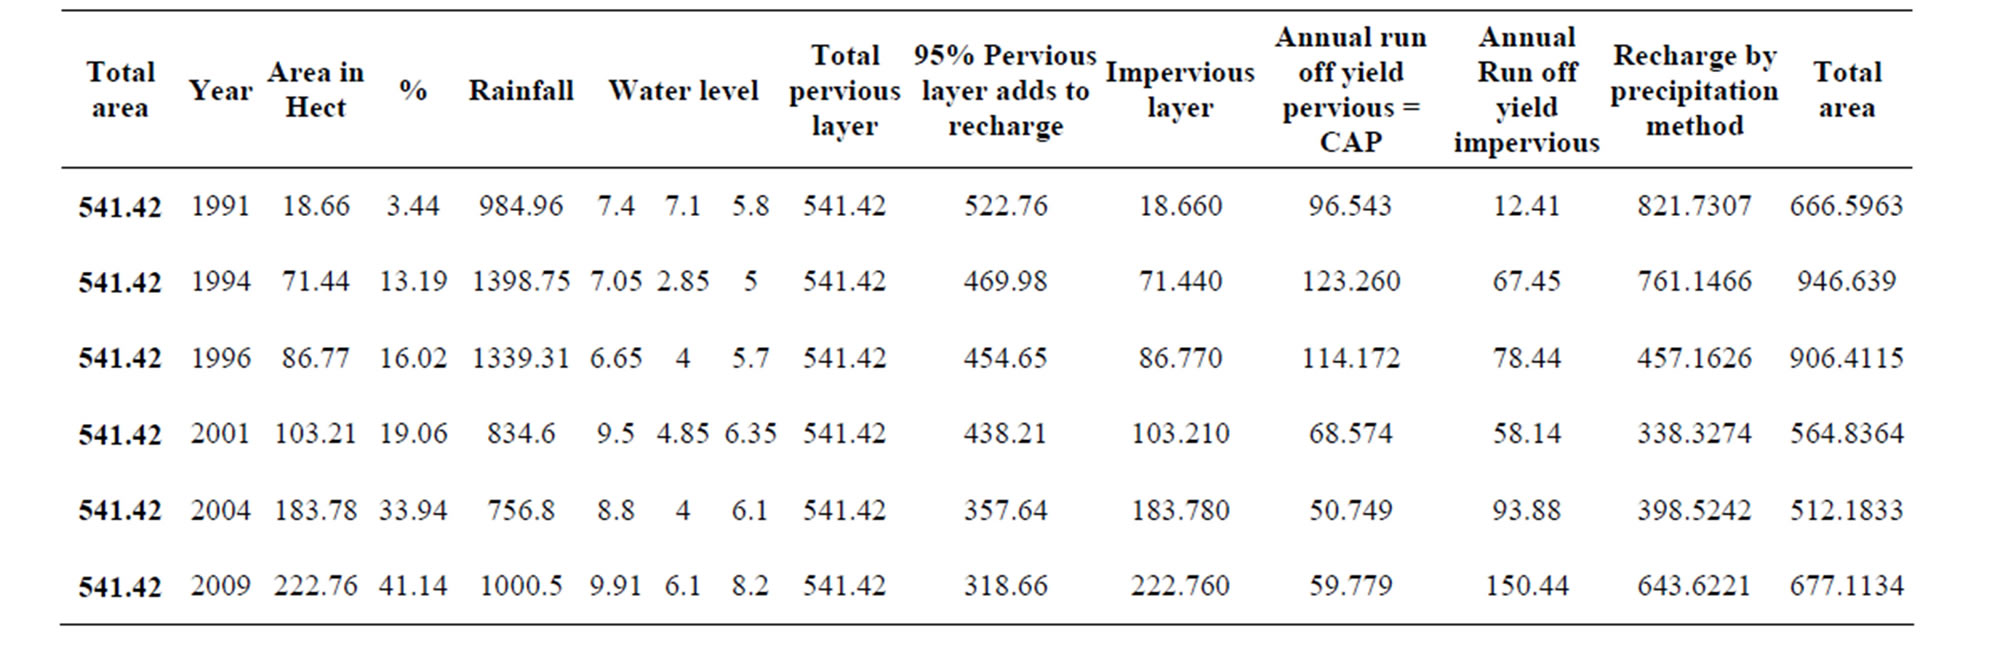
Table 2. Readings for Chuna Bhatti Ward.
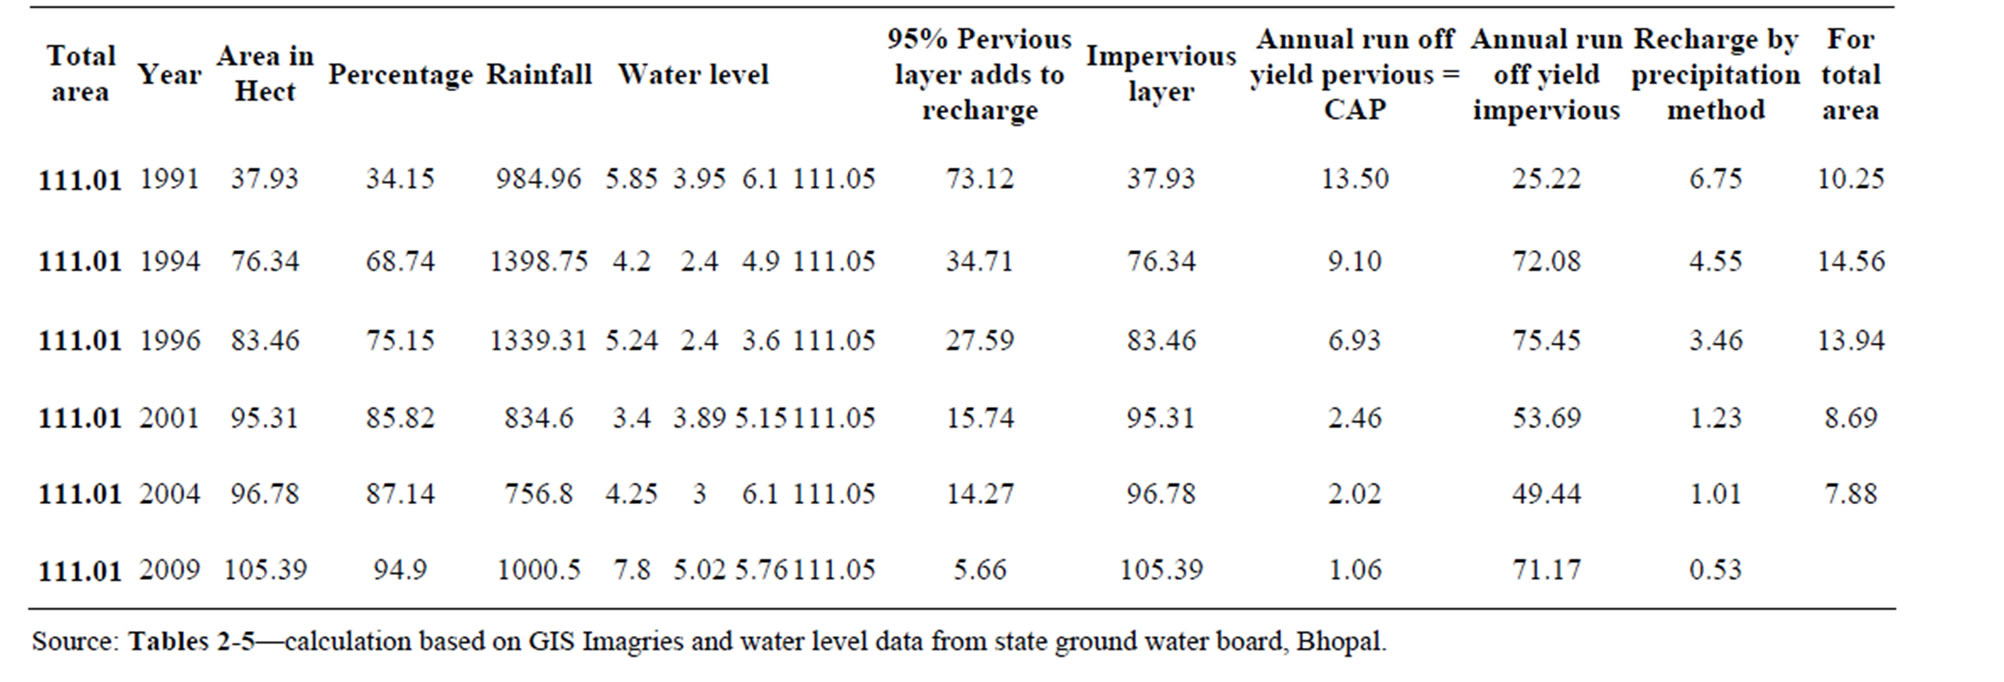
Table 3. Readings for Arera Colony Ward.
Effects Observed Due to Urbanization
In highly urbanized area, a major flow peaks are amplified, and many new peaks also appear. These result from similar storms, some of which produce no storm runoff at all before development, but which now can generate substantial flows.
Thus, urban development does more than simply magnify peak discharges; it has also created entirely new peak run-offs events. As a result, floods of any given discharge occur much more frequently after urbanization. For example, if the discharge of the 2-year flood doubles following urbanization, then clearly the (smaller) discharge has now exceeded more frequently than every two years, on average. These changes in frequency are quite dramatic; discharges once associated with large, multi-year or multi-decade strom events now inundate the urban basin one or more times per year.
 (a)
(a)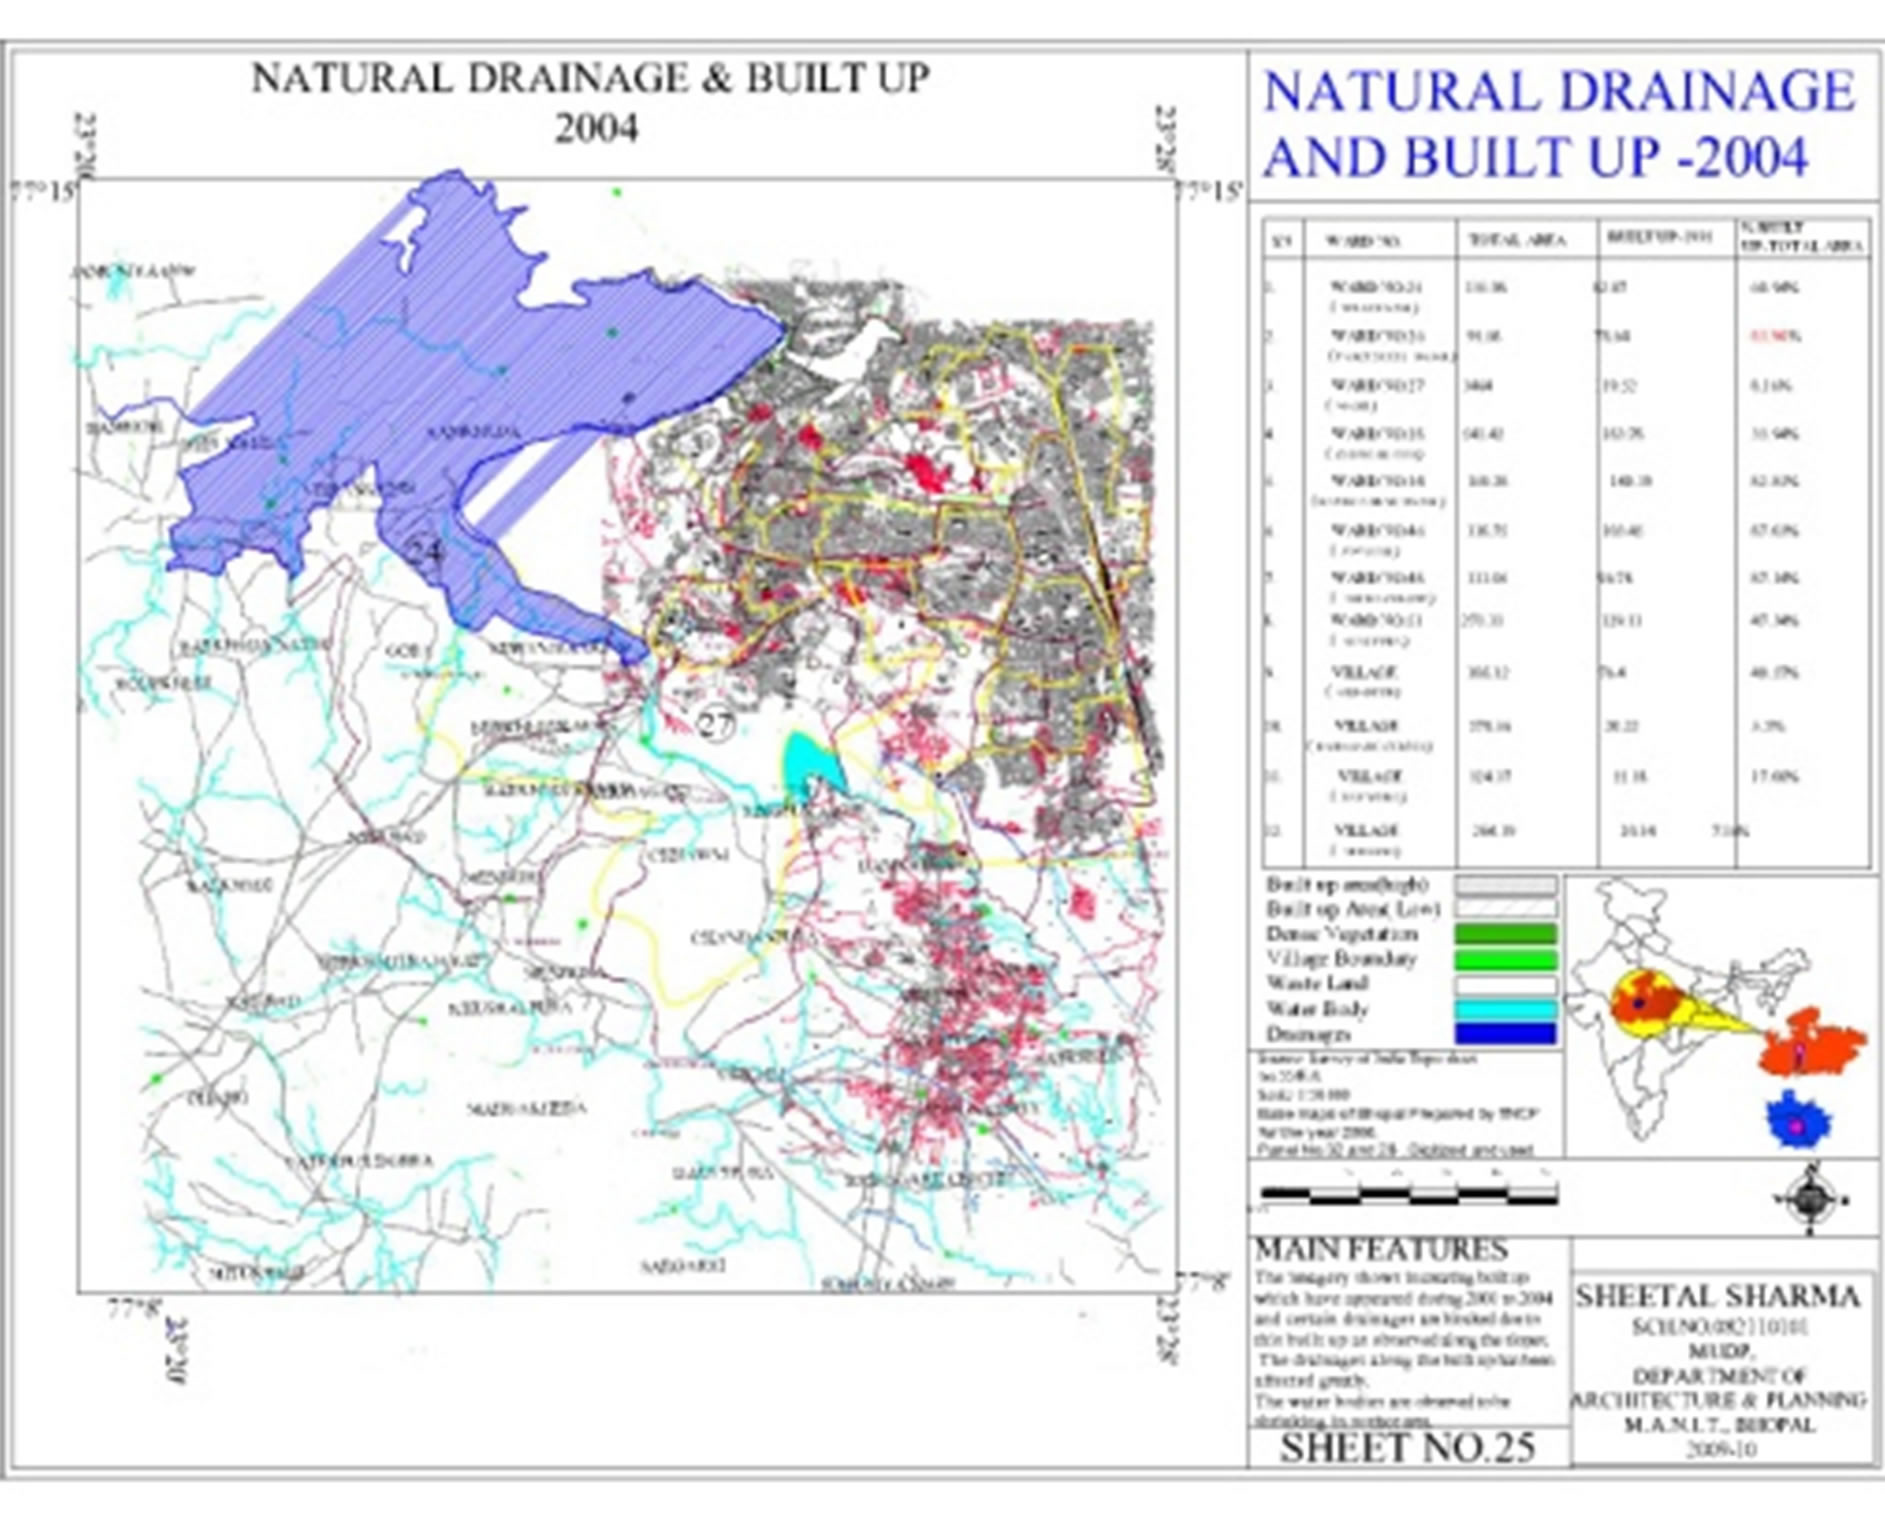 (b) p class="sacImgMarkCss"> Map . (a) Plan showing wards; (b) Plan showing drainage and built up.
Urban development has not only increased flows, it has also encroached on the stream corridor—the zone surrounding the channel that has influenced the hydrology and biology of the flow. Frequently, this has lead to the clearing of streamside vegetation, particularly trees. The consequences of this clearing are two fold: First, less wood enters the channel, depriving the stream of stabilizing elements that help dissipate flow energy and usually help protect the bed and banks from erosion. Second, the overhead canopy of a stream is lost, eliminating the shade that controls temperature and supplies leaf litter that enters the aquatic food chain.
7. Conclusions
The calculations show that the urban areas experienced changes in natural working of drainage in different periods and having different built up areas on it.
Calculations also show that as the impervious area increased there was dramatic change in runoff from that area which contributed to Flood and not to recharging of water (Table 4).
Calculations also show that areas of agriculture use also have very little recharge even if they have very little Built up as these areas have different soil types but heavy pumping due to unavailability of water supply.
Some areas though urbanized maintained recharge some areas rural failed the expected re-charge. Recharge has decreased in areas with instant development of Built up areas indicating the increase in impervious layer to the geology of the area.
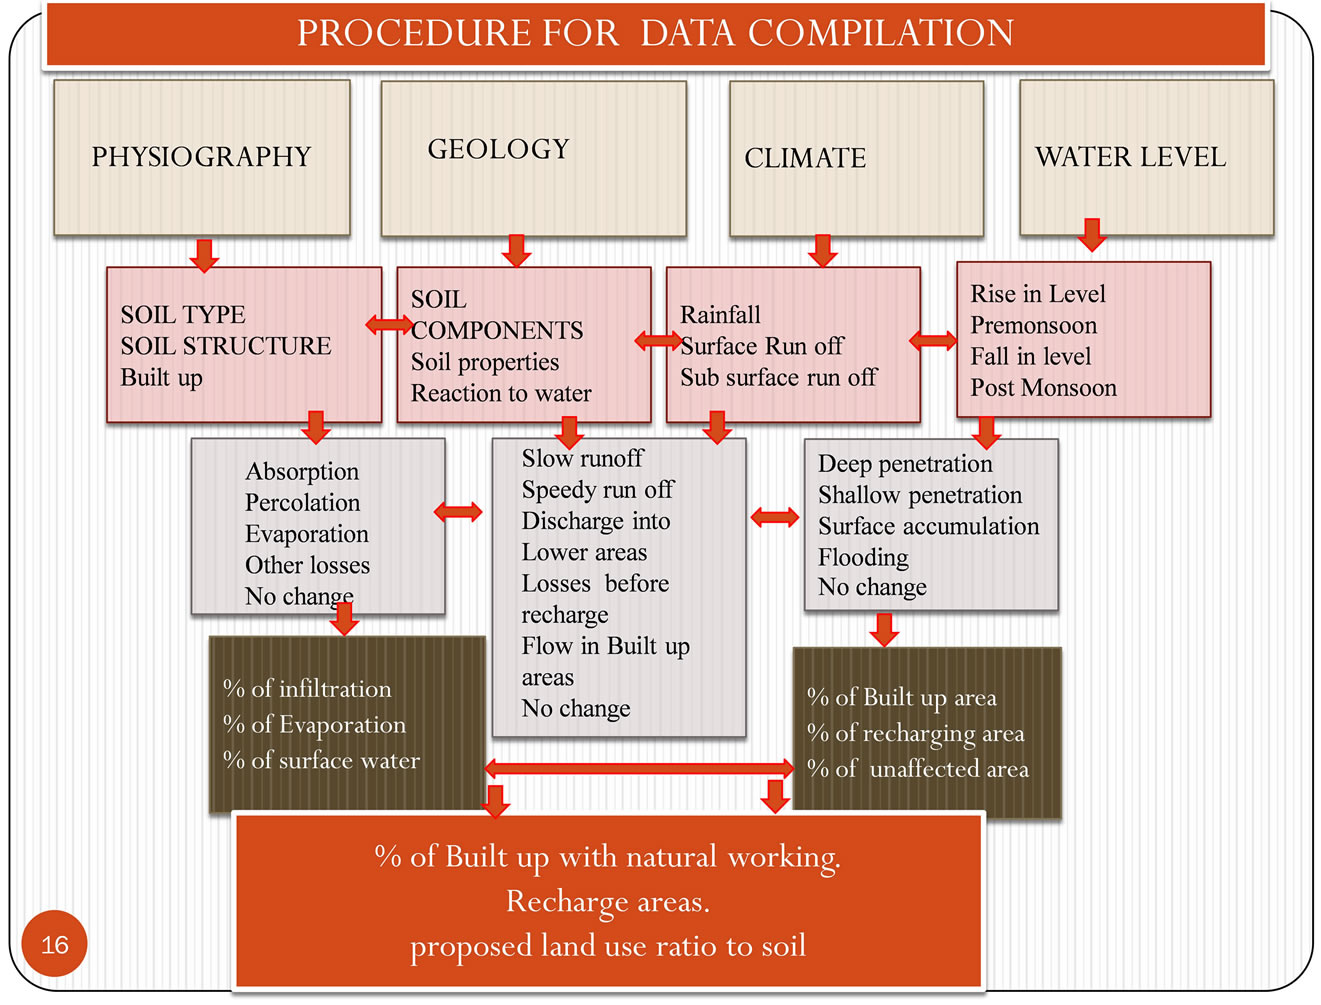
Figure 3. Methodology adopted. Source: Self developed.
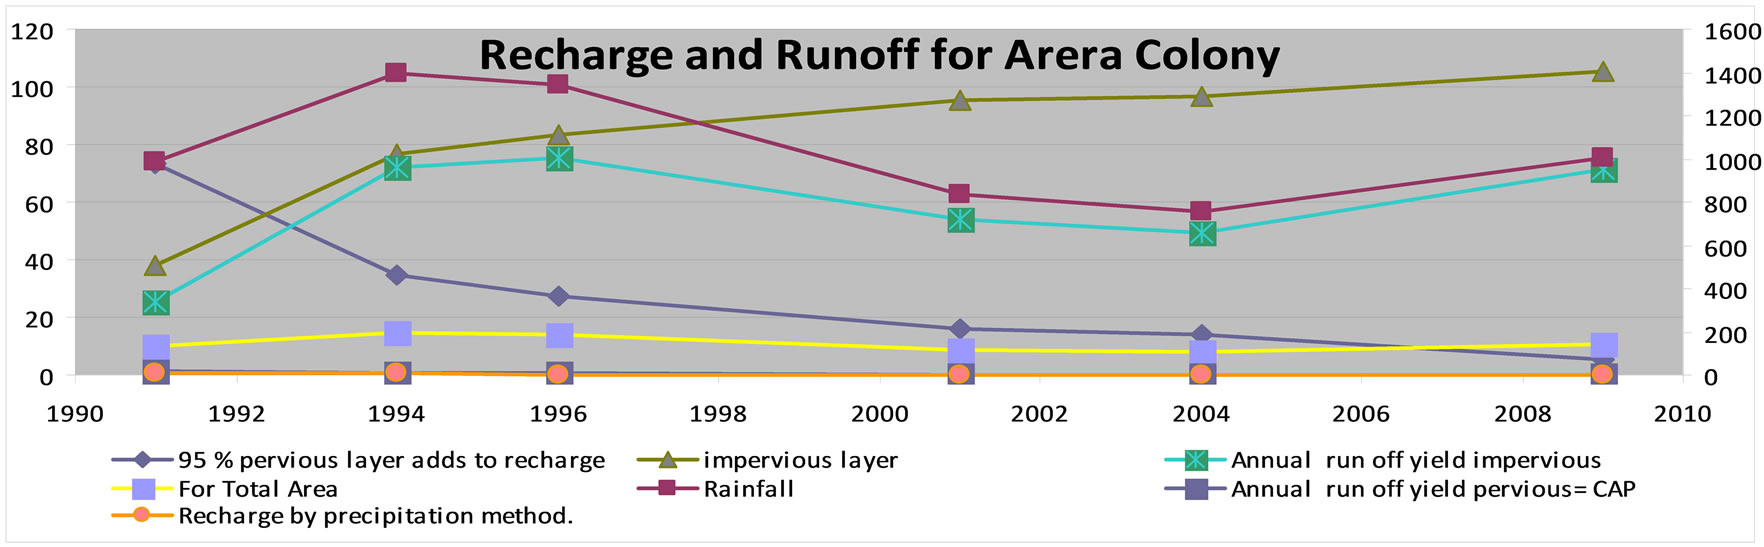
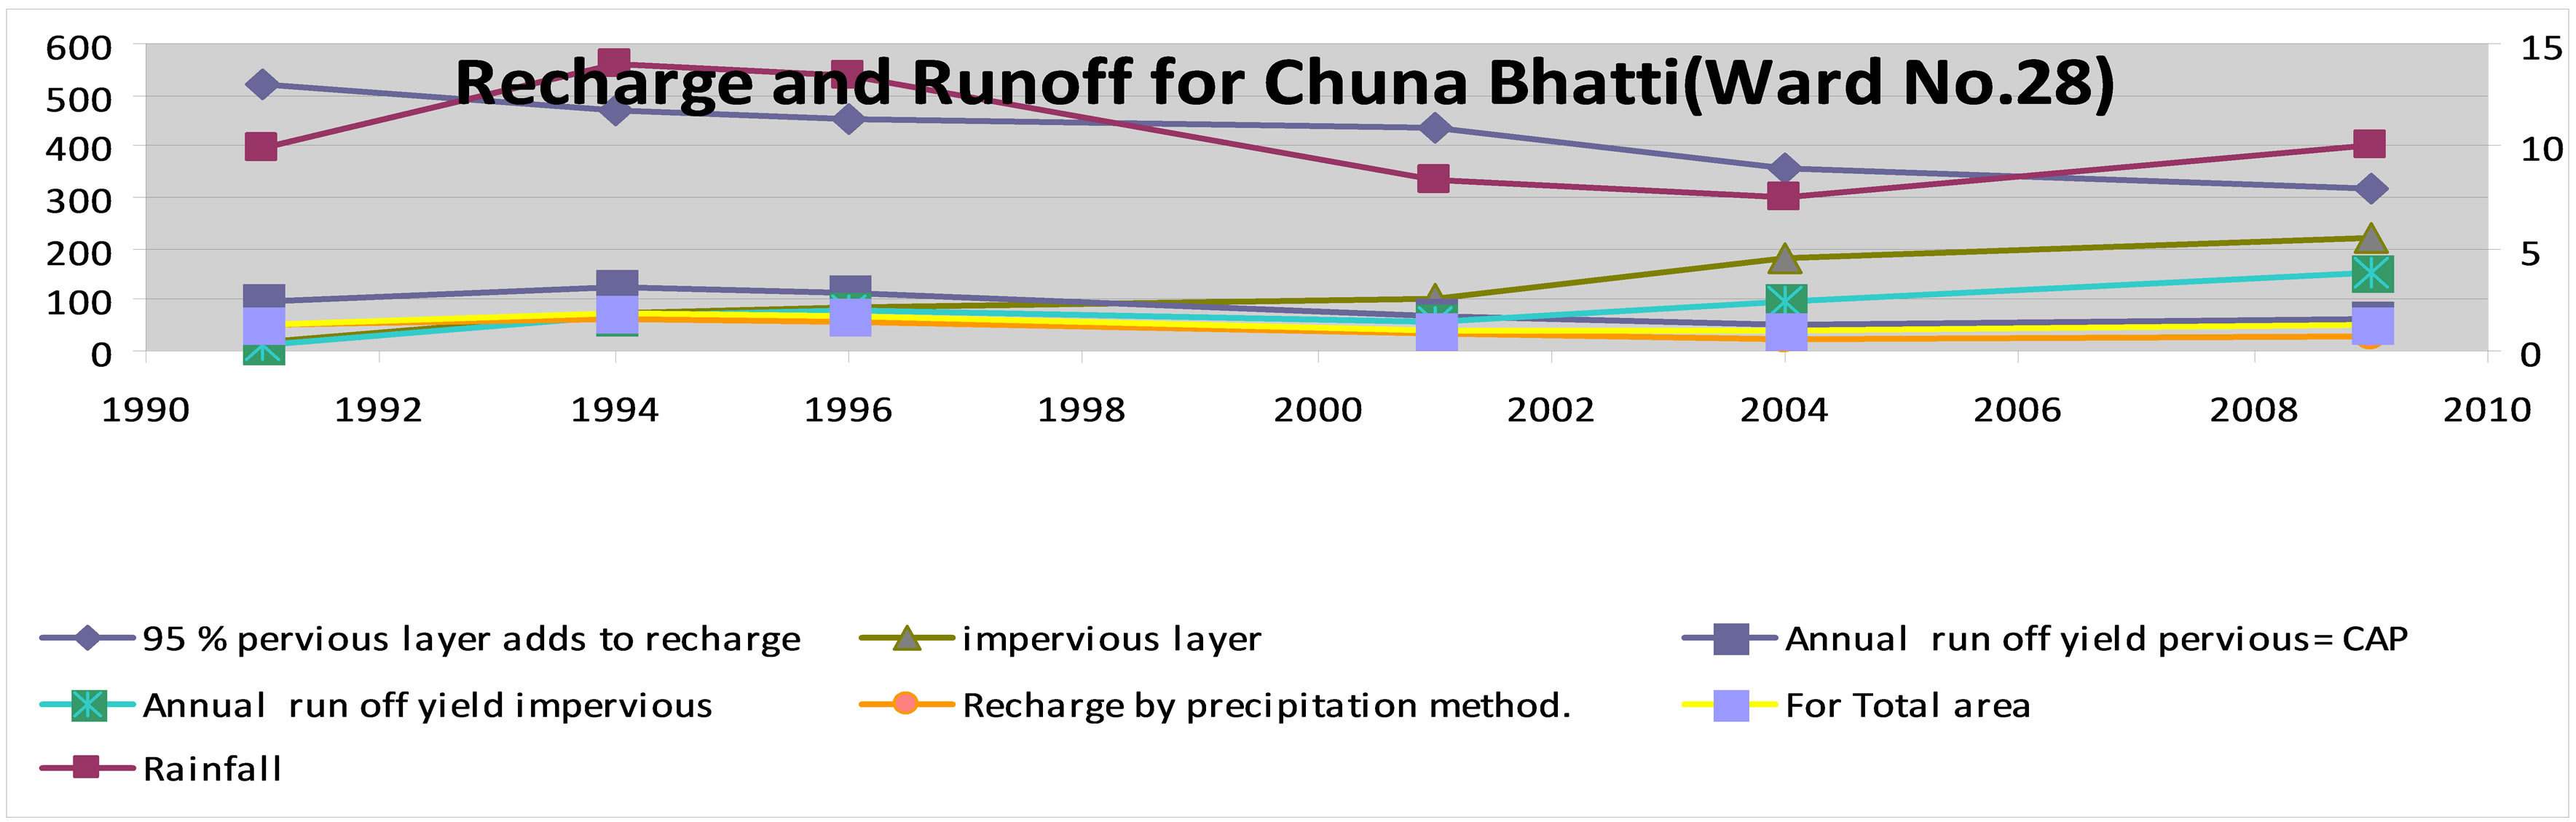
Figure 4. Recharge and runoff for Arera colony; Recharge and runoff for Chuna Bhatti (Ward No. 28).
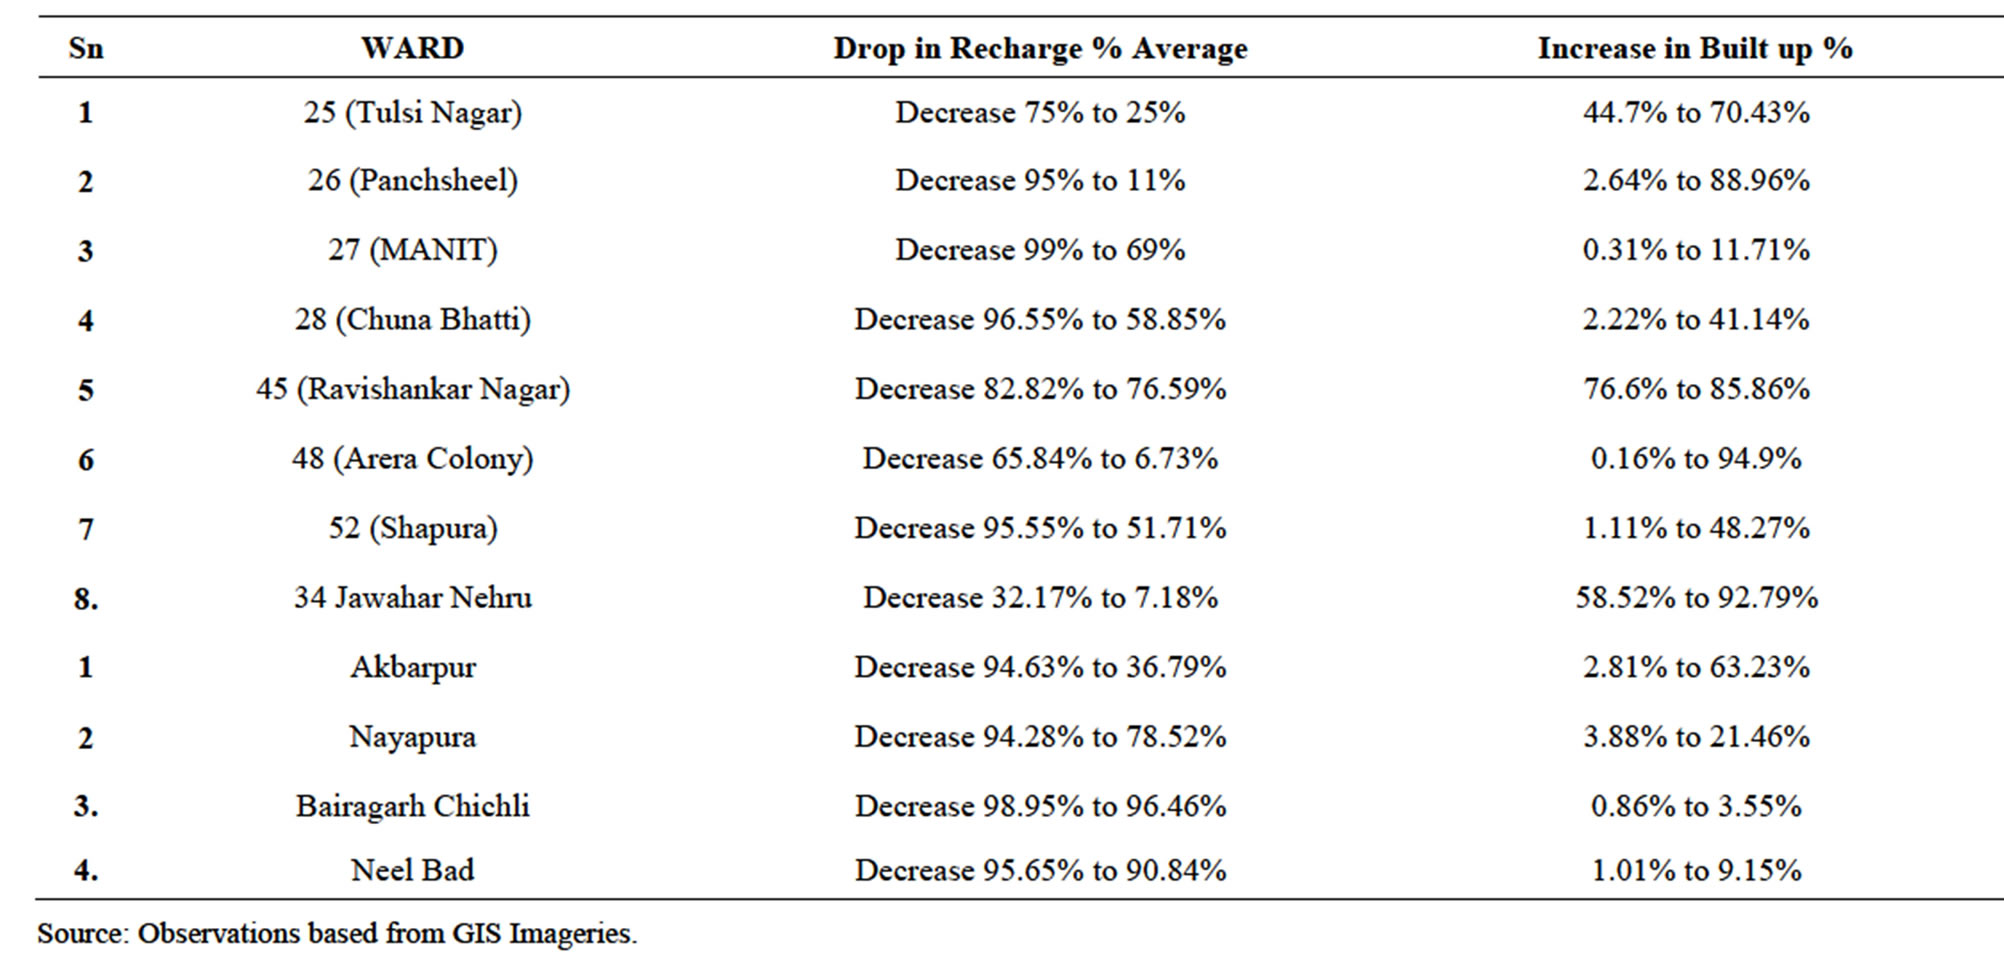
Table 4. Changes observed in built up and recharge in study area.
This decreases the pervious layer and increases evaporation along with runoff resulting in wastage of water and less water table called water recharge.
The areas with many folds are also seen suitable for modification whereas areas with faults and cracks damage seriously the water table as water percolated deep into the ground and built up on it blocks the cracks resulting in more runoff (Table 5).
Areas with vegetation cover, helps to slow down the runoff, hence the parks and playgrounds can play an interception area for such runoff that goes waste in urbanized cases.
The areas having Basalt stone with water level 3 - 6 m is most suitable for urban development as the water table
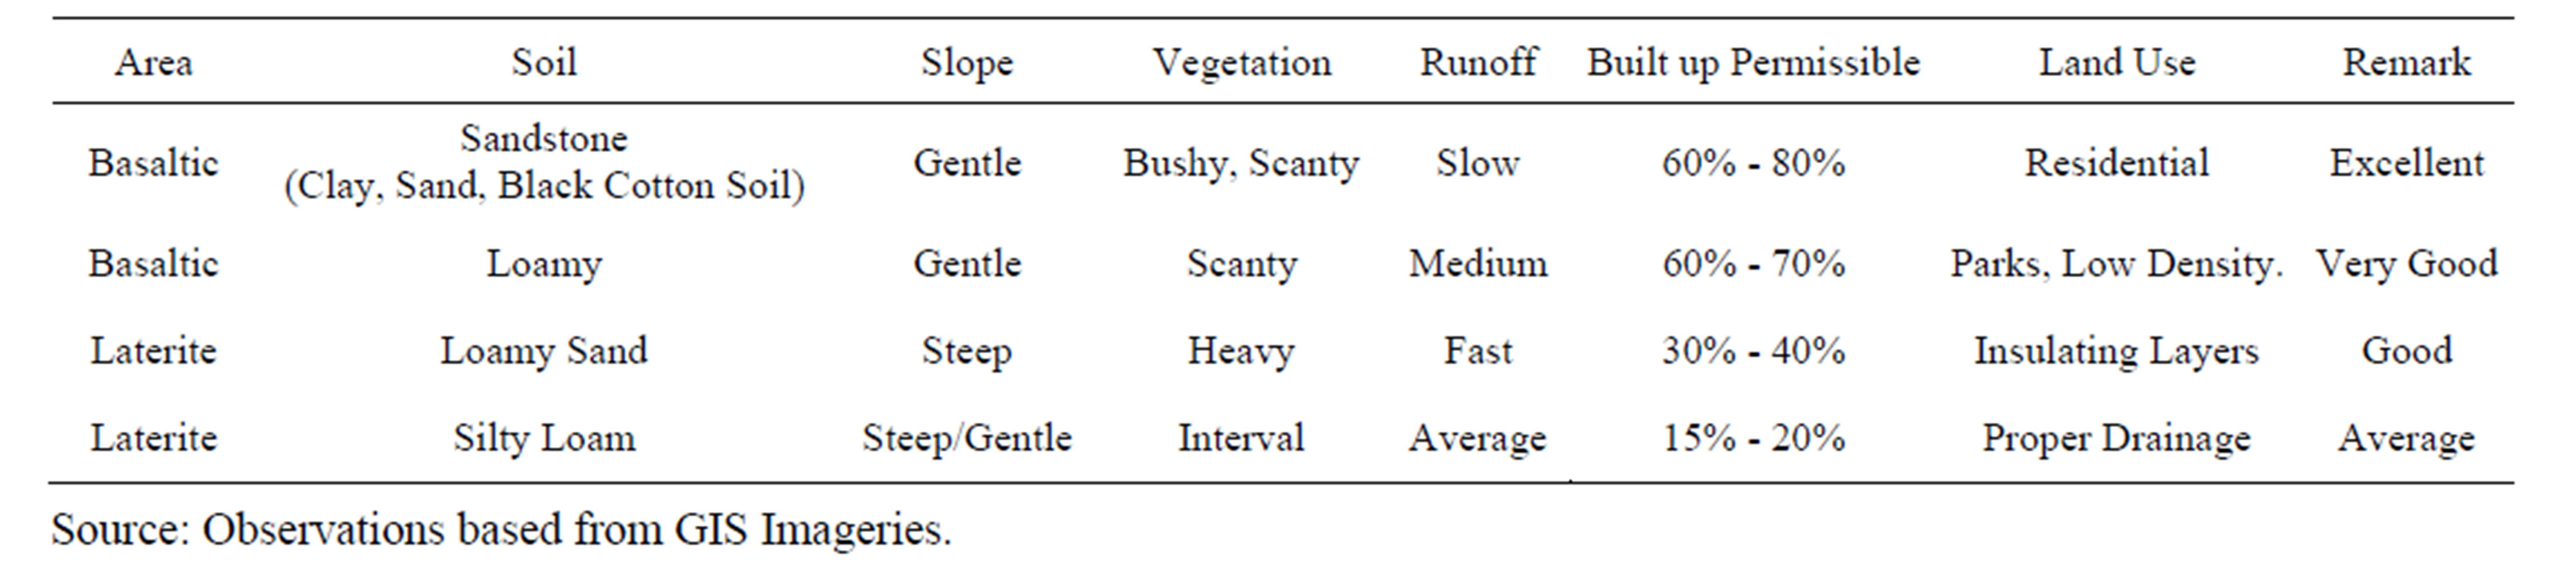
Table 5. Areas and characteristics of soil and hydrology found suitable for urban growth.
depth of 3 - 6 m soil gets affected by the foundation and excavation activities of the development.
8. Suggestions
We should “go with the flow” of natural processes more in urban planning and designing the land use to improve the living environment.
For good management, only that portion of the overall recharge should be abstracted which is not needed by the ecology, ensuring protection of groundwater from all contamination, developing new principles in urban water resource assessment and management with minimum anthropogenic impacts.
Opinion should be selected with changing effectiveness and performances of water-uses, based on a stepwise process of generating detailed scientific information packages on hydrogeological characteristics of the groundwater flow field and the contaminants dynamics under natural and stressed conditions.
REFERENCES
- Roberto Sánchez-Rodríguez, 2005.
- GRUMP, 1997.
- Worldwater, 2007.
- Gleick, 2008-2009.
- SOI Toposheets Map on 1:50000 Scale, Sheet No. 55E/8.
- SOI Toposheets Map on 1:10,000.
- Remotely Sensed Data—3 February 1991 (Sheet No. 1158), 6 January 1994 (Sheet No. 2209), 24 January 1996 (Sheet No. 2974), 24 March 2001 (Sheet No. 1287), 3 May 2009, from MPCST, Bhopal.
- Geological Map 55-E (From GSI, Bhopal).
- Georesource Map of Bhopal District (From GSI Bhopal).
- Physiography Map (Topo Sheet 1975).
- Built up Area Ward Wise and Village Wise (Imageries).
- Premonsoon & Post Monsoon Water Level Data from CGWB. Water Quality Data (Optional).
- Rainfall Data, SWDC.
- District Census Handbook, Bhopal District.