Open Journal of Modern Hydrology
Vol.3 No.3(2013), Article ID:33989,5 pages DOI:10.4236/ojmh.2013.33013
HEC-RAS Model for Mannnig’s Roughness: A Case Study
![]()
Center for Water Engineering and Management, Central University of Jharkhand, Ranchi, India.
Email: prabeer11@yahoo.co.in
Copyright © 2013 Prabeer Kumar Parhi. This is an open access article distributed under the Creative Commons Attribution License, which permits unrestricted use, distribution, and reproduction in any medium, provided the original work is properly cited.
Received June 18th, 2012; revised July 20th, 2012; accepted July 28th, 2012
Keywords: Hydrodynamic Model; Flood Simulation; Flood Forecasting; HEC-RAS; River Mahanadi
ABSTRACT
Channel roughness is considered as the most sensitive parameter in development of hydraulic models for flood forecasting and flood inundation mapping. Hence, it is essential to calibrate the channel roughness coefficient (Mannnig’s “n” value) for various river reaches through simulation of floods. In the present study it is attempted to calibrate and validate Mannnig’s “n” value using HEC-RAS for Mahanadi River in Odisha (India). For calibration of Mannnig’s “n” value, the floods for the years 2001 and 2003 have been considered. The calibrated model, in terms of channel roughness, has been used to simulate the flood for year 2006 in the same river reach. The performance of the calibrated and validated HEC-RAS based model has been tested using Nash and Sutcliffe efficiency. It is concluded from the simulation study that optimum Mannnig’s “n” value that can be used effectively for Khairmal to Barmul reach of Mahanadi River is 0.029. It is also verified that the peak flood discharge and time to reach peak value computed using Mannnig’s “n” of 0.029 showed only an error of 5.42% as compared with the observed flood data of year 2006.
1. Introduction
For flood forecasting, flood plane mapping and flood volume estimation, various hydrodynamic models, based on hydraulic routing, have been developed and applied to different rivers in the past using computer technology and numerical techniques. For flood warning, the discharge and river stage were chosen as the variables, which along with other hydraulic properties are interrelated to each other [1]. Among various hydraulic parameters, the channel roughness plays very important role in the study of open channel flow particularly in hydraulic modeling. Channel roughness is highly variable which depends upon number of factors like surface roughness, vegetation cover, channel irregularities, channel alignment etc. [2]. It also depends on such factors as: bed material, vegetation, channel irregularity and alignment, scour and deposition, obstructions, channel size and shape, stage and discharge, seasonal changes, suspended material and bed load [3].
Earlier, good numbers of researchers including Patro et al. [4], Usul and Turan [5], Vijay et al. [6], Parhi et al. [7] and Wasantha Lal [8] have calibrated channel roughness for different rivers for the development of hydraulic model for flood forecasting and flood plane mapping. Ramesh et al. [2] estimated single channel roughness value for open channel flow using optimization method, taking the boundary condition as constraints. Timbadiya et al. [9] calibrated channel roughness for Lower Tapi River, India using HEC-RAS model. Ross Doherty [10] calibrated the channel roughness for large number of semiarid rivers of Western Australia having variable channel characteristics for development of rating curves.
In the above context, there is a need to calibrate the channel roughness coefficient (Mannnig’s “n” value) for the River Mahanadi, Odisha through simulation of floods, using HEC-RAS. It will be pertinent to mention that the river Mahanadi experiences severe floods frequently causing huge loss to life and property. Hence the present study attempts to accurately estimate the channel roughness of the upstream reach of river Mahanadi beyond Hirakud reservoir from Khairmal to Barmul gauging stations.
2. Model Description
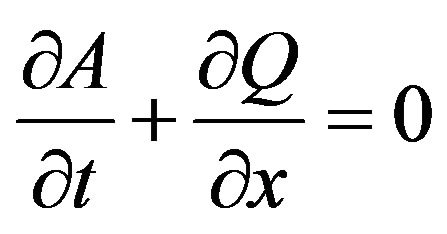
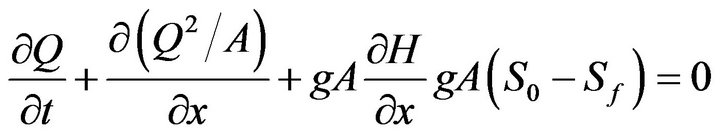
In the present study, unsteady, gradually varied flow simulation model, which is dependent on finite difference solutions of the Saint-Venant equations (Equations (1) and (2), has been used to simulate the flood in the Mahanadi River. Here HEC-RAS has been used to perform one dimensional hydraulic calculation for full network of natural and constructed channels [3].
 (1)
(1)
 (2)
(2)
where A = cross-sectional area normal to the flow; Q = discharge; g = acceleration due to gravity; H = elevation of the water surface above a specified datum, also called stage; S0 = bed slope; Sf = energy slope; t = temporal coordinate and x = longitudinal coordinate. Equations (1) and (2) are solved using the well known four-point implicit box finite difference scheme [11].
3. Study Reach
In the context of flood scenario, the Mahanadi system can be broadly divided into two distinct reaches: 1) Upper Mahanadi (area upstream of Mundili barrage, intercepting a catchment of 132,100 sq·km), which does not have any significant flood problem 2) Lower Mahanadi (area downstream of Mundili barrage, intercepting a catchment of 9304 sq·km). The key area downstream of Hirakud up to Munduli intercepting a catchment of 48,700 sq·km is mainly responsible for flood havoc in the deltaic area of Mahanadi [12]. Figure 1 shows the details of catchments of Mahanadi Basin inside and outside of Odisha. In the present study, river reach in the Mahanadi system extending over a length of 106 km from Khairmal to Barmul is considered for analysis.
4. Geometric and Hydrologic Data
The channel geometry, upstream and downstream boundary conditions and channel resistance are required for conducting flow simulation through HEC-RAS. The crosssection data at 8 to 10 Kilometer intervals from Khairmal to Barmul extending over a length of 106 km were collected from the Department of Water Resources Odisha. The cross section data of the down stream catchment of Hirakud reservoir used for the present analysis was collected from the Department of Water Resources, Odisha, which was surveyed during 1997-1998 by Department of Water Resources, Odisha, for dam break analysis of Hirakud Dam and preparation of emergency action plan The flood hydrograph at Khairmal and the friction slope of the reach have been considered as up-stream and downstream boundary conditions respectively. The flood hydrograph at Barmul has been used for validation of the model.
5. Calibration of HEC-RAS Model for Manning’s Roughness Coefficient “n”
The data pertaining to the floods for years 2001 and 2003 have been used for calibration of Manning’s roughness coefficient “n”. In the present study, effort has been made to calibrate Manning’s roughness coefficient for single value using aforesaid data and subsequently, different values of “n” (from 0.04 to 0.025) have been used to justify their adequacy for simulation of flood in the study reach along the channel. Nash and Sutcliffe efficiency test [13] has been used for comparison of simulated flow hydrograph (computed using different Manning’s roughness coefficient “n”) with the observed flow hydrograph at Barmul gauging station where gauge discharge data is available. Table 1 shows the flood year, flow duration, name of gauging station and various single values of “n”
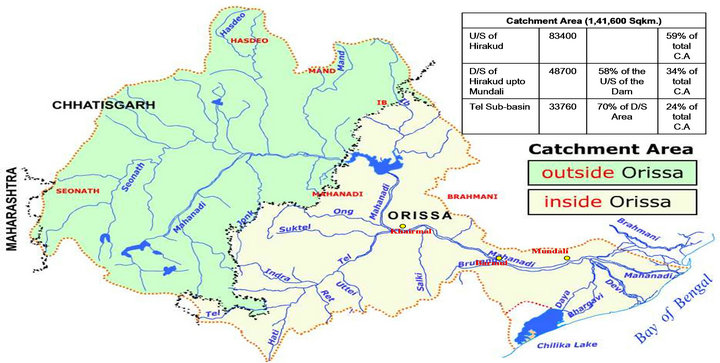
Figure 1. Details of catchments of Mahanadi system inside and outside of Odisha.
(from 0.04 to 0.025) used for model calibration. The comparison of observed and simulated flow hydrograph (calibration) at Barmul gauging station for Manning’s “n” value of 0.028 is also shown in Figure 2. From Table 1 it is clearly visible that for the flood of the year 2001 Manning’s “n” value of 0.03 yields maximum efficiency of 88.61 and that of 0.028 yields maximum efficiency of 89.21 for the flood year 2003.
6. Performance of Calibrated Model in Simulation of Flood for Year 2006
Taking the mean of the optimum Manning’s “n” values estimated for the flood years of 2001 and 2003, as 0.029 for the focus reach, HEC-RAS based model has been used to simulate the flood for year 2006. It is found from the simulation that Manning’s “n” value of 0.029 yields the maximum Nash and Sutcliffe efficiency of 92.39. Table 2 shows the simulated flood hydrograph at Barmul gauging station for various Manning’s “n” values. The comparison of observed and simulated flow hydrograph at Barmul gauging station for Manning’s “n” value of 0.029 is also shown in Figure 3.
Further, considering Manning’s “n” value as 0.029, the flood peak and time to peak for the flood year 2006 is computed and it is observed that there is a close agreement between the observed and computed values. Table 3 shows the comparison between the observed and computed values of the flood peak and time to peak for the flood year 2006 for different values of Manning’s “n”. It is clearly visible from Table 3 that the flood peak and time to peak estimated using Manning’s “n” value as 0.029 shows minimum percentage error.
In the above context, it shall be pertinent to mention that the Manning’s “n” value as detailed by Chow [14] lies between 0.025 to 0.035 for flood planes having short grasses and also for straight clean having no deep pools, which shows close resemblance with the channel characteristics of focus reach (Khairmal to Barmul) of Mahanadi River.
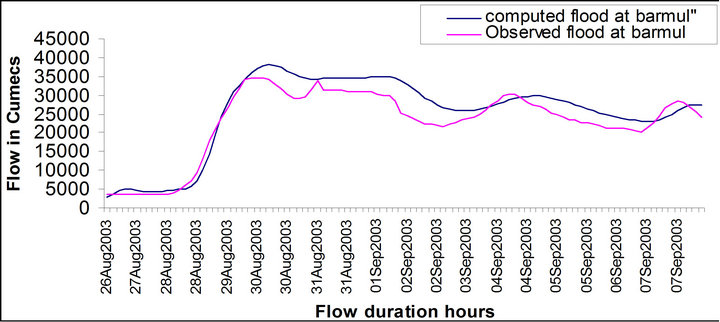
Figure 2. Observed and simulated flow hydrograph at Barmul (calibration) for flood year 2003 using Manning’s “n” value of 0.028.
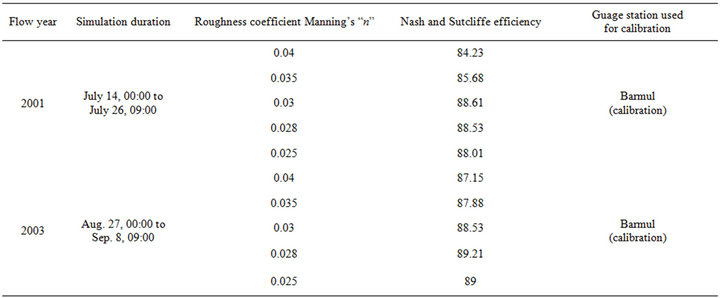
Table 1. Flow year, simulation duration, Manning’s “n” and gauge station used for calibration.
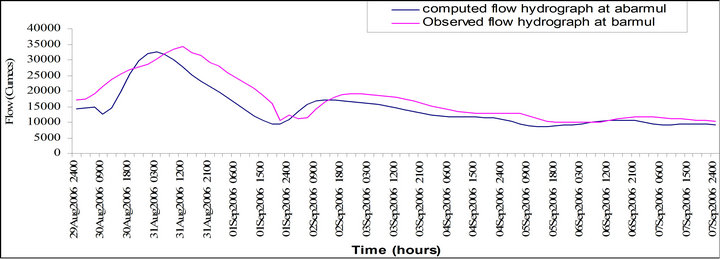
Figure 3. Observed and simulated flow hydrograph at Barmul (validation) for flood year 2006 for Manning’s “n” value of 0.029.
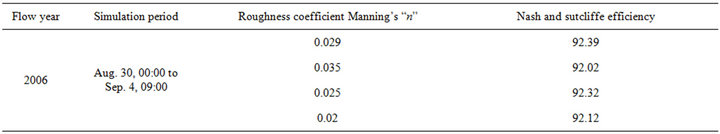
Table 2. Simulation period, Manning’s “n” and gauge station used for validation at Barmul.
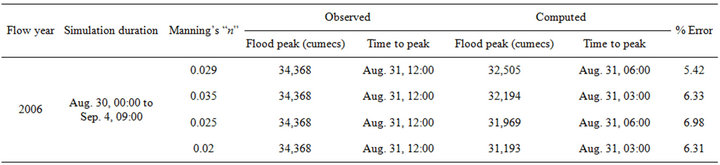
Table 3. Observed and computed values of flood peak and time to peak for different values of Manning’s “n”.
7. Conclusions
Based on the simulation study carried out for the down stream catchment of Hirakud Reservoir of Mahanadi River (Khairmal to Barmul reach) following conclusions can be summarized:
1) The most effective single Manning’s roughness coefficient calibrated (on flood data of the years 2001 and 2003) and validated (on flood data of the year 2006) for the Khairmal to Barmul reach of the Mahanadi River comes out to be 0.029.
2) The performance of calibrated and validated model has been verified using Nash and Sutcliffe (1970). A close agreement (92.39% efficiency) is seen between the simulated and observed flows at Barmul gauging station.
3) Furthermore, the calibrated Manning’s roughness coefficient of 0.029 also works best for the estimation of flood discharge peak and time to peak at Barmul reach of the Mahanadi River, as these values can be computed only with an error of 5.42% (compared with the observed flood data of the year 2006).
4) The calibrated Manning’s roughness coefficient value of 0.029 for the focus reach between Khairmal to Barmul of Mahanadi River having short grasses, straight and no deep pools can be further supported by the “n” value detailed by Chow [14] for flood planes having similar channel characteristics as above.
REFERENCES
- W.-M. Bao, X.-Q. Zhang and S.-M. Qu, “Dynamic Correction of Roughness in the Hydrodynamic Model,” Journal of Hydrodynamics, Vol. 21, No. 2, 2009, pp. 255-263. doi:10.1016/S1001-6058(08)60143-2
- R. Ramesh, B. Datta, S. Bhallamudi and A. Narayana, “Optimal Estimation of Roughness in Open-Channel Flows,” Journal of Hydraulic Engineering, Vol. 126, No. 4, 1997, pp. 299-303. doi:10.1061/(ASCE)0733-9429(2000)126:4(299)
- HEC-RAS, “User Manual,” US Army Corps of Engineers, Hydrologic Engineering Center, Davis Version 4.0, 2008.
- S. Patro, C. Chatterjee, S. Mohanty, R. Singh and N. S. Raghuwanshi, “Flood Inundation Modeling Using Mike Flood and Remote Sensing Data,” Journal of the Indian Society of Remote Sensing, Vol. 37, No. 1, 2009, pp. 107- 118. doi:10.1007/s12524-009-0002-1
- N. Usul and T. Burak, “Flood Forecasting and Analysis within the Ulus Basin, Turkey, Using Geographic Information Systems,” Natural Hazards, Vol. 39, No. 2, 2006, pp. 213-229. doi:10.1007/s11069-006-0024-8
- R. Vijay, A. Sargoankar and A. Gupta, “Hydrodynamic Simulation of River Yamuna for Riverbed Assessment: A Case Study of Delhi Region,” Environmental Monitoring Assessment, Vol. 130, No. 1-3, 2007, pp. 381-387. doi:10.1007/s10661-006-9405-4
- P. K. Parhi, R. N. Sankhua and G. P. Roy, “Calibration of Channel Roughness of Mahanadi River (India) Using HEC-RAS Model,” Journal of Water Resources and Protection, Vol. 4, No. 10, 2012, pp. 847-850. doi:10.4236/jwarp.2012.410098
- A. M. Wasantha Lal, “Calibration of Riverbed Roughness,” Journal of Hydraulic Engineering, Vol. 121, No. 9, 1995, pp. 664-671. doi:10.1061/(ASCE)0733-9429(1995)121:9(664)
- P. V. Timbadiya, P. L. Patel and P. D. Porey, “Calibration of HEC-RAS Model on Prediction of Flood for Lower Tapi River, India,” Journal of Water Resources and Protection, Vol. 3, No. 11, 2011, pp. 805-811. doi:10.4236/jwarp.2011.311090
- R. Doherty, “Calibration of HEC-RAS Models for Rating Curve Development in Semi Arid Regions of Western Australia,” AHA 2010 Conference, Perth, 2010.
- HEC-RAS, “Hydraulic Reference Manual,” US Army Corps of Engineers, Hydrologic Engineering Center, Davis Version 4.0, 2008.
- P. K. Mishra and S. Behera, “Flood Management Planning in the Mahanadi River Basin Odisha,” 7th International R&D Conference, Bhubaneswar, 4-6 February 2009, pp. 149-150.
- J. E. Nash and J. V. Sutcliffe, “River Flow Forecasting through Conceptual Models, Part I—A Discussion of Principles,” Journal of Hydrology, Vol. 10, No. 3, 1970, pp. 282-290. doi:10.1016/0022-1694(70)90255-6
- V. T. Chow, “Open Channel Hydraulics,” McGraw Hill Book Company, New York, 1959.