Spectral Analysis Review
Vol.05 No.02(2017), Article ID:76533,14 pages
10.4236/sar.2017.52002
Multi-Spectral and Fluorescence Imaging in Prevention of Overdose of Herbicides: The Case of Maize
Anicet K. Kouakou1,2, Adama P. Soro1, Alvarez K. Taky2, Koffi Patrice2, Jérémie T. Zoueu2*
1Laboratoire de Cristallographie et Physique Moléculaire, Université Félix Houphouët Boigny, Abidjan, Côte d’Ivoire
2Laboratoire d’Instrumentation Image et Spectroscopie, INP-HB, DFR-GEE, Yamoussoukro, Côte d’Ivoire

Copyright © 2017 by authors and Scientific Research Publishing Inc.
This work is licensed under the Creative Commons Attribution International License (CC BY 4.0).
http://creativecommons.org/licenses/by/4.0/


Received: March 13, 2017; Accepted: April 27, 2017; Published: April 30, 2017
ABSTRACT
Evaluation of the impact of herbicides on maize was done through multi- spectral and multi-modal imaging and multi-spectral fluorescence imaging combined with statistical methods. Spectra containing 13 wavelengths ranging from 375 nm to 940 nm were derived from multi-spectral images in transmission, reflection and scattering mode and fluorescence images obtained using high-pass filters (F450 nm, F500 nm, F550 nm, F600 nm, F650 nm) on control maize samples and maize samples treated with Herbextra herbicide were used. The appearance of the spectra allowed us to characterize the effect of the herbicide on the maize pigment concentration. The fluorescence images allowed us to track the fate of absorbed energy and through PLS-DA and SVM-DA to discriminate the two leaf categories with very low error rates for the test, i.e. 4.9% and 2% respectively. The results of this technique can be used in the context of precision agriculture.
Keywords:
Maize, Herbextra, Multi-Spectral Imaging, Multimodal Imaging, Fluorescence, PLS-DA, SVM-DA

1. Introduction
Maize (Zea mays) is an annual tropical herb plant of the grass family. It is a highly prized cereal for its many qualities and applications [1] . It adapts to all climates and latitudes. It is now present on five continents, through several varieties [2] . All over the world, breeders, to feed their animals, prefer maize in relation to any other food [3] . The success of maize is also due to its use for human food. It is an important cereal because it is the most dominating crop for biogas production [2] . It is a source of income for some school dropouts converted to farmers. In Côte d’Ivoire the annual production is about 764,000 t for the year 2016 according to [4] . This important cereal is prone to problems (water stress, overdose of herbicides and disease attacks, etc.). According to [5] at the level of the agricultural industry, the control of the state of health and the detection of the diseases in the plants are critical for a sustainable agriculture. The large-scale use of herbicides in maize production will attract our attention in this work.
Indeed the discovery of herbicides has been a relief for humanity in general but for the peasants in particular, allowing them to increase their area of exploitation. However, repeated use of herbicides has resulted in herbaceous species resistant to these products, leading to overdosage and to mixtures of products which do not often have the same active substance. Herbicides are biologically active and therefore intentionally toxic to target organisms. Because of their hazardous nature, the unintended contact of these substances with undesignated targets may cause serious problems for these targets [6] [7] . People are one of these involuntary targets because they are the applicators of these substances and also, consumers of food resources contaminated by residues of these products. Several scientific studies show the dangerous effects of herbicides on the health of populations [8] [9] [10] .
Thus understanding the action of these products on photosynthetic constituents could help to combat the overdosage of these products. Several methods exist for monitoring the health of plants [5] [11] [12] and are based on the interaction between light and matter. Multi-spectral imaging [13] [14] [15] and fluorescence [16] [17] [18] have also shown their ability to monitor the health of plants and to discriminate against certain diseases. We combine these two techniques to discriminate two types of maize plant (healthy and treated with herbicide plants) to predict the physiological state of a new database and especially to understand the impact of the herbicide on the physiology of the plant. To support this classification two statistical techniques are used: Partial least squares discriminant analysis (PLS-DA) is a linear classification technique based on the methods of regression by least square and the properties of discriminations [19] . It is a technique that has been used in several research domains [20] [21] for the classification of data. The support vector machines (SVM) [22] [23] are based on a Lagrangian optimization method under linear inequalities constraints. They represent a supervised learning technique like neural networks. The original aim of SVM is to discriminate complex regions in a robust binary framework or classification. Developed in 1995 by Vladimir Vapnik, SVM have quickly become one of the references in data processing [19] [24] .
2. Materials and Methods
2.1. Plant Material and Experimental Design
The experiment was carried out in the laboratory of instrumentation image and spectroscopy at the Institut National Polytechnique Houphouët-Boigny (INP- HB, Yamoussoukro, Cote d’Ivoire). In a greenhouse, seeds of corn were sown in pots containing a sterilized soil. Each pot contained three corn seeds. At the four-leaf stage, a portion of the maize plants were treated with HERBEXTRA (2, 4-D amine salt 720 g/l, SL), a selective herbicide acting on a large number of weeds. This herbicide is class III and harmful according to the FAO/WHO classification.
2.2. Preparation of Herbicide Dose
The treatment solution was prepared following the manufacturer’s instructions. Thus 8 ml of the 2,4-D amine salt 720 g/l were taken and mixed with 2 l of water in a high pressure sprayer. After homogenization of this mixture, the treatment is carried out on part of the young maize plants. The leaves of the plants treated with the herbicide and the leaves of the untreated plants (healthy leaves) are collected for measurements.
2.3. Optical Instrumentation
2.3.1. Multi-Spectral Microscope I
The multi-spectral and multimodal microscope is a microscope constructed from a commercial microscope (Brunel Metallurgical microscope, model SP80), in which all conventional sources were replaced by LEDs [25] [26] [27] . The mechanical eyepieces have also been replaced by a monochrome camera CMOS 12-bit (2592 × 1944, Guppy-503B, Vision Allied Technology, with a sensor of MT9P031 micron/Aptina) with pixels of size 2.2 μm × 2.2 μm, used for image acquisition. The system acquires 13 images per mode of the same scene using an acquisition card (NI-DAQ) connected to a computer, which allows to control the intensity of the LEDs.
2.3.2. Multi-Spectral Microscope II
1) Hardware
The new motorized microscope consists of following components (Figure 1):
a) Camera
Indeed, the used enclosed digital Lumenera lt225M, camera has a pixel size of 5.5 × 5.5 μm. It has a high resolution 2/3 CMOSIS CMV2000 sensor with a fully
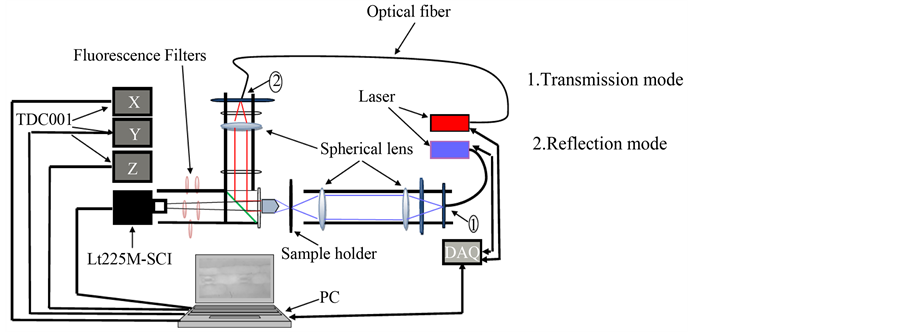
Figure 1. Scheme of the experimental device.
electronic global shutter. It uses the USB 3.0 technology with selectable 8 or 12-bit pixel data. That means it is very fast. The full resolution that can be reached is 1088 × 2048 with 2.2 MP. The maximum frame rate is 170 fps (frames per second). The camera has an exposure time range from 0 to 4 s.
b) Objective
In order to increase the size of viewed objects, we used a plan objective which is OLYMPUS NIKON NEOFLUAR 40/0.7. The use of this kind of objective is recommended when we need to see objects with more details is. But that objective undergoes chromatic aberration that makes the distance of found best-in- focus image related to a wavelength.
c) Laser and Data Acquisition Card (DAQ)
The sample is illuminated by lasers of wavelength 405 nm in transmission and 650 nm in reflection. Each wavelength can be used in transmission and also in reflection at any moment without modifying the system. A beam splitter is used between the objective and the camera. Its goal is to divide the beam put in reflection into two half parts: the first is obtained when the laser beam changes its direction after meeting the beam splitter so it interacts with the sample and the second half part is lost. Each output of lasers controllers meets optical densities whose goal is to reduce the power of used lasers. The lasers are controlled by a data acquisition card (DAQ) from National Instruments (USB 6008). Fibers are used in each mode to conduct the light from the source to the sample. Finally, a diffuser is used in order to homogenize the light coming from both lasers sources to the sample. The use of this component is helpful to reduce the speckle from lasers but move it can improve the level of speckle killing [28] . That experiment will not be discussed in this work.
d) Servo-controllers
The moving of the sample in X, Y and Z directions is done using three motors from THORLABS. Those motors are controlled using TDC001 servo-controllers. They have a shaft-distance of 25 mm (0 to 25 mm) with a minimum step of 0.5 µm. Servo-controllers used are very compact footprints with 2.4 × 2.4 × 1.8. They can control motors from 12 to 15 v up to 2.5 w.
All components quoted above are combined together to build a very compact microscope equipped with two different modes: transmission and reflection. The built microscope is very flexible and easy to handle. It is also possible to use this system for fluorescence measurements. To achieve it, we put between the camera and the objective five high-pass-filters namely, 450 nm, 500 nm, 550 nm, 600 nm, 650 nm.
B) Software
After that, easy software is designed to monitor the entire motorized microscope using MATLAB r2014a. With this software, it is possible to get the best-in- focus image, control the lasers and also the camera.
2.4. Data Analysis
2.4.1. Multi-Spectral and Multi-Modal Imaging
The images analyzed account for the spatial dimension and the spectral space represents the spectral dimension, i.e. a three dimensional space. From these microscopic images, we try to evaluate the action of the herbicide on the pigment concentration of maize leaves. In the image space, each object is characterized by a distribution of the intensity of the pixels. The objects are observed according to 13 wavelengths which are the variables. The average of the pixels is carried out according to each wavelength and a representation of the intensity as a function of the wavelengths is made subsequently to follow the behavior of each category of plant leaf.
2.4.2. Multi-Spectral Fluorescence Imaging
With an excitation source at 405 nm, we used five high-pass filters for each sample. Since the number of filters is greater than 3, we face a problem of multidimensional statistics. Fluorescence is the remission of part of the energy absorbed by chlorophyll molecules that initiate photosynthesis reactions. It is therefore in competition with the energy used in the mechanisms of regulation of photosynthesis. We monitor the intensity of the fluorescence as a function of the filters in order to understand the fate of the light intensity absorbed. Since the intensity of fluorescence is different at the two groups of leaves and also according to the filters, a model for the distinction of the leaves is required. Partial Least Squares Discriminant Analysis (PLS-DA), a linear classification method [19] derived from the PLS regression algorithm is used to discriminate samples through scores and latent variables coefficients. This technique consists in searching for latent variables (linear combination of the starting variables) having a strong covariance with the dependent variables [29] [30] . The variability of the database is carried by these latent variables in descending order. Thus, the first latent variable carries the maximum of information while the second carries the variance not expressed by the first and so on. Our database is composed of two groups, coded as [1 0] and [0 1] for classes 1 (healthy leaves) and 2 (leaves with Herbextra). The value 1 indicates the belonging of the samples to the group and 0 otherwise. The belonging of an element to a group is determined by a threshold, determined for this group by the Bayes theorem [19] [31] . Before calibrating the model, the obtained fluorescence images are processed using the histogram. The boxplot is used as a pretreatment method to detect the presence of outliers. SVM-DA, an extensive margin separation method [22] [23] [32] known as a nonlinear classification method [33] was used to support the discrimination proposed by the first method. The database used for this work was randomly divided into two groups: one group for training and another for testing. The distribution of these data is summarized in Table 1. For the validation of the models

Table 1. Details of samples used for classification.
proposed by these two statistical methods, parameters such as sensitivity, specificity, error ratio and accuracy are proposed by Ballabio et al. and Shrestha et al. These are defined as follows:
 (1)
(1)
 (2)
(2)
 (3)
(3)
 (4)
(4)
where TP (true positive) is the number of samples correctly classified in their respective group, FN is false negative samples, TN is the true negative and FP is false positive. Sensitivity is the ability of the model to correctly identify samples group, whereas the specificity is the capacity to reject the samples of others group.
3. Results and Discussion
3.1. Results
3.1.1. Multi Spectral Data
We imaged 40 leaves of maize (20 healthy leaves and 20 leaves treated with Herbextra) with multi-spectral microscope I. The microscopic images allow us to distinguish the modes of transmission, reflection and scattering (Figure 2). Observation of these images reveals a difference between the healthy leaves and the leaves with the herbicide.
The difference between these two types of leaves is observed at the biochemical level. Indeed, whatever the mode, one sees a structural disorganization and deformation of the elements inside the leaves treated with the herbicides. This

Figure 2. Images of healthy maize leaves (a), maize leaves treated with Herbexra (b) taken for the three angular modes (a1, b1 for transmission), (a2, b2 for reflection) and (a3, b3 for scattering).
structural difference of the healthy and treated leaves is revealed by the optical properties across the spectrum of these leaves (Figure 3). Both leaves have a light transmission, reflection and scattering variation in terms of intensities from ultraviolet to near infrared according to 13 wavelengths used.
3.1.2. Fluorescence Data
The multi-functional microscope II allowed us to acquire fluorescence images of maize leaves with a set of filters F450, F500, F550, F600, F650 (Figure 4). Thus, each sample of leaves is represented by five images. Here we present the image of those leaves for F650, from day one up to day four. We see again a deformation of some elements in the leaves image with herbextra. However, a simple visual analysis does not allow us to distinguish completely our different samples. Two statistical methods are used to classify our database.
1) PLS-DA
Before establishing the model some parameters must be determined. This is

Figure 3. Spectra of the three phenomena: transmission (a), reflection (b), scattering (c).

Figure 4. Fluorescence image of healthy maize leaf (a) and maize treated with Herbextra (b) with F650: Day one up to Day four.
the case for the number of latent variables (LV). In our work we use four LV because the error is relatively small (0.018) (Figure 5) and these four LV express 99.81% of the variability of our database with 98.83% for the first two. The coefficients of the latent variables allow us to see the influence of the starting variables on the new variables (not displayed). After modeling the classification of a new database allows us to judge the reliability of the model (Figure 6). Thus all treated leaves are well classified. Only a few healthy leaves are misclassified. The performance of the model is presented in Table 2.
In Figure 6, the threshold according to the Bayes Theorem is set at −0.038 for the healthy leaves (left) and 0.038 for the leaves with herbicide (right).
3) SVM-DA
Since our problem in this study is not linearly separable, we used the Gaussian
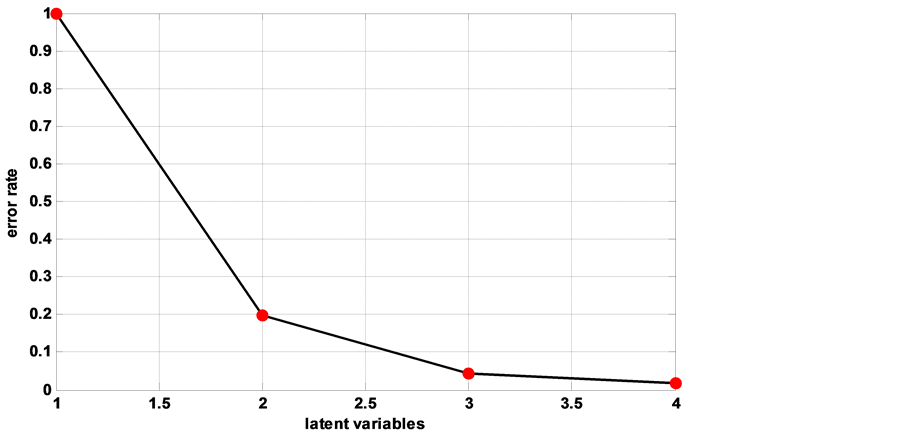
Figure 5. Choice of the number of latent variables.

Figure 6. Prediction results of test set for maize leaf by PLS-DA.
Table 2. Classification error rate, accuracy, sensitivity and specificity for the two models.
function as a kernel function for data separation. The parameters of this function are chosen optimally, i.e. the choice is based on the minimization of the misclassification error. Thus the kernel width is maintained at 0.96 and the cost or constraint factor is set to 100. The model contains 44 support vectors used to determine the separation lines of the two groups. The model is very stable in the classification of the two groups of samples with relatively low error percentages (Table 2). Figure 7 shows the distance of each sample at the boundary of its group for training and testing. Our SVM-DA classifies the data with a very low classification error rate.
3.2. Discussion
The spectral signatures of our samples are all the same in each mode. However, in terms of intensity, in transmission the maize leaf with the herbicide transmits more light than the healthy corn leaf and that over the entire spectrum of the visible (400 nm - 700 nm). The interaction between the molecules of herbicide and the biochemical constituents of leaf generated the modification of the form of these constituents, creating a deformation of these at the microscopic level. These modifications show that plants produce some compounds to fight again external elements. This struggle for life is the base of deformation and change in optical properties. So this high transmission therefore demonstrates a weakness of the photosynthetic apparatus in the leaves with the herbicide linked to a low concentration of chlorophyll (Chl). Some studies show that stress can lead to a decrease in chlorophyll [34] . This decline in the level of chlorophyll (primary pigment) allows certain secondary pigments (carotenoids, anthocyanin) [35] to appear even during the growth phase of the plants. This is characterized by yellowing and wilting of these leaves. The healthy leaves exhibit a lower transmission spectrum between 400 nm and 500 nm and at 660 nm the absorption zone of photosynthetic pigments (Chl a, Chl b and carotenoids) [36] , allowing them to synthesize their organic matter necessary for their development. At the level of the reflection mode, it is observed that the control maize has reflection intensity higher than the leaves with herbextra between 500 nm and 600 nm but at 660 nm and in the near IR and IR there is an inversion of evolution of the intensities. This change of situation reveals a chlorophyll anemia of the leaf which is manifested by a growth of the reflectance spectrum.
Healthy corn leaves diffuse less light than leaves treated with the herbicide at

Figure 7. Distance from each sample to the group boundary for training and testing.
590 nm and between 700 nm - 940 nm bound to the biochemical content of these leaves. The diffusion of the leaves is related to the variation of refractive index at the level of the leaf (air, water, etc.) [37] . This index variation translated by a high diffusion spectrum at 590 nm and 700 nm to 940 nm for the leaves under treatment may be related to the presence of the 2,4-D molecules in the mesophilic tissue creating additional layers at the base of the disorganization of the pigment concentration of the leaves. It may also be related to the geometry of the leaf, the physicochemical and optical properties (transmission, absorption, and reflection) [13] .
Also, after the excitation phase of the leaf any non-transmitted or reflected energy is absorbed. Plants use this absorbed energy to make their organic matter through photosynthesis. The intensities of the fluorescence images show here that much of the energy absorbed by leaves treated with the herbicide is emitted in the form of fluorescence (chlorophyll fluorescence). Plant resistance responses to exterior attack commonly involve the accumulation of specific compounds with either signaling or antimicrobial properties. The latter can include structural modifications [18] . Among these compounds, some have fluorescence property and provide a way to reveal stress symptom. In fact Herbextra is the major part of stress caused by herbicides, blocking the passage of the electron from the primary quinone (QA) to the secondary quinone, which maintains the special chlorophylls (P680) in a state where they can’t receive energy (closed centers) [38] from photosynthetic antennas, thus increasing the emission of absorbed energy in the form of heat and fluorescence [35] [36] [38] . This high dissipation of the absorbed energy in the form of fluorescence is revealed in the F600 and F650 filters with the leaves treated with Herbextra. These filters being close to the absorption and reabsorption zone of chlorophyll a and this fluorescence intensity confirm the inability of chl a, to reabsorb the energy [17] . This low reabsorption for the leaves with the herbicide confirms the low level of chlorophyll. The combination of filters allows us to follow the intensity of the fluorescence images and to understand the speed of transport of the absorbed energy towards the photosynthetic antennas (PSII, PSI). The fluorescence intensity at the level of the healthy leaves is low due to the attenuation of the fluorescence by the photosynthesis (quenching). The high pigment concentration thus allows an efficient transport of the energy towards the photosystems. This pigmentary proximity is reduced here at the level of the maize plants under herbicidal treatment. An overdose of herbicide can then contribute to the placing of undesirable and harmful gene in the fruits consumed by the consumers. The distinction made between these two types of leaves is supported by the results of the established models. Indeed the two models reveal a perfect distinction between the two samples with relatively low error rates. The results from these models show the potential of multi-spectral fluorescence imaging as a means of discriminating leaves that do not have the same health status.
4. Conclusion
Our approach in this work allowed us to see that the combination of multi- spectral and multimodal imaging and fluorescence imaging is an effective asset in the diagnosis of the use of herbicides on plants. These two methods allowed us to see on the one hand the spectral behavior of the plants under treatment of herbextra and the effect of the latter on the amount of chlorophyll in the plants through the transmission, reflection and diffusion spectra. On the other hand, the fluorescence imaging allowed us to follow the fate of the energy absorbed by the plant and the rate of transmission of this energy to the reaction center. This transmission rate could thus be an important asset in the diagnosis of a stress situation in the plant. The models show the potential of VSM-DA and PLS-DA in data discrimination. One of the perspectives of this work will be to study the impact of water stress on herbicide treated plants due to the disturbance of rainfall due to climate change.
Acknowledgements
We would like to thank the International Science Program (ISP) and TWAS for financing the project.
Cite this paper
Kouakou, A.K., Soro, A.P., Taky, A.K., Patrice, K. and Zoueu, J.T. (2017) Multi-Spectral and Fluorescence Imaging in Prevention of Overdose of Herbicides: The Case of Maize. Spectral Analysis Reviews, 5, 11-24. https://doi.org/10.4236/sar.2017.52002
References
- 1. Abdulai, A.-N. and Abdulai, A. (2016) Examining the Impact of Conservation Agri- culture on Environmental Efficiency among Maize Farmers in Zambia. Environ- ment and Development Economics, 22, 177-201.
https://doi.org/10.1017/S1355770X16000309 - 2. Amon, T., Amon, B., Kryvoruchko, V., Zollitsch, W., Mayer, K. and Gruber, L. (2007) Biogas Production from Maize and Dairy Cattle Manure—Influence of Biomass Composition on the Methane Yield. Agriculture, Ecosystems & Environment, 118, 173-182.
- 3. Govind, K.C., Karki, T.B., Shrestha, J. and Achhami, B.B. (2015) Status and Prospects of Maize Research in Nepal. Journal of Maize Research and Development, 1, 1-9.
https://doi.org/10.3126/jmrd.v1i1.14239 - 4. http://www.fao.org/giews/countrybrief/country/CIV/pdf/CIV.pdf
- 5. Sankaran, S., Mishra, A., Ehsani, R. and Davis, C. (2010) A Review of Advanced Techniques for Detecting Plant Diseases. Computers and Electronics in Agriculture, 72, 1-13.
- 6. Multigner, L. (2005) Effets retardés des pesticides sur la santé humaine. Environ- nement, Risques & Santé, 4, 187-194.
- 7. Benachour, N. and Gilles-Eric, S. (2009) Glyphosate Formulations Induce Apop- tosis and Necrosis in Human Umbilical, Embryonic, and Placental Cells. Chemical Research in Toxicology, 22, 97-105.
https://doi.org/10.1021/tx800218n - 8. Anger, J.-P. and Kintz, P. (2009) Difficultés analytiques de la caractérisation des pesticides dans le sang. Annales de Toxicologie Analytique, 21, 131-141.
- 9. De Jaeger, C., Voronska, E., Fraoucene, N. and Cherin, P. (2012) Exposition chro- nique aux pesticides, santé et longévité. Role de notre alimentation. Médecine & Longévité, 4, 75-92.
- 10. Kouadio, D.L., Ehouman, S.G.A., Soro, B.D., Diarra, M., Doumbia, M.L., Meite, L., Mamadou, K., Dembele, A. and Traoré, S.K. (2014) Contamination du lait caillé et de l’Iuf consommé en Cote d’Ivoire par des pesticides organochlorés. Afrique Science, 10, 61-69.
- 11. Silva, A.J.D., Nascimiento, C.W.A.D., Gouveia-Neto, A.D.S. and Silva Jr., E.A.D. (2012) LED-Induced Chlorophyll Fluorescence Spectral Analysis for the Early Detection and Monitoring of Cadmium Toxicity in Maize Plants. Water, Air, & Soil Pollution, 223, 3527-3533.
https://doi.org/10.1007/s11270-012-1130-8 - 12. Dibi, W.G., Fotso, B., Brou, C.Y., Zoueu, J.T., Zeze, A. and Bosson, J. (2016) Fluo- rescence and Reflectance Spectroscopy for Early Detection of Different Mycorrhized Plantain Plants. Applied Physics Letters, 8, 17-31
- 13. Sangare, M., Agneroh, T.A., Bagui, O.K., Traore, I., Ba, A. and Zoueu, J.T. (2015) Classification of African Mosaic Virus Infected Cassava Leaves by the Use of Multi-Spectral Imaging. Optics and Photonics Journal, 5, 261-272.
https://doi.org/10.4236/opj.2015.58025 - 14. Kouakou, A.K., Bagui, O.K., Agneroh, T.A., Soro, A.P. and Zoueu, J.T. (2016) Cucumber Mosaic Virus Detection by Artificial Neural Network Using Multispectral and Multimodal Imagery. Optik—International Journal for Light and Electron Optics, 127, 11250-11257.
- 15. Sangare, M., Tekete, C., Bagui, O.K., Ba, A. and Zoueu, J.T. (2015) Identification of Bacterial Diseases in Rice Plants Leaves by the Use of Spectroscopic Imaging. Applied Physics Letters, 7, 61.
https://doi.org/10.5539/apr.v7n6p61 - 16. Ndao, A.S., Konte, A., Biaye, M., Faye, M.E., Fayeand, N.A.B. and Wagué, A. (2005) Analysis of Chlorophyll Fluorescence Spectra in Some Tropical Plants. Journal of Fluorescence, 15, 123-129.
https://doi.org/10.1007/s10895-005-2519-1 - 17. Buschmann, C., Langsdorf, G. and Lichtenthaler, H.K. (2000) Imaging of the Blue, Green, and Red Fluorescence Emission of Plants: An Overview. Photosynthetica, 38, 483-491.
https://doi.org/10.1023/A:1012440903014 - 18. Lenk, S., Chaerle, L., Pfündel, E.E., Langsdorf, G., Hagenbeek, D., Lichtenthaler, H.K., Straeten, D.V.D. and Buschmann, C. (2007) Multispectral Fluorescence and Reflectance Imaging at the Leaf Level and Its Possible Applications. Journal of Experimental Botany, 58, 807-814.
https://doi.org/10.1093/jxb/erl207 - 19. Ballabio, D. and Consonni, V. (2013) Classification Tools in Chemistry. Part 1: Linear Models. PLS-DA. Analytical Methods, 5, 3790-3798.
https://doi.org/10.1039/c3ay40582f - 20. Barker, M. and Rayens, W. (2003) Partial Least Squares for Discrimination. Journal of Chemometrics, 17, 166-173.
https://doi.org/10.1002/cem.785 - 21. Shrestha, S., Deleuran, L.C. and Gislum, R. (2016) Classification of Different Tomato Seed Cultivars by Multispectral Visible-Near Infrared Spectroscopy and Chemometrics. Journal of Spectral Imaging, 5, Article ID: a1.
https://doi.org/10.1255/jsi.2016.a1 - 22. Xu, Y., Zomer, S. and Brereton, R.G. (2006) Support Vector Machines: A Recent Method for Classification in Chemometrics. Critical Reviews in Analytical Chemistry, 36, 177-188.
- 23. Cortes, C. and Vapnik, V. (1995) Support-Vector Networks. Machine Learning, 20, 273-297.
https://doi.org/10.1007/BF00994018 - 24. Xie, L., Ying, Y. and Ying, T. (2009) Classification of Tomatoes with Different Genotypes by Visible and Short-Wave Near-Infrared Spectroscopy with Least- Squares Support Vector Machines and Other Chemometrics. Journal of Food Engineering, 94, 34-39.
- 25. Merdasa, A., Brydegaard, M., Svanberg, S. and Zoueu, J.T. (2013) Staining-Free Malaria Diagnostics by Multispectral and Multimodality Light-Emitting-Diode Microscopy. Journal of Biomedical Optics, 18, Article ID: 036002.
https://doi.org/10.1117/1.JBO.18.3.036002 - 26. Zoueu, J.T. and Tokou, S. (2012) Trophozoite Stage Infected Erythrocyte Contents Analysis by Use of Spectral Imaging LED Microscope. Journal of Microscopy, 245, 90-99.
https://doi.org/10.1111/j.1365-2818.2011.03548.x - 27. Agnero, M.A., Zoueu, J.T. and Konan, K. (2016) Characterization of a Multimodal and Multispectral Led Imager: Application to Organic Polymer’s Microspheres with Diameter Φ = 10.2 μm. Optics and Photonics Journal, 6, 171-183.
https://doi.org/10.4236/opj.2016.67019 - 28. Fergal, P.S. (2012) Speckle Reduction in Laser-Illuminated Picoprojectors. Proceedings of SPIE 8252, MOEMS and Miniaturized Systems XI, 825206.
- 29. Wold, H. (1966) Estimation of Principal Components and Related Models by Iterative Least Squares. In: Krishnaiah, P.R., Ed., Multivariate Analysis, Academic Press, New York.
- 30. Kumar, K., Bairi, P., Ghosh, K., Kumar Mishra, K. and Mishra, A.K. (2014) Classification of Aqueous-Based Ayurvedic Preparations Using Synchronous Fluo- rescence Spectroscopy and Chemometric Techniques. Current Science, 107, 470- 477.
- 31. Pérez, N.F., Ferre, J. and Boqué, R. (2009) Calculation of the Reliability of Classification in Discriminate Partial Least-Squares Binary Classification. Chemometrics and Intelligent Laboratory Systems, 95, 122-128.
- 32. Liang, H.L.Y. and Xu, Q. (2009) Support Vector Machines and Its Applications in Chemistry. Chemometrics and Intelligent Laboratory Systems, 95, 188-198.
- 33. Brereton, R.G. and Lloyd, G.R. (2010) Support Vector Machines for Classification and Regression. Analyst, 135, 230-267.
https://doi.org/10.1039/B918972F - 34. Govindjee, D.K. (2004) Discoveries in Oxygenic Photosynthesis (1727-2003): A Perspective. Photosynthesis Research, 80, 15-57.
https://doi.org/10.1023/B:PRES.0000030443.63979.e6 - 35. Féret, J.B. (2009) Mesures Physiques en Télédétection. école Doctorale des Sciences de l’Environnement d’Ile de France, Université Pierre Marie Curie.
- 36. Jacquemoud, S. and Ustin, L.S. (2008) Modeling Leaf Optical Properties.
http://photobiology.info/Jacq_Ustin.html - 37. Fabrice, D. (2010) Contribution à la télédétection passive de la fluorescence chlorophyllienne des végétaux. Ecole Polytechnique, Paris Tech.
- 38. Krause, G.H. and Weis, E. (1991) Chlorophyll Fluorescence and Photosynthesis: The Basics. Annual Review of Plant Physiology and Plant Molecular Biology, 42, 313-349.
https://doi.org/10.1146/annurev.pp.42.060191.001525