Spectral Analysis Review
Vol.04 No.03(2016), Article ID:70373,18 pages
10.4236/sar.2016.43003
Variation of the Observed Widths of La I Lines with the Energy of the Upper Excited Levels, Demonstrated on Previously Unknown Energy Levels
L. Windholz, B. Gamper, T. Binder
Institut für Experimentalphysik, Technische Universität Graz, Graz, Austria

Copyright © 2016 by authors and Scientific Research Publishing Inc.
This work is licensed under the Creative Commons Attribution International License (CC BY 4.0).
http://creativecommons.org/licenses/by/4.0/


Received: August 4, 2016; Accepted: September 3, 2016; Published: September 6, 2016
ABSTRACT
We performed systematic laser spectroscopic investigations of La I spectral lines, using optogalvanic detection. Sixteen previously unknown even parity levels, having energies between 40,300 and 44,300 cm−1, are reported. These levels classify altogether 67 lines, not listed in spectral tables. The new levels were found due to the observation of the depopulation of the lower levels of the excited transitions. We found a remarkable variation of the observed widths of single hyperfine structure components dependent on the energy of the upper excited levels. Some levels having energies higher than 43,000 cm−1 appear to have a very high ionization probability.
Keywords:
New Energy Levels of Lanthanum I, Hyperfine Structure, Line Widths

1. Introduction
Natural lanthanum (La), atomic number 57, is composed of two isotopes, a long-lived radioactive isotope 138La (natural abundance 0.09%) with a half-life of 1.05 × 10¹¹ years [1] and a stable isotope 139La (natural abundance 99.91%). These isotopes have nuclear spin quantum numbers 5 [2] and 7/2 [3] , respectively. The electronic ground state configuration is [Xe] 5d1 6s2, and the ground state is 2D3/2. All investigations in this paper were performed on natural isotope mixture, thus we could notice only the isotope 139La, which has a magnetic dipole moment µI = 2.7830455(9) µN and a small electric quadrupole moment Q = 0.20(1) × 10−28 m2 [4] . The hyperfine (hf) structure of La spectral lines was investigated by several authors. For an overview, we refer to our preceding papers on La [5] - [8] , in which the interest was focused on the discovery of previously unknown energy levels. During evaluation of the recoded spectral lines, we noticed a strong dependency of the line width on the energy of the upper excited level, found while fitting the observed structures.
In this work all wavelengths are given in standard air in the unit Å. Conversion to wave numbers (which are valid in vacuum) was made using the formula for the refraction index of air given by Peck and Reeder [9] . The standard uncertainties given in this paper are related to the last digit of the given value. E.g. −467(5) means −467 ± 5, 149.9(32) means 149.9 ± 3.2 and so on.
2. Experiment and Finding of New Energy Levels
As in the preceding works, Doppler-limited laser spectroscopy was performed in order to investigate weak La I lines, not previously reported. The spectra were recorded using optogalvanic (OG) detection, and laser-induced changes of the intensity of fluorescence lines were used to identify the involved energy levels.
We used a hollow cathode lamp as described by Guthöhrlein et al. [10] to produce free La atoms. A sketch of the see-through electrode arrangement is shown in Figure 1. The inner wall of the cathode was made from Lanthanum. The lamp was filled with Ar (or sometimes Ne) at a pressure of 0.2 - 0.5 mbar. Applying a voltage of several hundreds V, the discharge started in Ar (or Ne, respectively). Using a power unit in constant current mode, we increased the voltage until a current of 90 mA was obtained. At the beginning we could see relatively weak discharge light of the typical color of Ar (blue-gray). After a few minutes, a sputtering process sets free more and more La atoms from the inner wall of the cathode. These La atoms take part in the discharge. Since the ionization limit of La (given as 44,981 cm−1 in ref. [11] ) is much lower than that of noble gases, the discharge current is driven more and more by La atoms. The discharge light becomes very bright and now has a fairly white color (the entire process is comparable with the well-known starting process of a low-pressure Na lamp). Simultaneously, the discharge current noise becomes very low, which makes the discharge itself an ideal detector for resonance of the laser light frequency with transition frequencies of Ar or La atoms or ions. The entire lamp was cooled with liquid nitrogen. This cooling increased the sputtering efficiency, reduced the Doppler width of the spectral lines, and reduced the current noise. The experiments described here were undertaken over a long time span (2012-2014), but we assume that the properties of the discharge were more or less always the same.
The experimental set-up is shown in Figure 2 and was described in detail in refs. [5] - [8] . The light of a tunable dye laser passes through the hollow cathode lamp. Recorded was the change of the voltage drop on the resistor versus the change of the laser frequency. Our cw ring dye laser could be tuned continously over up to 45 GHz (1.5 cm−1). Since the investigated hollow cathode plasma emits all spectral lines by itself, for laser-induced fluorescence (LIF) detection it was necessary to distinguish between processes induced by laser light and discharge processes. This was done by modulating
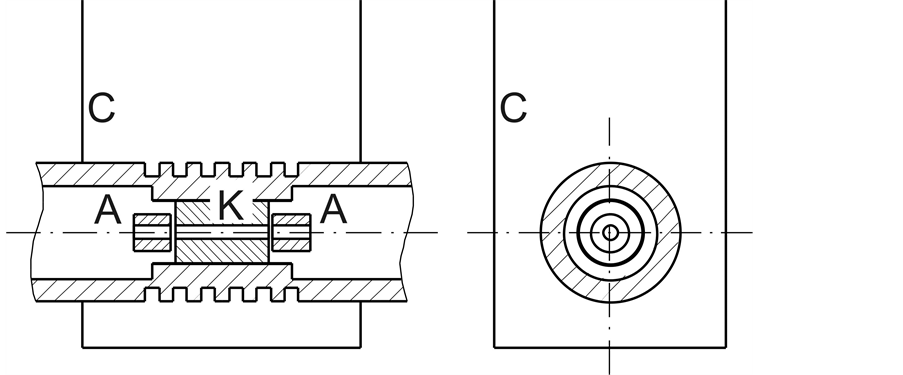
Figure 1. Sketch of the hollow cathode lamp. A: anodes (at high voltage); K: cathode (grounded), inner wall made from La; C: container for liquid nitrogen. The ceramic holders for the anodes are not shown.
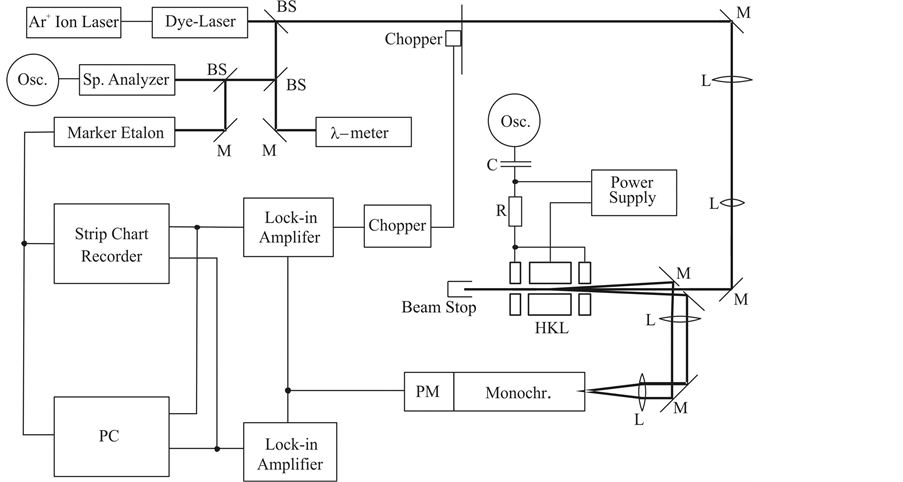
Figure 2. Experimental setup. BS: beam splitter, M: mirror, L: lens, PM: photo multiplier, C: capacitor, R: resistor, HKL: hollow cathode lamp.
the laser light by a mechanical chopper and detecting the laser-induced changes with help of a Lock-In amplifier. When recording the change of the voltage drop on the resistor as a function of laser frequency, we obtained the so-called OG spectra. We recorded systematically such OG spectra in the wavelength range 5600 - 6100 Å for finding previously unknown lines, which could lead to new energy levels.
In case of low discharge noise, the optogalvanic detection method is very sensitive, and we observed in the mentioned range more than 1800 spectral lines, from which we could classify approximately 800 lines as transitions between already known energy levels (for comparison, in the MIT tables [12] there are only 97 lines of La I and La II listed between 5600 - 6100 Å). More than 1000 lines could not be explained at that time, but subsequently we were able to find at least some of the missing energy levels.
Despite of the good sensitivity, the OG spectra only give information on the existence of a line, its wavelength and its hyperfine structure, but no information on the energy of the involved levels. Moreover, for elements with a high number of energy levels, such as La, the probability that two or several transitions between different pairs of combining levels that have accidentally the same transition wave number is relatively high. Thus in the OG spectra quite frequently so called blend situations are observed, where the hf compoments of different lines contribute to the observed signal.
The information about the levels involved in a transition can be obtained if laser- induced fluorescence lines are observed. Thus we dispersed the light emitted by the discharge with help of a monochromator and searched for fluoresence lines (by tuning the transmission wavelength of the monochromator, between 2000 and 8000 Å), while the laser frequency was set to the highest peak of an unclassified structure in an OG spectrum. When the upper level emits LIF lines it is possible to identify the level under assumption that the lower levels of the fluorescence lines are already known. In such cases, since the laser light increases the population of the upper excited level, a LIF signal on the Lock-In amplifier is in phase with the exciting laser light (“positive” fluorescence). But due to the high collision rate in the hollow cathode plasma it is practically impossible to observe such LIF lines from levels having energies higher than 40,000 cm−1.
On the other hand, the transition excited by laser light depopulates the starting lower level of the investigated line. If now this level―in case of La I an odd level―combines with a level of the (metastable) even ground state configuration, the intensity of the corresponding strong spectral line decreases when the laser light is on. This gives a LIF signal which has opposite phase compared to the exciting laser light, and we call it “negative” fluorescence.
All levels found in the present investigation were found by detecting “negative” LIF lines. These lines marked the excited lower level and we found the energy of the new level by adding the transition wave number to the level energy. The existence of the new level was then checked by trying to excite a transition from another known lower level. If the transition could be noticed in an OG scan (for this we investigated also lines in the spectral range 6200 - 6900 Å using another ring dye laser system), we had to confirm via “negative” LIF lines that really the proposed lower level is excited. Finally, the spectral position of the structure in the OG scan as well as the observed hyperfine structure must fit to the new level. From several excitations and/or the observed hf structure we derived also the magnetic dipole hf constant A of the new level. Further we assumed the electric quadrupole constant B to be zero due to the small quadrupole moment Q of the La139 nucleus. The method of finding and confirming new levels is sketched in Figure 3.
The levels found during this investigations are listed in Table 1, together with the
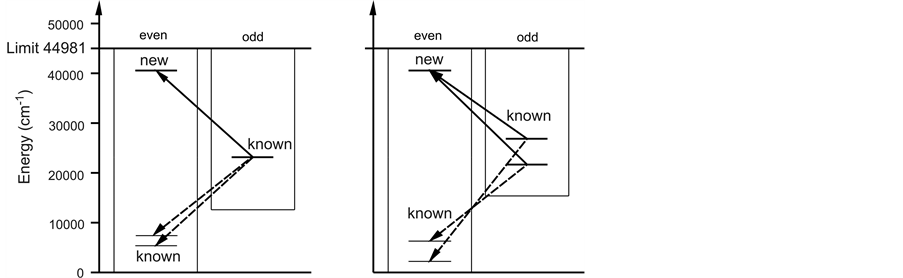
Figure 3. Identification of the lower level of the laser excitation by “negative” fluorescence and excitation of the new level from other known lower levels (confirmation of existence). Full arrows: lines excited by laser light. Dashed arrows: decay lines of the lower level of the excitation (“negative” fluorescence lines).
spectral lines which could be explained by the corresponding levels. All new levels have even parity, and the energy range is between 40,300 and 44,300 cm−1. Additionally, a very high lying level is mentioned (more than 46,000 cm−1), whose existence is not firmly proven, but is strongly supported by our observations. In column 10 the observed “negative” fluorescence wavelengths are given which allowed us to identify the combining odd level. If in column 10 no value is given, the transition is classified based on the excitation wavelength and the observed hf pattern.
3. Observed Line Widths
The observed hf resolved OG spectra of the lines mentioned in Table 1 were fitted in order to determine the magnetic dipole hf constant A of the new levels. The electric quadrupole constant B was assumed to be zero. For the combining lower levels, in most cases the hf constants were known. For the fitting a program called “Fitter” was used (as in most of our preceeding works), developed at Universität der Bundeswehr Hamburg [15] . In this program, it was possible to select different shapes of the hf components of the lines: a Gaussian, a Lorentzian, and a combination of both:
 (1)
(1)
where G(ν) and L(ν) are Gaussian and Lorentzian profiles of the same full width at half maximum (FWHM). During the fit procedure, ξ was treated as additional free parameter. The fit program works also in cases of blend situations, which means, several lines can be fitted simultaneously, and the relative center of gravity (cg) positions of different lines are also determined. This allows sometimes an accurate determination of the cg wave number of a transition and thus a high accuracy of the energy of a new level.
The obtained FWHM-values of transitions in which the new levels are involved are given in Table 2. The factor ξ is expressed in % values. Not all lines in Table 1 had a signal-to-noise ratio high enough for a reliable determination of the line width. Thus we selected those lines for which a determination of the width with an uncertainty better than 10% of the FWHM was possible. The mean values in Table 2 are arithmetic

Table 1. J-values, energies and hf-constants A of the new even La I levels, and lines explained by these levels. If the level energy is given with 3 figures after decimal point, the standard uncertainty is 0.010 cm−1, otherwise 0.05 cm−1. If the wavelength (in col. 4) is given with 3 figures after decimal point, the standard uncertainty is 0.002 Å, otherwise 0.01 Å. The wavelengths of the decay lines are given as integer values. tw―this work.
*J may also be 11/2 or 13/2.
Table 2. New even La I levels, spectral lines for which the width could be determined reliably, and observed widths. Assumed was a mixed line profile as described in the text. In column 6 (Comment, C.) the letter B and a number is given when the investigated line shows up in a blend situation, thus the plasma conditions are exactly the same (e.g. lines 5582.699, 5582.774 and 5583.035 Å show up in blend situation B10). The same numbers are used in Table 4. P is the parity of the levels. FWHM is a full width at half maximum of a single hf component, determined by the fitting program.
*J may also be 11/2 or 13/2. **width fixed in the fitting procedure. ***width determined on two different recordings of this line.
means and the uncertainties are mean standard uncertainties of the mean value.
For comparison we investigated also the widths of spectral lines classified by already known even parity La I levels. These levels and the investigated transitions are given in Table 3. Beside these levels, also low lying odd La I levels, one La II level, and two Ar I levels were treated.
The line widths determined from the hf patterns of the lines mentioned in Table 3 are listed in Table 4. For some of the lines (La levels with low energy and both Ar lines) we determined the plasma temperature from the observed FWHM, assuming a Gaussian line profile. This temperature is given in column 10.
4. Discussion
The observed width as a function of the energy of the upper level of the excited transition is shown in Figure 4. As can be seen, the line width is increasing continously until an approximately level energy of 43,000 cm−1 (vertical line in Figure 4). This can be explained by an increasing tendency to collision-induced depopulation of the exciting state. Indeed, for level energies higher than 40,000 cm−1 we could not observe “positive” LIF lines, that means, the collision-induced depopulation is so strong that radiative decays are not observable. The collisions lower the life time of the energy states leading to a larger line width.
At energies higher than 43,000 cm−1 we found a number of energy levels for which the observed lines show much higher values of the FWHM, and a practically pure Lorent-
Table 3. J-values, parities, energies and hf-constants A of the energy levels investigated additionally to the new levels. The spectral lines evaluated and their classification are also given. tw this work. The level 18235.558 cm−1 is belongs to La II. At the end of the table, two Ar I-levels are listed. If the energy of La I or La II levels is given with 3 figures after decimal point, the accuracy is 0.010 cm−1; otherwise the accuracy is 0.05 cm−1. The Ar I energies are from ref. [21] . tw―this work.
a: given in ref. [17] with J = 11/2, A = 51.9(20) MHz. b: given in ref. [20] with A = 97.6(30) MHz. c: given in ref. [20] . d: given in ref. [17] with J = 13/2, A = 49(9) MHz. e: given in ref. [17] with A = 62(9) MHz. f: given in ref. [20] with J = 11/2 and A = 99.2(30) MHz.
Table 4. Levels and spectral lines for which the width was determined for comparison. Assumed was a mixed line profile as described in the text. In colum 6 the letter B and a number is given when the investigated line is blended. For lines with the same blend number, the plasma conditions are exactly the same (e.g. lines 5936.215 and 5936.276 Å show up in blend B18). The same numbers are used in Table 2.
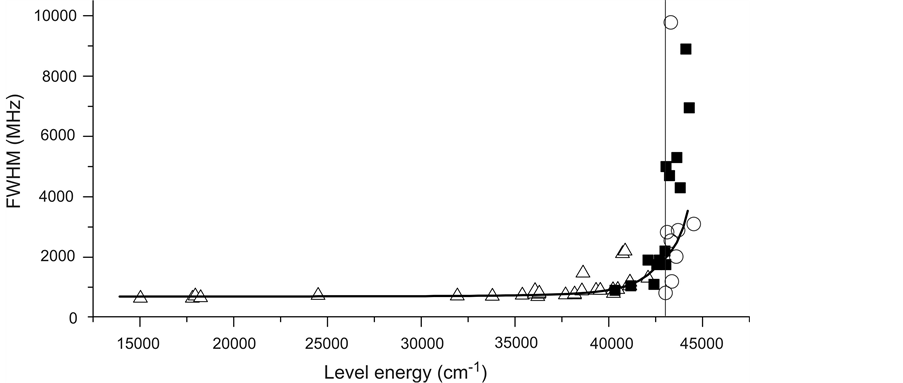
Figure 4. FWHM as a function of the energy of the upper level of the excited transition. Apart from some exceptions, the FWHM increases continously until approximately 43,000 cm−1 (bold full line) but then, for some levels, a jump to much higher values is observed. The border between these two ranges is marked by a thin vertical line. Full squares: FWHM determined from new levels (Table 2). Triangles: FWHM determined from already known levels (Table 4). Circles: FWHM determined from already known levels (Table 4) having energies higher than 43,000 cm−1. The value for the new level 46,082 cm−1 is not shown here.
zian line shape. At the first glance an interpretation as autoionizing states seems to be reliable.
The ionization limit of La I is given in ref. [11] to be 44,981 cm−1, quoted from the paper of Garton and Wilson [25] , who investigated absorption lines converging to the 6s2 (excited) level of La II, with a limit energy of 51,376(5) cm−1. Substraction of the excitation energy of the La II 6s2 level at 7394.57 cm−1 leads to the first ionization potential of La I, 44,981(5) cm−1. On the other hand, the last even level in ref. [11] is located at 40,243 cm−1, and between 40,910 cm−1 and the ionization limit one can find only two odd levels (44978.6 and 44978.9 cm−1).
From laser spectroscopy, a larger amount of levels, all of them having even parity, with energies higher than 40,243 cm−1 are known. But above 43,000 cm−1, apart from the new levels reported in Table 1, only 7 levels at energies between 43,004 and 43,718 cm−1 are known from refs. [20] and [23] . One further level is reported to have 44,517 cm−1 [23] (see Table 3). The existence of these levels was checked and confirmed during our investigations, but sometimes we had to change the values of the hf constant A and/or the value of the angular momentum J. The highest level given in ref. [23] at 44,570 cm−1 was introduced via one excited spectral line (5733.0 Å), but this line could be classified by us as a transition between already known levels, thus we think that the level at 44,570 cm−1 is not existing. The analysis of the FWHM-values of lines classified as transitions from these levels showed high and low values between 9800(1000) MHz for the level at 43,206 cm−1 and 780(80) MHz for the level at 43,004 cm−1 (see Table 4). The values are shown in Figure 4 as open circles.
We found also some exceptions of the general trend: The levels at 38,626, 40,732 and 40,878 cm−1 show a much higher FWHM than most of the levels, while the levels at 42,415, 43,004 and 43,381 cm−1 show a lower FWHM. For the level with the highest energy, at 44,517 cm−1, we found a FWHM value of only 3000(300) MHz. This shows that the treatment of the levels with very high FWHM as autoionizing states is too simple. Apparently the collision-induced probability for depopulation is dependent mainly on the electronic structure and not only on energy. A lowering of the ionization energy by electric fields is also possible. Such fields are present due to the discharge voltage, but also due to collisions of atoms with ions. This effect is known for long time, since it was shown already in 1930 in a famous spectrum of the hydrogen Balmer series in high electric fields, taken by Rausch von Traubenberg and Gebauer [26] . In this spectrum the quenching of the Stark components of each of the Balmer lines takes place at different field strengths, demonstrating the dependency of the ionization energy on the respective quantum numbers.
The measured FWHM values have some scattering, even for one upper level, as is noticeable in Table 2 (the accuracy of the FWHM-values is the same for all investigated lines belonging to the same upper level). Partly this scattering may be explained by the fact that the discharge conditions were not exactly the same for all investigated lines. On the other hand, the variation of FWHM depending on the energy is not due to the fact of different discharge conditions, as can be seen in the following two recordings: here, due to blend situations, we can observe in one scan the variation of the FWHM (Figure 5 and Figure 6). Apart from these two examples, a large number of lines were investigated in blend situations (numbers B… in Tables 2-4). Such lines for sure were investigated under the same discharge conditions and the same experimental arrangements,
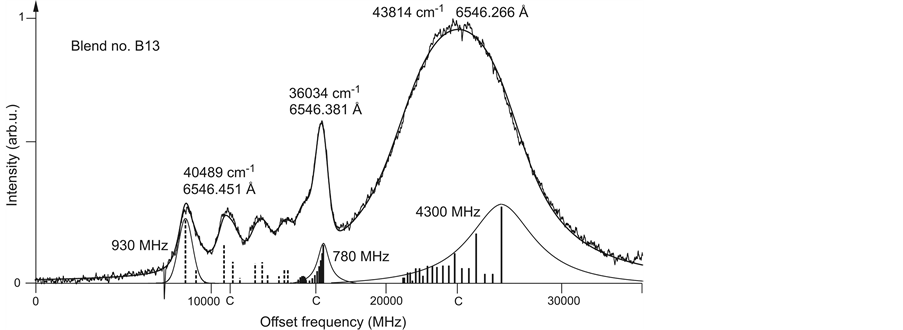
Figure 5. Blend situation around 6546.3 Å. In one optogalvanic recording we observed three spectral lines, the two low-frequency lines are transitions between already known energy levels. The high-frequency line (right hand side of the picture) is classified by us as a transition to the new energy level 43,814 cm−1. The position of the hf components of the lines are shown by vertical bars (full or dotted lines), their length proportional to the theoretical component intensity. Around the highest hf component of each line the profile as found by the fit procedure is shown. The structures are well fitted by summing up all profiles (at the positions of the corresponding hf components) weighted by the theoretical intensities. The letters C mark the positions of the particular centers of gravity of the lines.
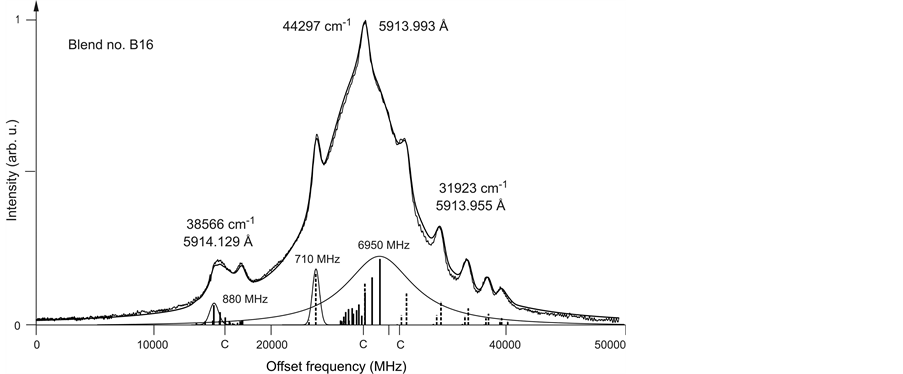
Figure 6. Blend situation around 5914.0 Å. In one optogalvanic recording we observed again three spectral lines. The low-frequency line is a transition between already known energy levels. The huge peak in the center with its wide spread wings is overlapped additionally by the hf components of a (already classified) spectral line with a widely spread hf splitting. The central peak is classified by us as a transition to the new energy level 44,297 cm−1. The position of the hf components of the lines are shown by vertical bars (full or dotted lines), their length proportional to the theoretical component intensity. Around the highest hf component of each line the profile as found by the fit procedure is shown. The structures are well fitted by summing up all profiles (at the positions of the corresponding hf components) weighted by the theoretical intensities. The letters C mark the positions of the particular centers of gravity of the lines.
since the lines appear in one OG scan. Thus we claim that the observation of the variation of the FWHM depending on the upper level is correct.
As can be seen in Table 4, a reliable value for the temperature of the plasma in the hollow cathode cannot be given. Let us discuss the values obtained from the levels at 15,031 and 17,797 cm−1. Both upper levels are investigated using lines for which the combining even level is the ground state, 0 cm−1. Thus the level energy is at the same time the transition wave number. Assuming a pure Gaussian profile of a single hf component, the Doppler width ΔνD of a spectral component is given by
 (2)
(2)
where ν is the transition frequency, c is the velocity of light, kB is the Boltzmann constant, T is the absolute temperature and m is the atomic mass.
From this equation it follows that ΔνD should be proportional to the transition wave number (which is ν/c). Nevertheless, we observed from the fit for both transitions the same FWHM of 640 MHz with uncertainties of 50 and 30 MHz, respectively. This leads to different temperatures T as is mentioned in Table 4, not agreeing within the error limits. For comparison we have determined the plasma temperature also from two Ar I lines (last two lines of Table 4). Here we observe temperatures between 300(100) and 500(150)˚C.
It should be mentioned again, that the plasma burns inside a cooled cathode region. The wall (3 mm in diameter) would have liquid nitrogen temperature (−196˚C) if no plasma is burning. The plasma has a power consumption of ca. 30 W and heats the walls to a certain temperature not measurable by us. In the center, the plasma for sure is much hotter than on the border wall. Furthermore, the plasma is not dense enough to be in local thermodynamic equilibrium but will be a non-equilibrium low pressure plasma. Additionally, it is not sure that the laser beam intersecting the hollow cathode lamp was always exactly centered. Thus only a rough estimation of the plasma temperature is possible, leading to the value of approximately 300˚C.
5. Conclusions
In this work, we present 16 new even La I energy levels in the energy range 40,300 to 46,100 cm−1. These levels explain 67 spectral lines observed in OG spectra. For each of the levels, the FWHM of the single hf components were determined, leading to the result that up to ca. 43,000 cm−1 we observed a moderate increase of the width. The line shape is described by a sum of Lorentzian and Gaussian profiles with the same FWHM. With increasing energy, the Lorentzian part increases.
For most of the new levels with energies higher than 43,000 cm−1, the line shape is described by a pure Lorentzian function having a much higher width. Such states are very effectively depopulated by collisions leading to a very short lifetime and thus high Lorentzian width. Apparently the depopulation probability is strongly dependent on the composition of the wave function of the respective state. This observation may contribute to the theoretical description of the energy states of La I.
Cite this paper
Windholz, L., Gamper, B. and Binder, T. (2016) Variation of the Observed Widths of La I Lines with the Energy of the Upper Excited Levels, Demonstrated on Previously Unknown Energy Levels. Spectral Analysis Review, 4, 23- 40. http://dx.doi.org/10.4236/sar.2016.43003
References
- 1. Firestone, R.B., Shirley, V.S., Baglin, C.M., Chu S.Y.F. and Zipkin, J. (1996) Table of Isotopes. Wiley, New York.
- 2. Fischer, W., Hühnermann, H., Mandrek, K. and Ihle H. (1972) Optical Determination of the Quadrupole Moment of 138La. Physics Letters B, 40, 87.
http://dx.doi.org/10.1016/0370-2693(72)90290-0 - 3. Anderson, O.E. (1934) The Nuclear Mechanical Moment of Lanthanum from Hyperfine Structure. Physical Review, 45, 685.
- 4. Raghavan, P. (1989) Table of Nuclear Moments. Atomic Data and Nuclear Data Tables, 42, 189.
http://dx.doi.org/10.1016/0092-640X(89)90008-9 - 5. Nighat, Y., Raith, M., Manzoor, H. and Windholz, L. (2010) Investigation of the Hyperfine Structure of Lanthanum Lines by a Laser-Induced Fluorescence Technique. Journal of Physics B, 43, 125001.
http://dx.doi.org/10.1088/0953-4075/43/12/125001 - 6. Gücelüimen, F., Siddiqui, I., Başar, B., Kröger, S. and Windholz, L. (2012) New Energy Levels and Hyperfine Structure Measurements of Neutral Lanthanum by Laser-Induced Fluorescence Spectroscopy. Journal of Physics B, 45, 135005.
http://dx.doi.org/10.1088/0953-4075/45/13/135005 - 7. Siddiqui, I., Shamim, K., Gamper, B., Dembczyński, J. and Windholz, L. (2013) Optogalvanic Spectroscopy of the Hyperfine Structure of Weak La I Lines: Discovery of New Even Parity Fine Structure Levels. Journal of Physics B, 46, 065002.
http://dx.doi.org/10.1088/0953-4075/46/6/065002 - 8. Gamper, B., G1owacki, P., Siddiqui, I., Dembczyński, J. and Windholz, L. (2014) New Even- Parity Fine Structure Levels of the Lanthanum Atom Discovered by Means of Optogalvanic Spectroscopy. Journal of Physics B, 47, 165001. http://dx.doi.org/10.1088/0953-4075/47/16/165001
- 9. Peck, E.R. and Reeder, K. (1972) Dispersion of Air. Journal of the Optical Society of America, 62, 958-962. http://dx.doi.org/10.1364/JOSA.62.000958
- 10. Guthöhrlein, G.H. and Windholz, L. (1995) Optogalvanic Spectroscopy—A Useful Tool in Atomic and Plasma Physics. In: Veza, D., Ed., The Physics of Ionized Gases, Nova Science Publishers, Huntington, NY, USA.
- 11. Martin, W.C., Zalubas, R., and Hagan, L. (1978) Atomic Energy Levels—The Rare-Earth Elements. National Bureau of Standards, USA, 60.
- 12. Harrison, G.R., Ed. (1969) Wavelength Tables. Massachusetts Institute of Technology, The M.I.T. Press, USA.
- 13. Furmann, B., Stefańska, D. and Dembczyński, J. (2007) Hyperfine Structure Analysis Odd Configurations Levels in Neutral Lanthanum: I. Experimental. Physica Scripta, 76, 264.
http://dx.doi.org/10.1088/0031-8949/76/3/010 - 14. Başar, Gü., Başar, Gö., Er, A. and Kröger, S. (2007) Experimental Hyperfine Structure Investigation of Atomic La. Physica Scripta, 75, 572.
http://dx.doi.org/10.1088/0031-8949/75/4/034 - 15. Guthöhrlein, G.H. (1998) Program Package "Fitter". Helmut-Schmidt-Universität, Universität der Bundeswehr, Hamburg, Germany (Unpublished).
- 16. Başar, Gü., Başar, Gö. and Kröger, S. (2009) High Resolution Measurements of the Hyperfine Structure of Atomic Lanthanum for Energetically Low Lying Levels of Odd Parity. Optics Communications, 282, 562-567.
http://dx.doi.org/10.1016/j.optcom.2008.10.048 - 17. Yu, T. (1957) Hyperfine Structure and Quadrupole Moment of Lanthanum-139. Physical Review, 108, 295. http://dx.doi.org/10.1103/PhysRev.108.295
- 18. Childs, W.J. and Nielsen, U. (1988) Hyperfine Structure of the (5d+6s)3 Configuration of 139La I: New Measurements and Ab Initio Multiconfigurational Dirac-Fock Calculations. Physical Review A, 37, 6. http://dx.doi.org/10.1103/PhysRevA.37.6
- 19. Höhle, C., Hühnermann, H. and Wagner, H. (1982) Measurements of the Hyperfine Structure Constants of All the 5d 2 and 5d6s Levels in 139La II Using the High-Resolution Spectroscopy on Collinear Laser-Ion-Beams. Zeitschrift für Physik A, 304, 279.
- 20. Furmann, B., Stefańska, D. and Dembczyński, J. (2009) Experimental Investigations of the Hyperfine Structure in Neutral La: I. Odd Parity Levels. Journal of Physics B, 42, 175005.
http://dx.doi.org/10.1088/0953-4075/42/17/175005 - 21. Luo, C.A., Qu, J.N., Zhu, L.Z. and Lin, F.C. (1990) Studies on the Hyperfine Structure of La I in a Hollow-Cathode Discharge Tube. Journal of Physics D, 23, 1327.
- 22. Childs, W.J. and Goodman, L.S. (1978) Hyperfine Structure of Excited, Odd-Parity Levels in 139La by Laser-Atomic-Beam Fluorescence. Journal of the Optical Society of America, 68, 1348-1350.
http://dx.doi.org/10.1364/JOSA.68.001348 - 23. Furmann, B., Stefańska, D. and Dembczyński, J. (2010) Experimental Investigations of the Hyperfine Structure in Neutral La: II. Even Parity Levels. Journal of Physics B, 43, No. 1.
http://dx.doi.org/10.1088/0953-4075/43/1/015001 - 24. Kramida, A., Ralchenko, Yu., Reader, J. and NIST ASD Team (2015) NIST Atomic Spectra Database (Version 5.3). National Institute of Standards and Technology, Gaithersburg, MD.
http://physics.nist.gov/asd - 25. Garton, W.R.S. and Wilson, M. (1966) Autoionization Broadened Rydberg Series in the Spectrum of La I. Astrophysical Journal, 145, 333. http://dx.doi.org/10.1086/148764
- 26. Rausch von Traubenberg, H., Gebauer, R. and Lewin, G. (1930) über die Existenzgrenzen von Anregungszuständen des Wasserstoffatoms in starken elektrischen Feldern. Naturwissens-chaften, 18, 417.