World Journal of Engineering and Technology
Vol.05 No.02(2017), Article ID:74768,13 pages
10.4236/wjet.2017.52014
A Two-Dimensional Computational Model for the Simulation of Dendritic Microstructure and Solute Distribution of Fe-0.04%C Alloys
Min Zhang, Qin Xue, Lulu Li, Jihong Li
School of Materials Science and Engineering, Xi’an University of Technology, Xi’an, China

Copyright © 2017 by authors and Scientific Research Publishing Inc.
This work is licensed under the Creative Commons Attribution International License (CC BY 4.0).
http://creativecommons.org/licenses/by/4.0/


Received: September 20, 2016; Accepted: May 5, 2017; Published: May 8, 2017
ABSTRACT
A new model of dendritic growth and solute distribution of Fe-0.04%C binary alloys was developed, which is based on the sharp interface model of dendritic growth. This innovative model improved the cellular automaton method, combined with the finite difference method, considered concentration field, temperature field and the shape of molten pool. This model simulated the growth morphologies of single equiaxial crystal, the relationship between tip growth velocity and time, multi-equiaxed crystals’ growth morphologies and solute distribution, the growth of columnar crystals, columnar-to-equiaxed transition after coupling temperature field, and compared with experimental results. The results indicate that crystallographic orientation has certain influence on dendritic morphologies, that the tip growth velocity tends to be stable with the extension of time in the end, that the shape of molten pool influences the growth morphologies of columnar crystals and that the solute mainly concentrates in dendritic roots and among grain boundaries. The simulated results are in accord with experimental results.
Keywords:
Cellular Automaton-Finite Difference (CA-FD) Method, Dendritic Growth, Style, The Solute Distribution, The Temperature Distribution

1. Introduction
The dendritic microstructure determines material microstructure and mechanical properties during the process of metal solidification [1] . Therefore, it is important to control dendritic growth in the process of solidification if there is a need to get high-quality metal castings. The traditional method [2] [3] is time- consuming, expensive and can’t be directly observed in most cases to explore the microstructure of solidification. In recent years, with the development of computer technology, the numerical simulation of metal solidification can be realized on the computer. This makes up for the deficiencies of the traditional experiment, and more directly and deeply explores metal solidification.
There are many detailed simulation models at present, such as the Phase Field (PF) method, Monte Carlo (MC) method, Cellular Automaton (CA) method, and Front Tracking method [4] [5] . The CA model [6] [7] [8] , lately developed and widely used, is based on the physical mechanism of dendritic growth and “probabilistic” thought, expands the calculation scale, and is able to display the temperature and concentration field in the process of solidification. Based on the above reasons, the CA model has become an effective research method in simulating the solidification process of casting and has obtained certain achievements [9] [10] [11] [12] . For the complexity of the welding process, such as fast cooling, high temperature and kinetics, and the CA method is imperfect, there have been no successful results on simulating microstructure evolution of solidification process in weld molten pool using the CA method, which is applied rarely in the welding field. Huang et al. [13] have put forward the feasibility and advantages of competitive growth in simulating weld solidification using the CA method by analysis in 2003, preliminarily have established weld solidification model based on the CA method, have simulated the growth process of grains with crystallographic orientation in molten pool by CA method and have better reflected the characteristics of weld metal solidification in 2008 [14] . Zhan et al. [15] have simulated the columnar crystals and equiaxial crystals’ competitive growth of Al-Cu binary alloys with the CA method by approximating weld fusion line to segment. Zhang et al. [16] have achieved columnar-to-equiaxed transition (CET) in solidification of weld molten pool based on the CA method, but this model has not yet considered the influence factor of molten pool shape. In fact, molten pool is a kind of arc shape, and there are few simulations about dendritic morphology and solute distribution in molten pool of specific shape. In order to solve the above problem, this work combines the CA method with the finite difference method (FD), namely the CA-FD method, assumes that the molten pool has a standard arc shape, establishes the molten pool model, temperature field model, dendritic nucleation, growth, and solute redistribution and diffusion models, and then simulates the growth morphology and solute distribution of single crystal and multi-equiaxed crystals with different crystallographic orientations in the center of arc-shaped molten pool, and analyzes the relationship between tip growth velocity of dendrite and time. It also simulates the growth of columnar crystals in the weld center and columnar-to-equiaxed transition after coupling temperature field.
2. Model Description
A description of a two-dimensional model is provided. The two-dimensional calculation domain was divided into 400 × 800 cells of uniform orthogonal arrangement. The grid size was . The specific algorithms for the shape of molten pool, temperature field, dendritic nucleation and growth, and energy/ solute transport were described by both FD and CA methods.
2.1. Molten Pool Model
The weld molten pool is actually an irregular arc shape, and it continuously changes during solidification. In order to simplify the model, this work uses an ideal model by setting the radius of molten pool and assuming that the shape of molten pool remains the same during solidification. The interior of the molten pool distributes liquid alloy, and the outside is solid. If there is a crystal nucleus  in the molten pool, the equation governing molten pool shape is given by:
 (1)
(1)
2.2. FD Model for Temperature Field
The temperature field of molten pool was simulated by the FD method. There are two kinds of finite difference calculations about welding heat conduction. One is the steady-state heat conduction of finite difference; the other is transient heat conduction of finite difference. Because of the characteristics of welding heat source, including concentration, mobility and instantaneity, the transient heat conduction of finite difference equation is used to describe the temperature field of molten pool in this paper.
The boundary conditions are assumed as follows: the top of the molten pool is adiabatic; and, the wall of molten pool is heat-dissipation. Then the basic partial differential equation [17] is given by:
 (2)
(2)
where  is the thermal conductivity,
  is specific heat, and
  is density of alloy.
The explicit difference scheme is used to solve Equation (2) and the obtained  of solidification area is written as:
 (3)
(3)
Here,  is the fourier number:
 . Where
  and
and  are re-
spectively time step and the length of the CA cell side.
2.3. CA Model for Microstructure
2.3.1. Nucleation and Growth Model
In this paper, the quasi-continuous nucleation model is adopted, which is put forward by Rappaz et al. and Thevoz et al. [18] [19] . This model uses the Gaussian distribution function to describe the relationship between grain density and degree of undercooling, as shown below:
 (4)
(4)
where  is maximum density of nucleation given by the integral of the total distribution,
  is the standard degree of curvature undercooling, and
  is the degree of undercooling when the nucleation density is maximum.
The sharp interface model of dendritic growth established by Chen et al. [20] is used in this work, which is said that the interface has no thickness and the physical quantities of solid and liquid phases sharply change on both sides of interface. Grains after nucleation begin to steadily grow at the effect of undercooling. The undercooling mentioned here includes curvature undercooling , composition undercooling
  and heat undercooling
 . The thermal diffusion can be ignored for the reason that thermal diffusion is usually 3 - 4 orders of magnitude higher than solute diffusion in the process of solidification. The general undercooling
  is calculated by:
 (5)
(5)
here curvature undercooling is represented by  and composition undercooling by
  , where
  is the Gibbs-Thomson coefficient,
  is the anisotropy strength of solid-liquid interfacial energy,
  is the angle of the normal to the interface with respect to the x-axis,
  is the angle of crystallographic orientation with respect to the same axis,
  is liquidus slope,
  is the initial solute concentration,
  is liquid solute concentration at the interface, and
  is the curvature of the solid/liquid interface, which can be determined by:
 (6)
(6)
where  is the solid fraction of neighboring cells, and
  is the number of the nearest and the second nearest neighboring cells
 .
.
2.3.2. Solute Redistribution and Diffusion Model
Solute redistribution is one of the most important steps in the process of dendritic growth. Assuming that the solid/liquid concentration at the interface satisfies the following equation:
 (7)
(7)
where  is solid solute concentration at the interface, and
  is equilibrium partition coefficient. The liquid solute concentration at the interface
  is adopted as:
 (8)
(8)
where  is the equilibrium liquidus temperature at the initial composition, and
  is the local temperature.
The discharge of solute will inevitably lead to rising in liquid solute concentration around dendrites, forming a big concentration gradient, promoting the diffusion of solute, and being uniformly distributed to the adjacent liquid cells in the end. In fact, the diffusions of solute include diffusion in liquid phase, solid phase and interface. These three kinds of diffusions occur simultaneously and interact with each other. In order to simplify the model, the simulation assumes that the diffusion only occurs in liquid phase. Then the governing equation [21] for solute conservation of liquid phase is illustrated below:
 (9)
(9)
where  is the solute concentration in liquid phase, and
  is the solute diffusion coefficient in liquid phase.
There are some restrictions about the selection of a time step. In this paper the explicit difference scheme of diffusion equation is adopted and obtains the time step according to the stability of discrete equation, meanwhile, the time step also meets the provisions of the CA method. So the time step can be determined by:
 (10)
(10)
where  is the cell size, and
  is the maximum growth velocity obtained by scanning the velocities of all interface cells during each time step.
3. Simulation Results and Discussions
The numerical model of dendritic growth was established by researching and appropriately simplifying the theory of solidification. Fe-0.04%C binary alloys are selected as object to simulate the dendritic growth morphology of solidification process, solute distribution and temperature field in arc-shape molten pool. The physical parameters of Fe-0.04%C binary alloys are listed in Table 1.
3.1. The Simulation of Single Equiaxial Crystal
Figures 1(a)-(c) show the single dendrite morphology with different crystallographic orientations after 0.67 × 10⁻⁴ min. It is found that there is a big difference in secondary dendrites morphology of different crystallographic orientations by comparing the three dendritic morphologies. That is to say, the growth

Table 1. Thermophysical properties of Fe-0.04%C binary alloys used in calculation.

Figure 1. Single dendrite morphology of different crystallographic orientations of Fe- 0.04%C binary alloys: (a) 0˚, (b) 30˚, (c) 45˚.
velocity of secondary dendrites with crystallographic orientation of 45˚ is slower than the other two orientations under the same growth time. The dendrite morphology with crystallographic orientation of 0˚ has the best symmetry. The difference of morphology is caused by mesh dependency, and this article will further improve CA growth algorithm to reduce the mesh dependency of simulations.
Figure 2 shows the relationship between tip growth velocity of dendrite and time. At the beginning of dendritic growth, the tip growth velocity is quick, then rapidly decreases with time extending and tends to a stable value after about 0.17 × 10⁻⁴ min, the velocity fluctuation is less than 0.006 m/min. The reason is that dendrite rapidly grows at the beginning of solidification under the effect of supercooling. As the solidification proceeds, the discharged solute concentrates at the front of liquid/solid interface and restrains the growth of dendritic tip. Only when the rate of discharging solute in the interface is equal to the diffusive rate of solute from the interface to surrounding liquid phase, the growth velocity of dendritic tip will tend to a stable value.
3.2. The Simulation of Multi-Equiaxed Crystals
Multi-equiaxed crystals with random crystallographic orientations of Fe-0.04%C binary alloys free growing from an undercooling melt after 0.50 × 10⁻⁴ min and 0.83 × 10⁻⁴ min were simulated. The time step was 0.17 × 10⁻⁷ min. Assuming that the temperature in arc-shape molten pool was isothermal during the solidification. A continuous cooling condition with a constant cooling rate of 1200

Figure 2. The relationship between tip growth velocity of dendrite and time.
K/min was imposed in the arc-shape molten pool.
Figure 3(a) and Figure 3(d) show the simulated evolution of multi-dendrites growth. It is notable that all the dendrites grow along their crystallographic orientations at the beginning of solidification, and the primary trunks grow fast and the secondary dendrite arms begin emitting from the unstable solid/liquid interface of the primary trunks. When the time is 0.83 × 10⁻⁴ min, the primary trunks meet each other and almost stop growing as shown in Figure 3(d). At the same time, the secondary and the tertiary dendrites grow quicker and coarsening occurs. As a result, the multi dendrites become asymmetric structures, owing to the restriction and compete with each other among the multi dendrites.
Figure 3(b) and Figure 3(e) show the solid composition field at different times, and the contrast strip on the right side represents the value of solute concentration. It is notable that the solid composition uniformly distributes in primary trunks, and the solid solute concentration in the secondary and the tertiary dendrite arms is higher than the primary trunks. It also can be seen that the solid solute concentrates in the roots of the secondary dendrites at the beginning of the solidification process, and gradually decreases with the growth of the secondary dendrites. The reason is that the reticular gaps formed by the mutual crisscross among dendritic arms hinder the diffusion of the solid solute, while the solid solute in dendritic tip can quickly spread to surrounding liquid phase. As the solidification proceeds, grains contact each other and the enriched solute in the reticular gaps eventually becomes solid. The degree of solute concentration is not serious eventually.
Figure 3(c) and Figure 3(f) show the liquid compositon field at different times. It can be seen that the areas of solute concentration mainly distribute in the regions that are surrounded by dendritic arms. Moreover, the smaller the areas are, the higher the degree of enrichment, and the grain boundary segregation appears in the end of solidification.
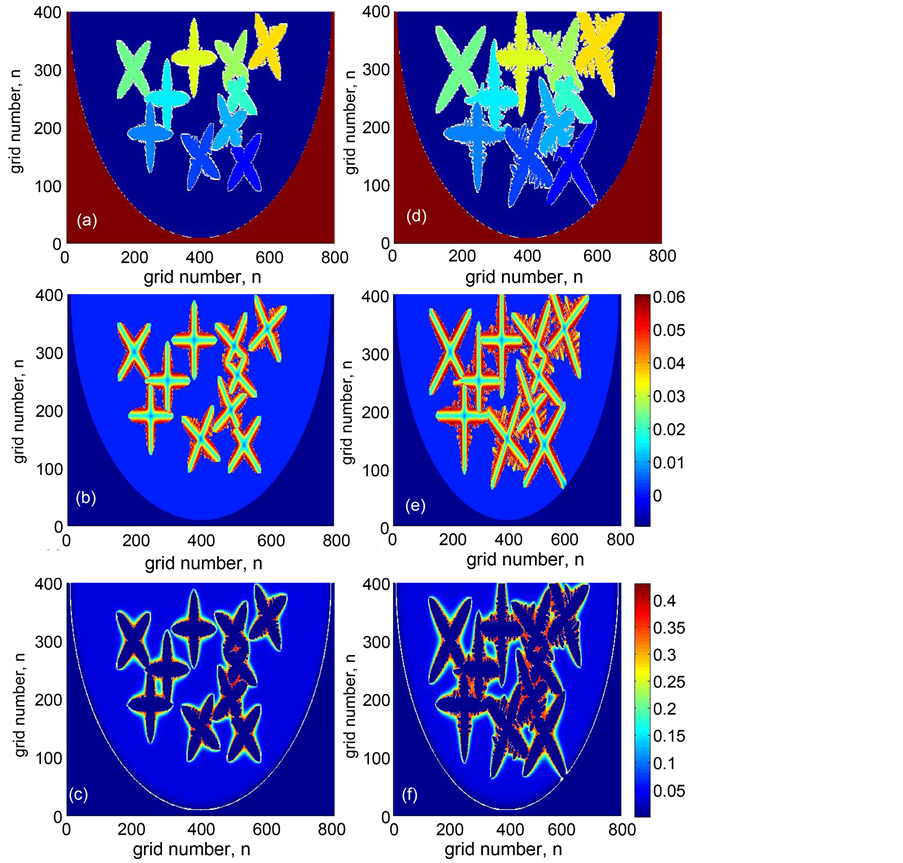
Figure 3. The multi-dendrite growth morphology, and the liquid and solid solute distribution of Fe-0.04%C binary alloys at different times: (a) dendritic morphology after 0.50 ´ 10−4 min, (d) dendritic morphology after 0.83 ´ 10−4 min, (b) solid concentration distribution after 0.50 ´ 10−4 min, (e) solid concentration distribution after 0.83 ´ 10−4 min, (c) liquid concentration distribution after 0.50 ´ 10−4 min, (f) liquid concentration distribution after 0.83 ´ 10−4 min.
3.3. The Simulation of Columnar Crystals
The simulated growth morphology of columnar crystals and the observed microstructure of the experiment are presented in Figure 4. The time step is 0.33 × 10⁻² min. It can be seen that there are a large number of crystal nuclei on the molten pool wall, which rapidly grow and contact each other, thereby forming the fine equiaxed crystals. The unstable grains in front of the interface competitive grow as dendrites, owing to the solute diffusion and undercooling. Some of the dendrites in advantageous positions survive from competition and block other dendrites. During the process of gradually eliminating the dendrites in disadvantageous positions, the columnar crystals are formed. Due to the effect of

Figure 4. Columnar crystals morphology of Fe-0.04%C binary alloys: (a) t = 0.17 ´ 10−2 min, (b) t = 0.50 ´ 10−2 min, (c) t = 0.83 ´ 10−2 min.
arc-shaped molten pool, another phenomenon should be noted that the columnar crystals on the bottom of molten pool are more concentrated than those on the edage of molten pool, and the dendritic arms of which are thinner.
3.4. The Simulation of CET after Coupling with Temperature Field
In previous studies, for the simulation of dendrites freely growing from a constant undercooled melt, the calculation domain was maintained at uniform tem- perature field. However, the actual temperature field has a gradient transformation, thus affecting the growth morphology of dendrites. In order to accord with the actual solidification process of molten pool, the simulated CET was coupled with the changed temperature field in this model.
Figure 5(a) shows the macroscopic temperature field. The contrast strip on the right side represents the temperature value. It can be seen that the temperature in the center of molten pool is the highest, and due to the heat dissipation of molten pool wall; the closer to the edge of molten pool, the lower the temperature is, thus forming the temperature gradient. Moreover, the temperature gradient inside the molten pool is small, and the closer to the edge of molten pool, the bigger the temperature gradient is, owing to the heat dissipation of molten pool wall is faster than that inside the molten pool.
By comparing Figure 5(b) with Figure 5(c), it can be noted that the shape of molten pool mainly affects the crystallographic orientations of columnar crystals on the molten pool wall, and has no effect on the internal equiaxial crystals.

Figure 5. Temperature field and dendritic morphology of CET of Fe-0.04%C binary alloys: (a) temperature field, (b) dendritic morphology in arc-shape molten pool, (c) dendritic morphology in rectangle-shape molten pool.
Metal solidification theory holds that the columnar crystals’ spindles have strict crystallographic orientations as they begin to grow. The base metal grains are anisotropic on the molten pool wall of arc shape, and it is beneficial for columnar crystals to grow when the crystallographic orientations of columnar crystals’ spindles exactly match the base metal grains. However, the base metal grains are isotropic on the molten pool wall of a rectangle, and such an idealized model has a large difference with actuality.
The solid/liquid solute distributions are shown in Figure 6, and the contrast strip on the right side represents the value of solute concentration. It can be found that the solid solute concentration of fine grains region on the surface is the lowest. With the growth of columnar crystals, the solid solute concentration increases gradually, and mainly concentrates in the end of the primary trunks and the secondary interdendrite. Likewise, the degree of solid solute segregation of equiaxial crystals in the primary trunk tips and the secondary/tertiary interdendrite is the biggest. The cause of solute enrichment is that the solute of dendritic roots is hampered by dendritic arms and not easily spread into the liquid phase of molten pool. Because the heat dissipation of molten pool wall is faster than molten pool center and the dendrites grow with more discharged solute, the liquid solute concentration enriches in the roots of columnar and equiaxial crystals; in addition, the degree of solute enrichment of the former is higher than the later.

Figure 6. Solute distribution of CET of Fe-0.04%C binary alloys: (a) solid concentration distribution, (b) liquid concentration distribution.
4. Conclusions
A newly-coupled two-dimensional CA-FD model was developed to quantitatively predict the dendritic growth and solute distribution during the solidification of Fe-0.04%C binary alloys in arc-shape molten pool. The following main results were gained:
1) The numerical simulations were performed for single equiaxial crystal and multi-equiaxed crystals with different crystallographic orientations. At the beginning of solidification, the tip growth velocity rapidly decreased, and tended to a stable value after about 0.17 × 10⁻⁴ min, while the velocity fluctuation was less than 0.006 m/min. Dendritic morphology varied with the crystallographic orientation. The microsegregation of solute was mainly among grain boundaries or along the dendritic arms.
2) The growth morphology of columnar crystals after different times was simulated. Some of the dendrites in advantageous positions competitively grew by blocking other dendrites and become columnar crystals. Owing to the effect of molten pool shape, the columnar crystals on the bottom of molten pool were more compact compared with the columnar crystals on both sides of the molten pool. The CA simulated results for columnar crystals were found to be in agreement with theoretical prediction and experimental result.
3) The simulated dendrite morphology by CA-FD model which was coupled with a nonuniform temperature field was more consistent with solidification theory and closer to the actual solidification conditions than the original model of this article’s authors. The solute mainly enriched in the roots of dendrites, and the solute concentration of columnar crystals’ roots was higher than equiaxial crystals’ roots.
Cite this paper
Zhang, M., Xue, Q., Li, L.L. and Li, J.H. (2017) A Two- Dimensional Computational Model for the Simulation of Dendritic Microstructure and Solute Distribution of Fe-0.04%C Alloys. World Journal of Engineering and Technology, 5, 175-187. https://doi.org/10.4236/wjet.2017.52014
References
- 1. Zhou, Y.H., Hu, Z.Q. and Jie, W.Q. (1998) The Technology of Solidification. Mechanical Industry Press, Beijing.
- 2. Beckermann, C., Li, Q. and Tong, X. (2001) Microstructure Evolution in Equiaxed Dendritic Growth. Science and Technology of Advanced Materials, 2, 117-126.
https://doi.org/10.1016/S1468-6996(01)00037-7 - 3. Li, Q. and Beckermann, C. (2002) Modeling of Free Dendritic Growth of Succinonitrile-Acetone Alloys with Thermosolutal Melt Convection. Journal of Crystal Growth, 236, 482-498.
https://doi.org/10.1016/S0022-0248(01)02390-9 - 4. Zhan, X.H. (2008) Simulation of Dendritic Grain Growth in Weld Pool of Ni-Cr Binary Alloy. PhD Thesis, Harbin Institute of Technology, Harbin.
- 5. Qin, R.S., Wallach, E.R. and Thomason, R.C. (2005) A Phase-Field Model for the Solidification of Multicomponent and Multiphase Alloys. Journal of Crystal Growth, 279,163-169.
https://doi.org/10.1016/j.jcrysgro.2005.02.005 - 6. Zhang, H., Xu, Q.Y., Shi, Z.X. and Liu, B.C. (2014) Numerical Simulation of Dendrite Grain Growth of DD6 Superalloy during Directional Solidification Process. Acta Metallurgica Sinica, 50, 345-354.
- 7. Reuther, K. and Rettenmayr, M. (2014) Perspectives for Cellular Automata for the Simulation of Dendritic Solidification—A Review. Computational Materials Science, 95, 213-220.
https://doi.org/10.1016/j.commatsci.2014.07.037 - 8. Guillemot, G., Gandin, Ch.-A. and Bellet, M. (2007) Interaction between Single Grain Solidification and Macrosegregation: Application of a Cellular Automaton— Finite Element Model. Journal of Crystal Growth, 303, 58-68.
https://doi.org/10.1016/j.jcrysgro.2006.12.076 - 9. Zhang, L., Wang, Y.M. and Zhang, C.B. (2001) Modelling Solidification Process for Nickel-Based Superalloy by Cellular Automata. Acta Metallurgica Sinica, 37, 882-888.
- 10. Yan, W.D., Yang, A.M., Liu, H.W. and Liu, L. (2002) The Solidification Grain Organization for K4169 High Temperature Alloy by Computer Simulation. Special Casting & Non-Ferrous Alloys, 4, 26-28.
- 11. Candin, C.A., Desbiolles, J.L. and Rappa, M. (1999) Three Dimensional Finite Element-Cellulare Automation Model for the Prediction of Solidification Grain Structures. Metallurgical and Materials Transactions A, 30, 3153-3165.
https://doi.org/10.1007/s11661-999-0226-2 - 12. Rappaz, M. (1989) Modelling of Microstructure Formation in Solidification Processes. International Materials Reviews, 34, 93-123.
https://doi.org/10.1179/imr.1989.34.1.93 - 13. Huang, A.G., Wang, Y.S. and Li, Z.Y. (2003) The Research of Cellular Automata Model during Weld Metal Solidification. Welding Technology, 12, 13-16.
- 14. Huang, A.G., Yu, S.F. and Li, Z.Y. (2008) The Cellular Automata Simulation of Weld Metal Solidification Organizations. Welding Institute, 29, 45-48.
- 15. Zhan, X.H., Wei, Y.H. and Ma, R. (2008) Numerical Simulation of Dendritic Grain Growing during Al-Cu Alloy Solidification. Chinese Journal of Nonferrous Metals, 18, 710-716.
- 16. Zhang, M., Wang, Q., Li, J.H. and Li, L. (2013) Numerical Simulation of the Microstructure Evolution during Rapid Solidification Process of Weld Pool. Transactions of the China Welding Institution, 34, 1-4.
- 17. Wu, C.S. (2007) Welding Thermal Process and Molten Pool Shape. Mechanical Industry Press, Beijing.
- 18. Rappaz, M. and Thevoz, P.H. (1987) Solute Diffusion Model for Equiaxed Dendritic Growth: Analytical Solution, Acta Metallurgica, 35, 2929-2933.
https://doi.org/10.1016/0001-6160(87)90292-6 - 19. Thevoz, P.H., Desbiolles, J.L. and Rappaz, M. (1989) Modeling of Equiaxed Microstructure Formation in Casting. Metallurgical and Materials Transactions A, 20, 311-322.
https://doi.org/10.1007/BF02670257 - 20. Chen, J. (2005) Numerical Simulation on Solidification Microstructures Using Cellular Automaton Method. PhD Thesis. Southeast University, Nanjing.
- 21. Zhu, M.F., Chen, J., Sun, G.X. and Hong, J.S. (2005) Numerical Modeling of Dendritic Growth. Acta Metallurgica Sinica, 41, 583-587.