Journal of Electronics Cooling and Thermal Control
Vol.3 No.4(2013), Article ID:40534,5 pages DOI:10.4236/jectc.2013.34014
Effect of Non-Condensable Gas Leakage on Long Term Cooling Performance of Loop Thermosyphon
Hitachi Research Laboratory, Hitachi, Ltd., 832-1 Horiguchi, Hitachinaka, Ibaraki, Japan
Email: *hiroyuki.toyoda.qr@hitachi.com
Copyright © 2013 Hiroyuki Toyoda, Yoshihiro Kondo. This is an open access article distributed under the Creative Commons Attribution License, which permits unrestricted use, distribution, and reproduction in any medium, provided the original work is properly cited.
Received August 29, 2013; revised September 30, 2013; accepted October 8, 2013
Keywords: Thermosyphon; Boiling; Condensation; Non-Condensable Gas; Heat Transfer Performance; CPU Cooling
ABSTRACT
We have developed a loop thermosyphon for cooling electronic devices. The cooling performance of a thermosyphon deteriorates with an increasing amount of non-condensable gas (NCG). Design of a thermosyphon must consider NCG to provide guaranteed performance for a long time. In this study, the heat transfer performance of a thermosyphon was measured while changing the amount of NCG. The resultant performances were expressed as approximations. These approximations enabled us to predict the total thermal resistance of the thermosyphon by the amount of NCG and input heating. Then, using the known leakage in the thermosyphon and the amount of dissolved NCG in the water, we can predict the amount of NCG and the total thermal resistance of the thermosyphon after ten years. Although there is a slight leakage in the thermosyphon, we are able to design a thermosyphon with a guaranteed level of cooling performance for a long time using the proposed design method.
1. Introduction
Electronic devices need to be more compact these days, but it has become difficult to cool them sufficiently with existing air cooling systems that use only heat conductivity. We have developed a loop thermosyphon to provide high cooling performance for electronic devices [1,2]. The thermosyphon has some important features. One is that it has a porous structure that enhances evaporative heat transfer for the evaporation section to decrease thermal resistance. Another is that the position of the radiator can be freely adjusted by extending the joint pipes. This is highly beneficial when designing the server cooling system. Cooling systems for highly reliable electronic devices like servers must offer guaranteed performance for more than 10 years. However, the thermosyphon’s cooling performance deteriorates with an increasing amount of non-condensable gas (NCG) [3]. Although the container of our thermosyphon is sealed tightly, a helium leak detector cannot detect leakages below 10−10 Pa-m3/s. This value represents a typical small leakage. However, over a period of 10 years, a large amount of gas will leak and build up in the thermosyphon.
There has been a lot of research on cooling systems for electronic devices. Naphon et al. [4] studied a nanofluid jet impingement cooling system. Mohamed et al. [5] studied a mini-channel heat sink in electronic devices. Webb et al. [6] studied a thermosyphon using a sintered boiling surface and louver fins to cool desktop computers to dissipate 100 W. Their working fluid was R-134A and water. Samba et al. [7] reported on thermal performance of a loop thermosyphon for cooling telecommunication equipment to dissipate 600 W. Their working fluid was n-pentane. However, we cannot find research on the aged deterioration of a thermosyphon based on the amount of leaked NCG. It is industrially important to take the effect of such leakage on the performance into account when designing the thermosyphon.
In this study, the effect of the amount of NCG on heat transfer performance of the loop thermosyphon was investigated. Then, the amount of NCG flowing into the thermosyphon and the change in long term heat transfer performance after 10 years were predicted. We propose a design method of a thermosyphon with a guaranteed level of cooling performance for a long time.
2. Loop Thermosyphon Experimental Apparatus
We have developed a loop thermosyphon to provide high cooling performance for electronic devices [1,2]. Figures 1 and 2 show the thermosyphon. As the choice of refrigerant is environmentally important, we used degassed water. The thermosyphon was made of copper to resist corrosion by water. For the evaporation section, we used a porous structure for the evaporation surface. The evaporation surface was attached to the object to be cooled by evaporation. The vapor generated by evaporation flowed along the vapor tube (the larger upper tube in Figure 2) and then flowed into the condenser. The condensation section was 35.5 mm long and was made by flattening a circular tube with an inner diameter of 11.1 mm. This tube has microgrooves inside. The condensation section has offset fins attached to the outside of the condensation tube. The vapor flowing from the evaporation section was condensed into water in the condensation tube, and the heat from the object being cooled was dissipated into the airflow through the offset fins. The water that condensed in the condensation tube flowed into the evaporation section through the water tube (the lower tube in Figure 2). The thermosyphon cools the object by repeating this cycle. In Figure 2, the thin tube attached to the evaporation chamber, called the injection tube, is used to create a vacuum and to inject water. The injection tube is sealed tightly after water has been injected.
We measured the thermosyphon’s cooling performance while changing the amount of input heating, the flow rate of the cooling air, and the amount of NCG. As shown in Figure 1, we attached a heater (a ceramic heater 25 mm × 25 mm and 1.8 mm thick) to the evaporation surface with thermal grease. We measured the power consumption of this heater by using the inputted electric current and voltage and took this as the amount of input heating Q. We thought that it was important to be able to predict thermal performance easily based on the calorific value of the object to be cooled like the CPU (central
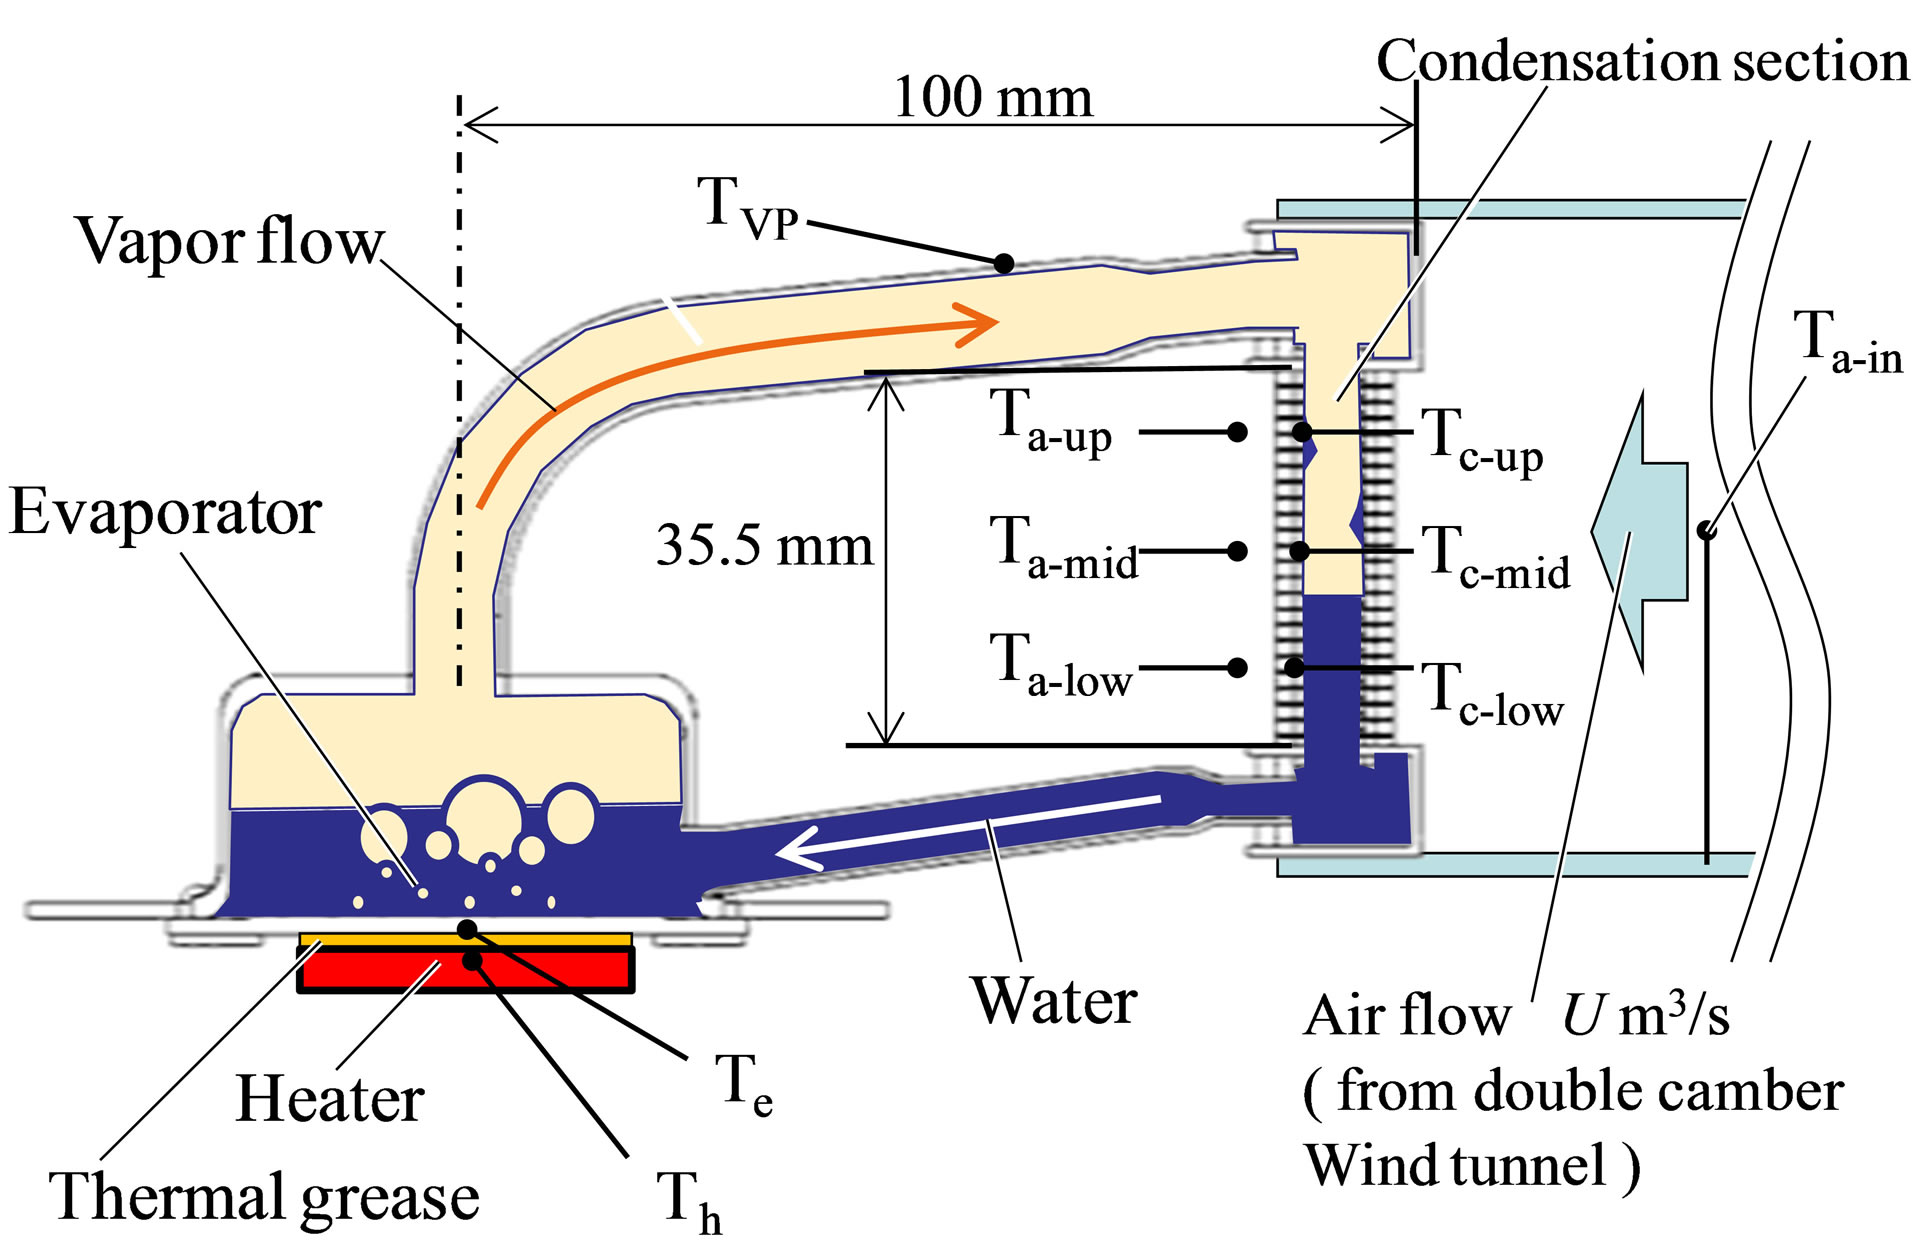
Figure 1. Schema of the thermosyphon.
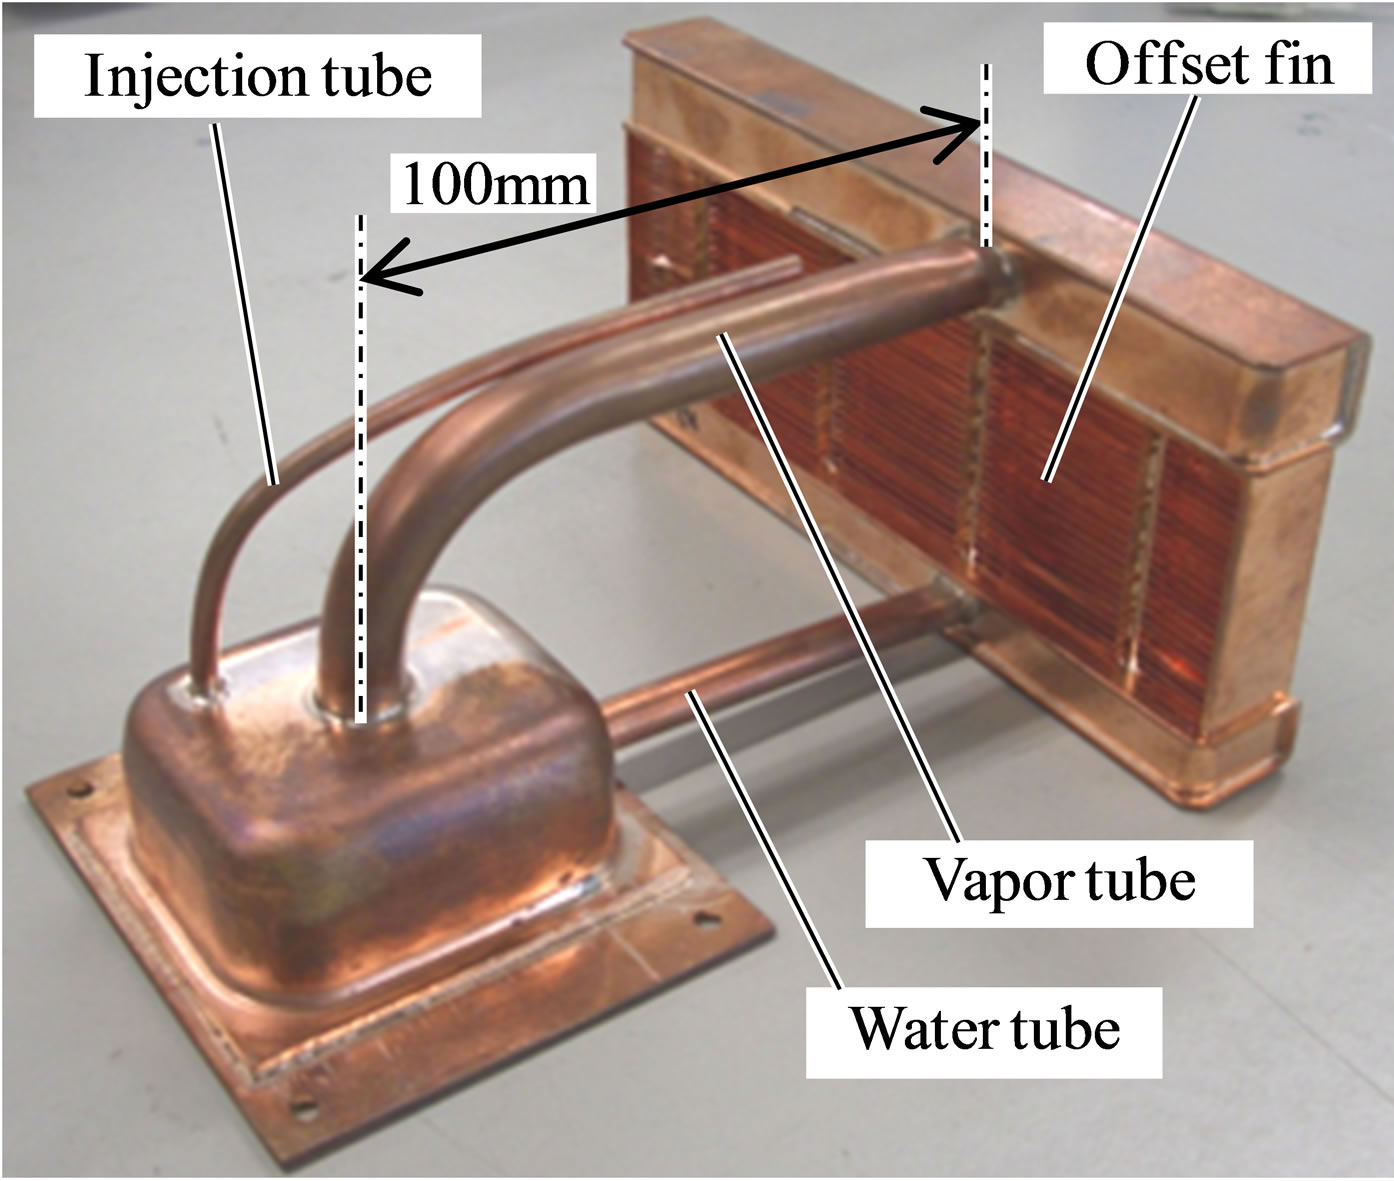
Figure 2. Appearance of the thermosyphon.
processing unit) in a server. Thus, the following performance experiments were performed based on the amount of input heating. Moreover, to examine the thermosyphon in the same conditions as actual use conditions, there was no thermal insulation on the thermosyphon’s surface. Three amounts of input heating were tested in this experiment: Q = 50, 100, and 200 W. A uniform cooling air flow into the condenser was obtained from a double chamber wind tunnel. Flow rates of U = 0.3, 0.5, and 0.9 m3/min. were used. The temperature measuring points are shown in Figure 1, where Th is the temperature of the heater, Te is the temperature of the evaporation plate center, Tv is the temperature of the vapor (we assume the vapor tube surface temperature is the same as the vapor temperature), and Ta-in is the temperature of the cooling air in front of the condenser. We divided the measuring areas of the condensation tube equally into three and measured the temperatures in these condensation tube regions, Tc-up (upper area), Tc-mid (middle area), and Tc-low (lower area). Moreover, we measured the exhaust air flow temperatures, Ta-up, Ta-mid, and Ta-low, corresponding to these regions. To simplify the comparison, we used the mean temperature of the condensation tube Tc and the mean exhaust air flow temperature Ta-out.
3. Cooling Performance Experimental Results
We evaluated the thermosyphon’s cooling performance by dividing it into three regions: one for evaporation performance, the second for condensation performance in the condensation tube and air cooling performance at the condenser, and the third for the heat leakage from the outside surface of the thermosyphon. Finally, the total thermal resistance of the thermosyphon was discussed.
3.1. Evaporation Performance
We evaluated the evaporation heat transfer coefficient of the evaporation surface. The evaporation heat transfer coefficient was defined by the following equation.
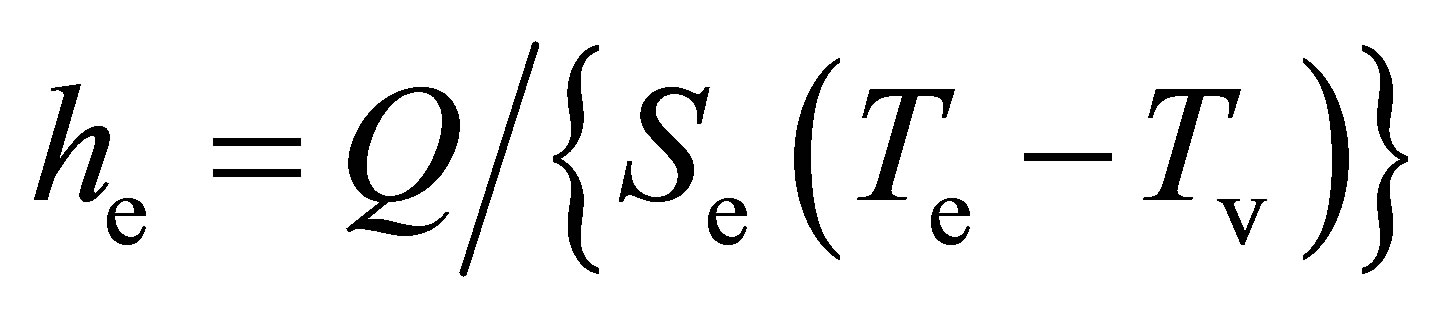 (1)
(1)
Here, Se is the porous surface area of the evaporation surface (Se = 1.51 × 10⁻³ m2), Q is the input heating, Tv is the vapor temperature, and Te is the evaporation surface temperature. The experimental results of the evaporation heat transfer coefficient are shown in Figure 3. The total pressure in the thermosyphon P0 was defined as P0 = PNCG + Pv. Here, PNCG is the partial pressure of NCG, and Pv is the pressure of saturated vapor, which is given by the temperature of vapor TV. The dashed line in Figure 3 shows the calculation result of the correlation equation of the pool boiling heat transfer coefficient on the flat surface in the saturated conditions proposed by Kutateladze [8]. The evaporation heat transfer of our porous structure is about five times as large as that of the flat surface. We obtained an expression of the approximation from the evaporation heat transfer coefficient he, the pressure P0, and the heat flux of the evaporation surface q = Q/Se , by using the least squares method.
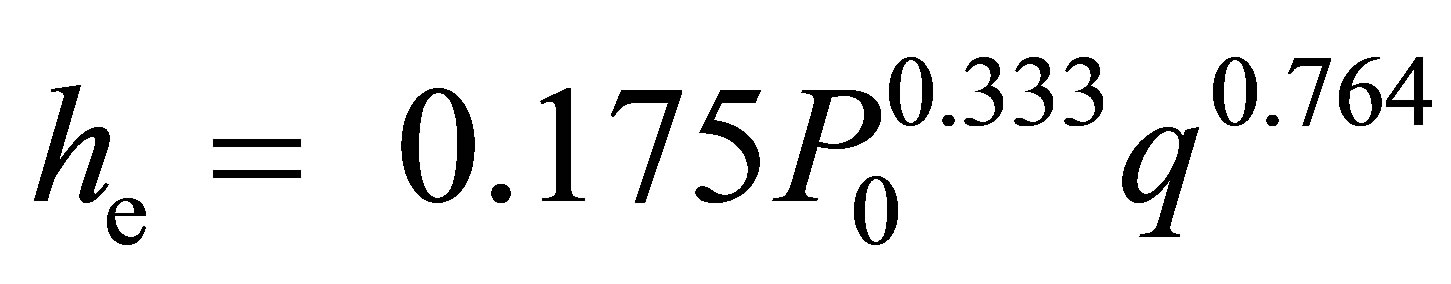 (2)
(2)
3.2. Cooling Performance of Condensation Section
We evaluated the condensation performance in the condenser tube. The amount of input heating Q and the condensation heat transfer rate Qcond are different because of the heat leakage from the thermosyphon. Therefore we measured the condensation heat transfer rate Qcond by using the temperature increase of the cooling air (Ta-out- Ta-in). The total condensation heat transfer coefficient hc-total was defined by the following equation.
 (3)
(3)
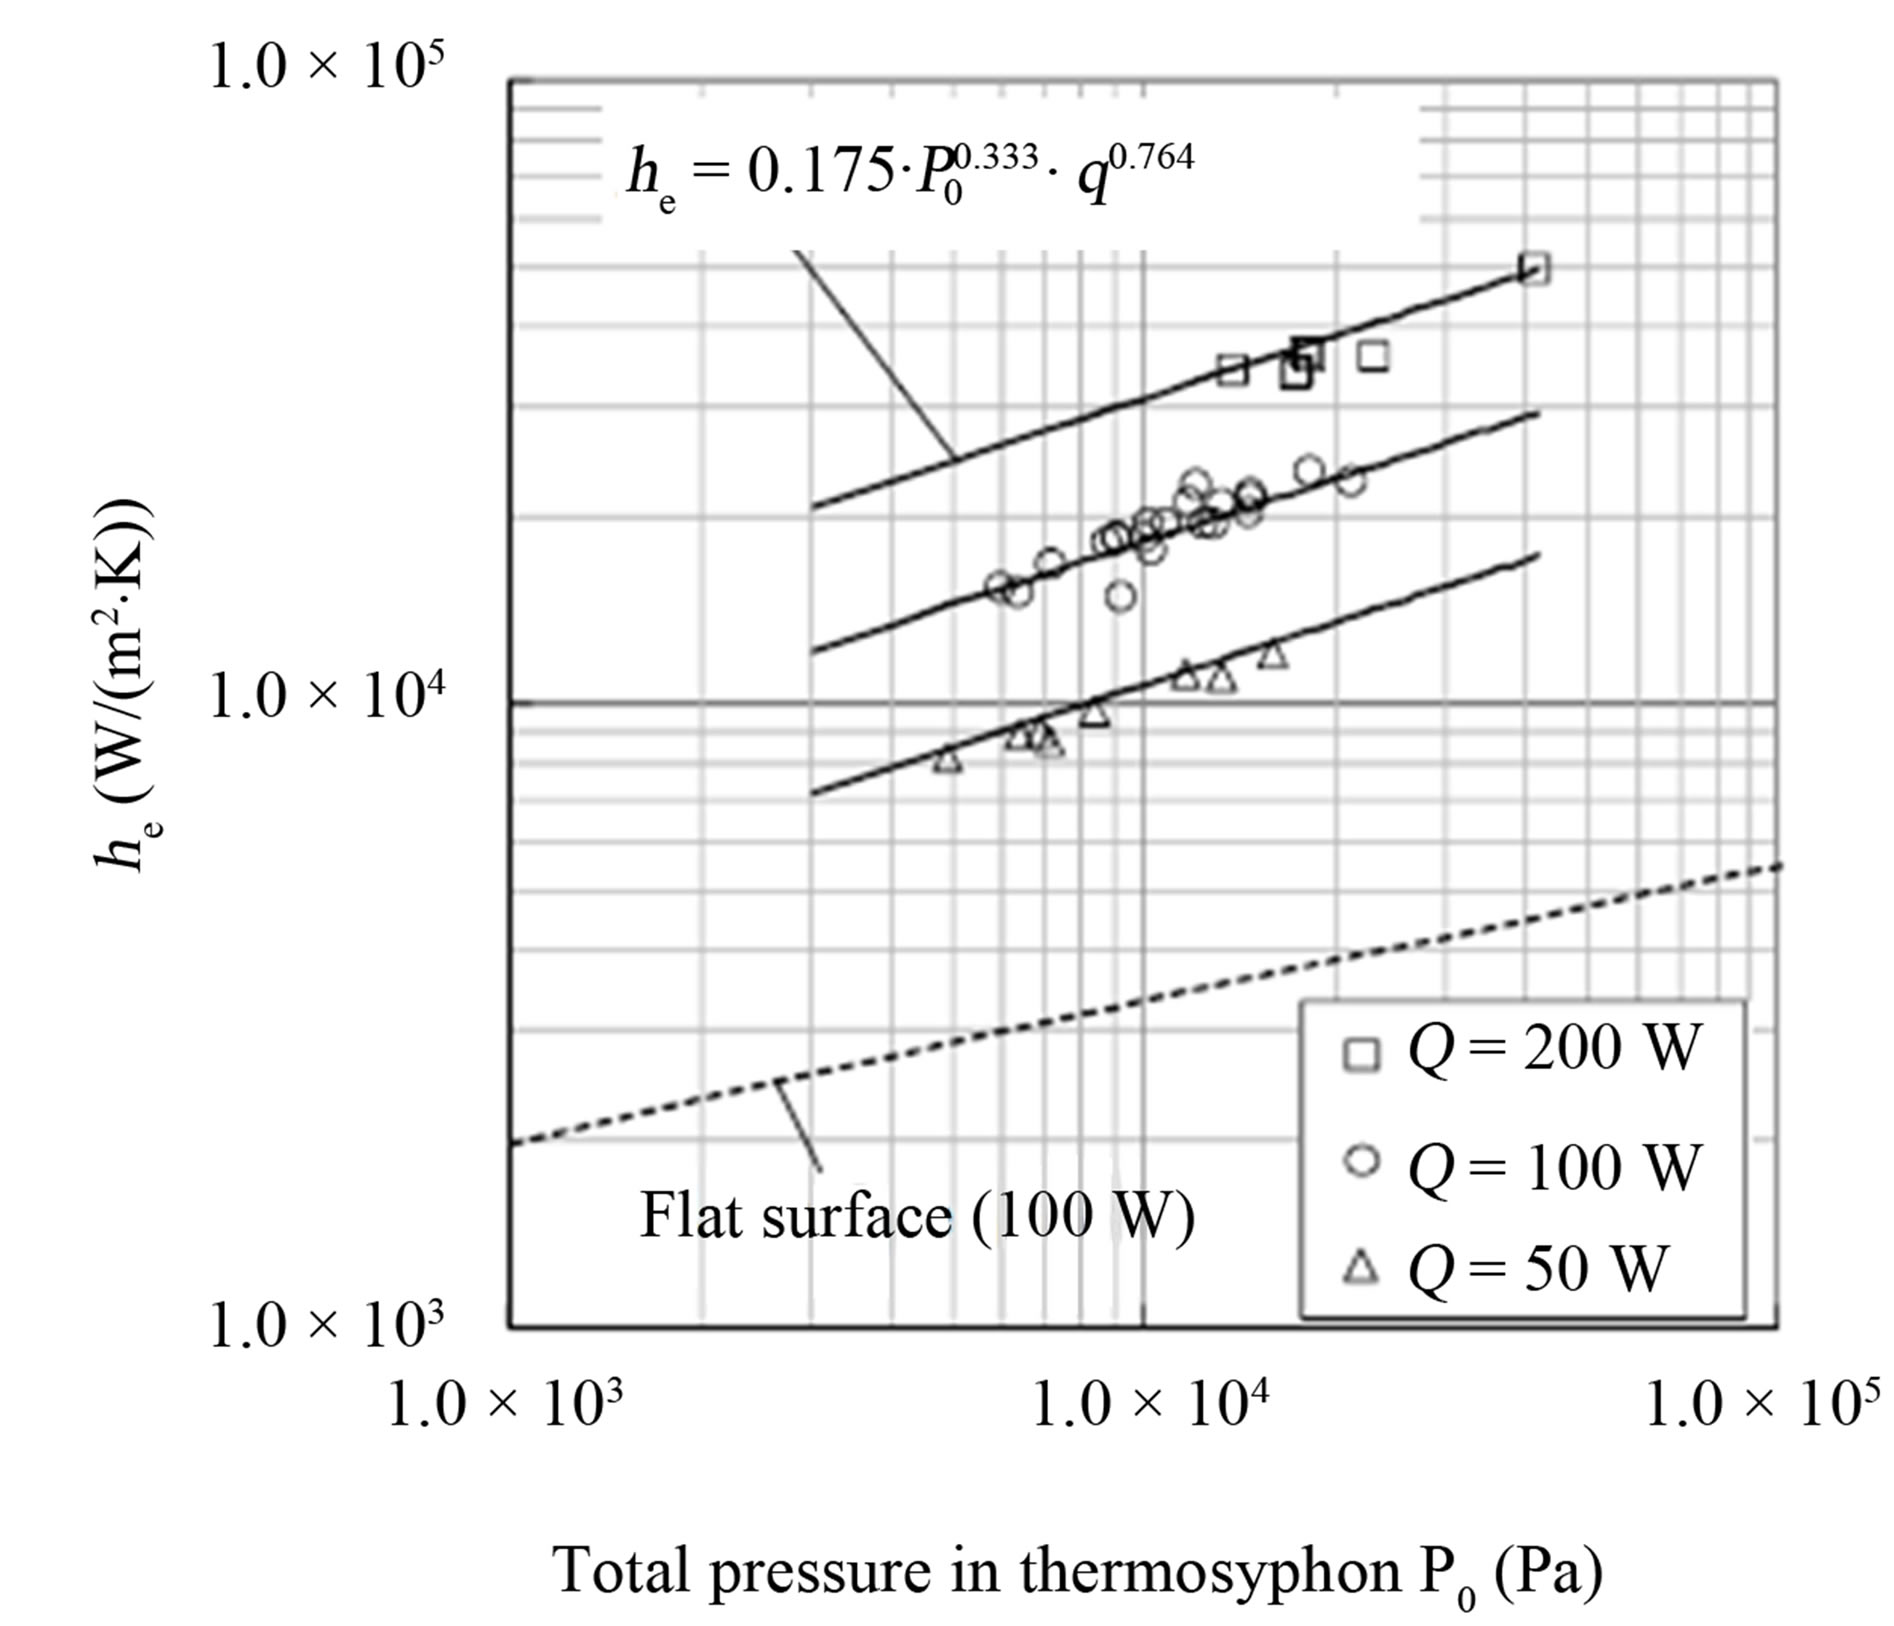
Figure 3. Heat transfer coefficient of evaporation surface.
Here, Sc is the total area of the inner condensation tube surface (Sc = 4.95 × 10⁻³ m2), Tv is the vapor temperature, and Tc is the mean temperature of the condensation tube. The relation between the condensation heat transfer coefficient and the partial pressure of NCG is shown in Figure 4 for three amount of the input heating Q. The condensation heat transfer coefficient decreased drastically when the partial pressure of NCG increased. We obtained an expression of the approximation from the condensation heat transfer coefficient hc-total, the partial pressure of NCG (PNCG), and the condensation heat transfer rate , by using the least squares method.
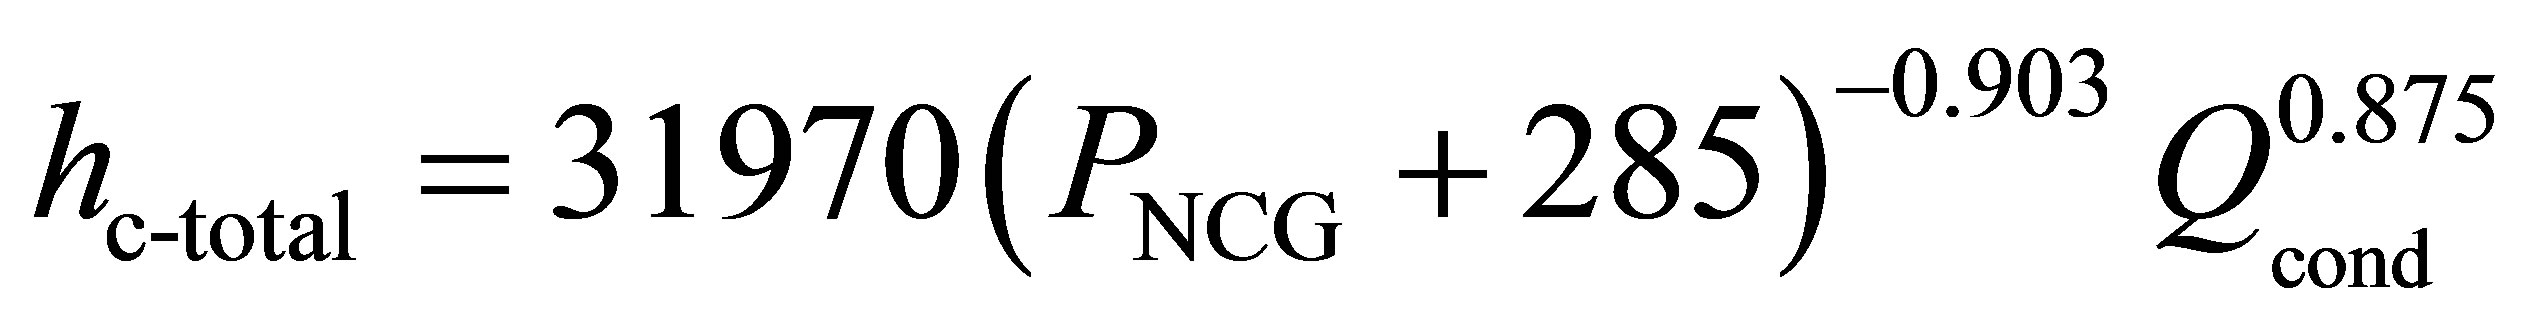 (4)
(4)
The approximation is shown with solid lines in Figure 4, and the difference between the experimental results and the approximation is 25% - 41%.
Next, we evaluated the air cooling performance on the outside of the condenser tube. The condenser has offset fins attached to the outside of the condensation tube. The forced convection heat transfer coefficient hf on the offset fins was obtained from the following equation.
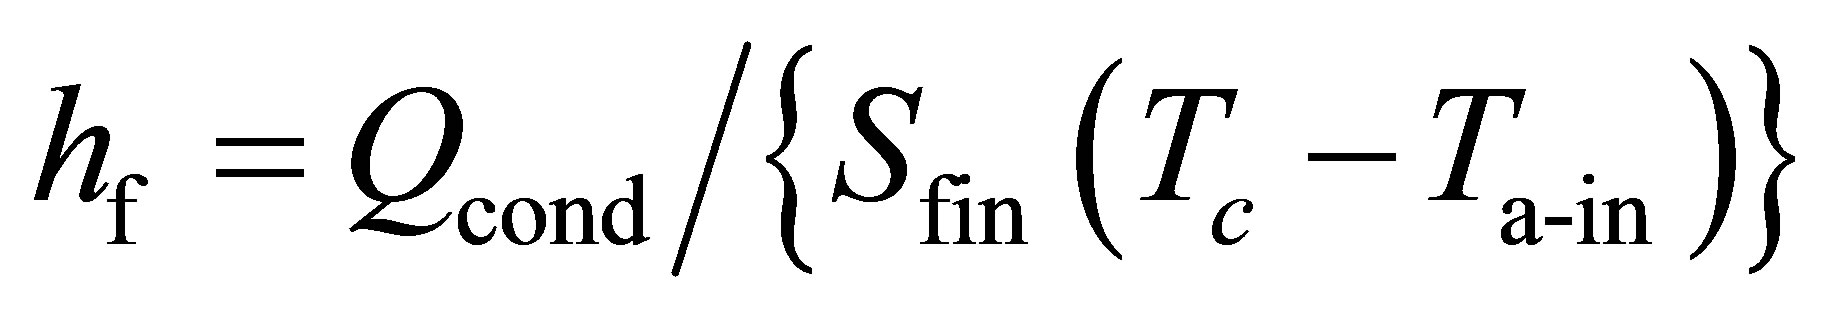 (5)
(5)
Here, Sfin is the total area of the offset fins, Tc is the mean temperature of the condensation tube, and Ta-in is the temperature of the cooling air in front of the condenser. Manglik et al. [9] reported on an experimental formula for the forced convection heat transfer coefficient for the offset fins. The calculation and experimental results of the heat transfer coefficient hf on offset fins for different air flow rates U are shown in Figure 5. The difference between the experimental results and the calculation is 14.2%.
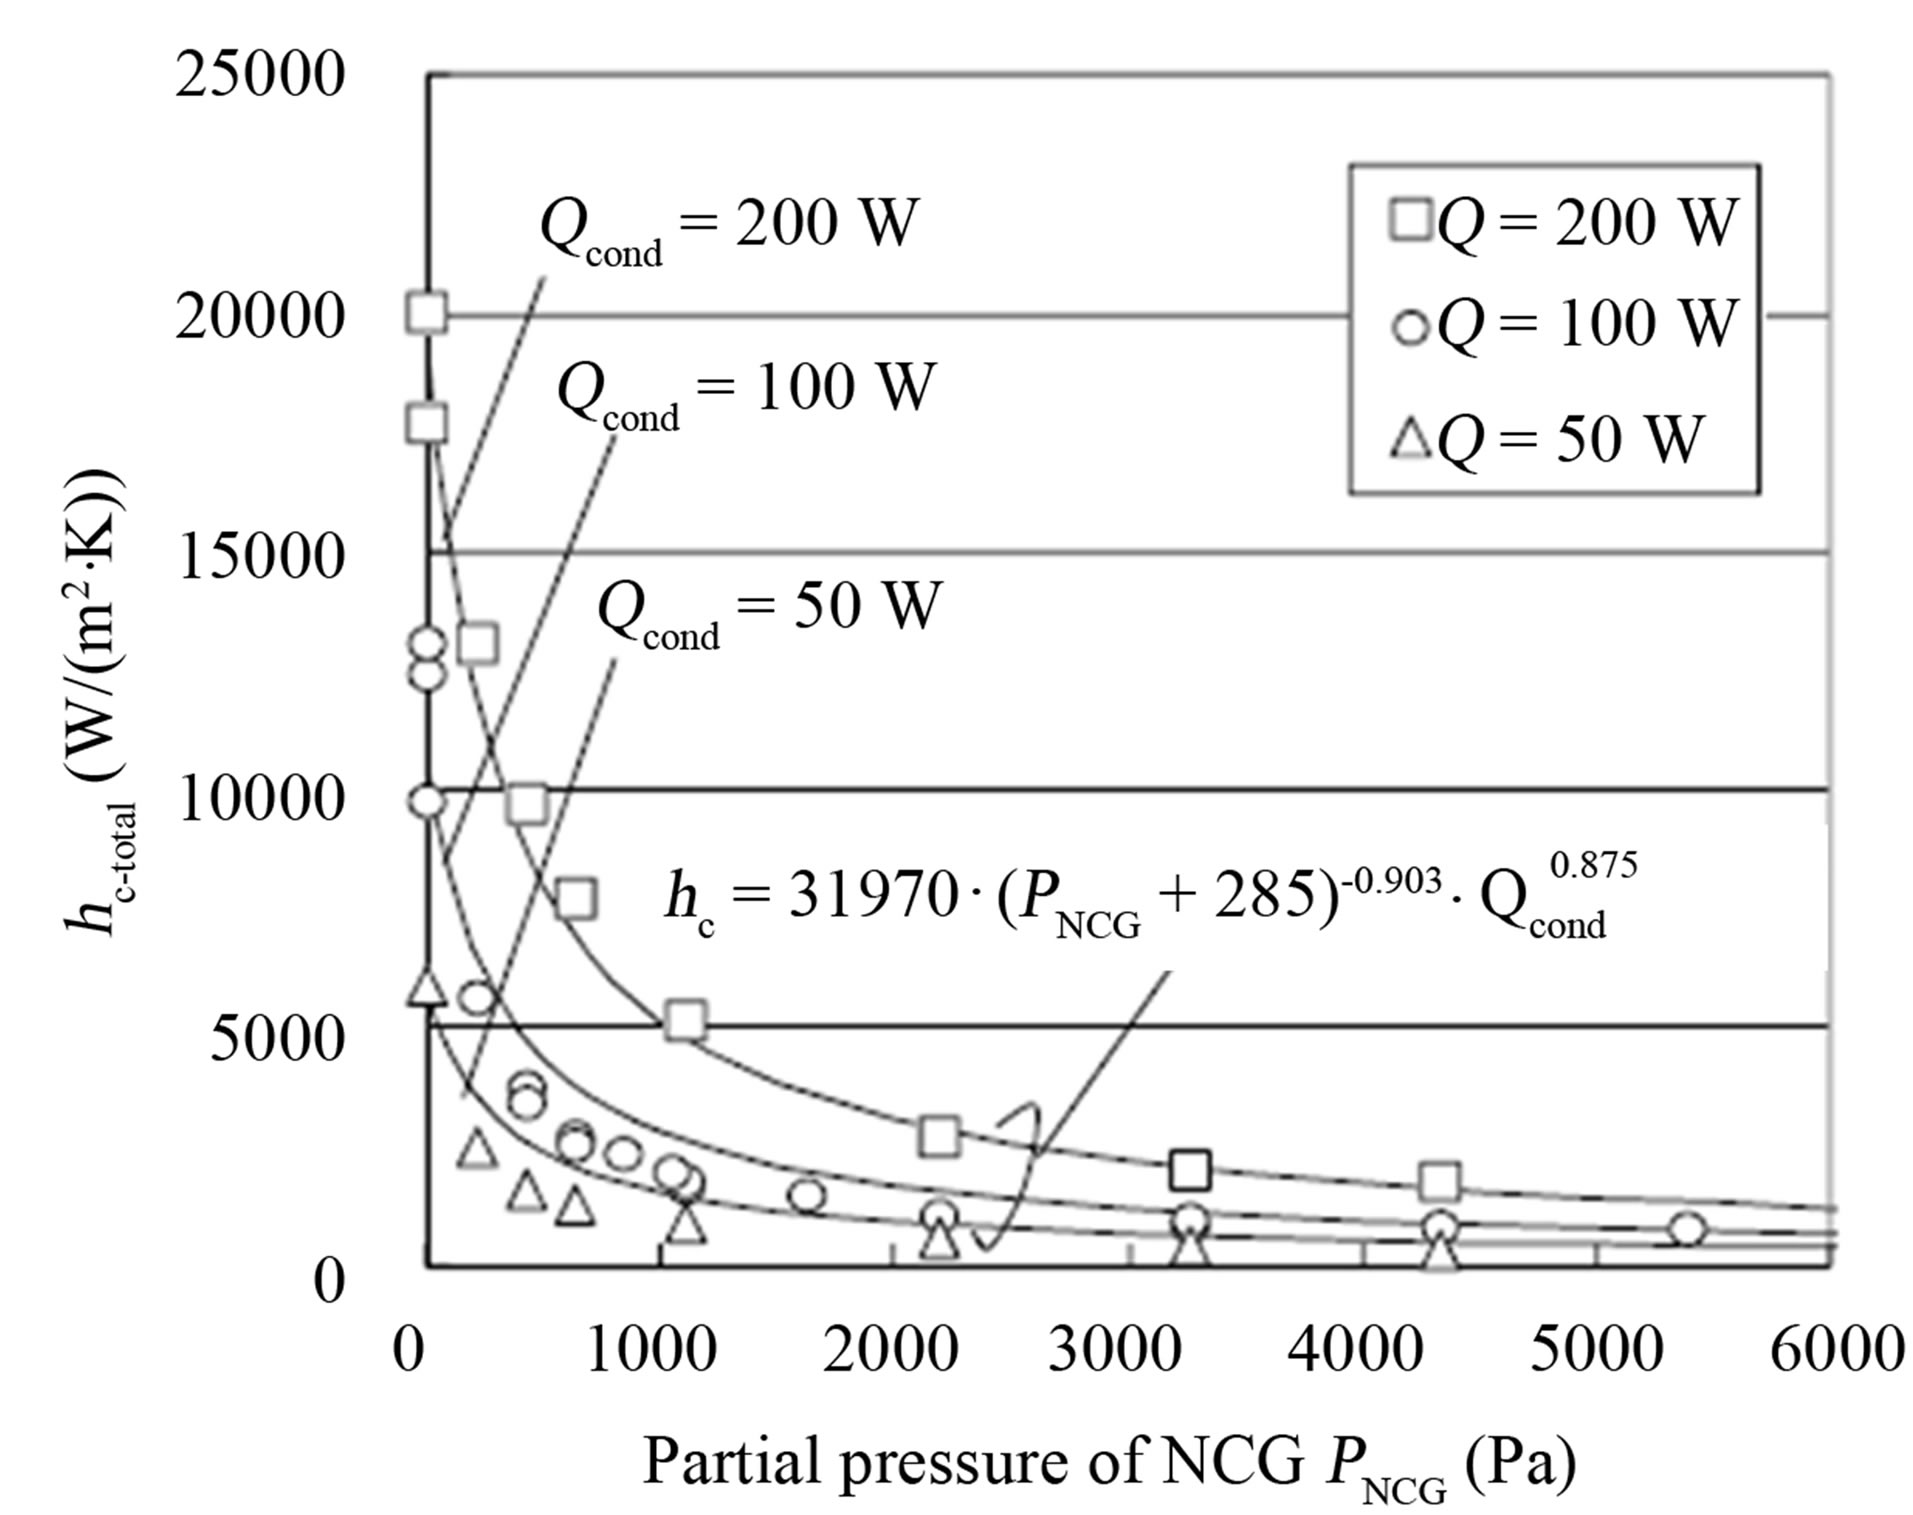
Figure 4. Relation between condensation heat transfer coefficient and partial pressure of NCC.
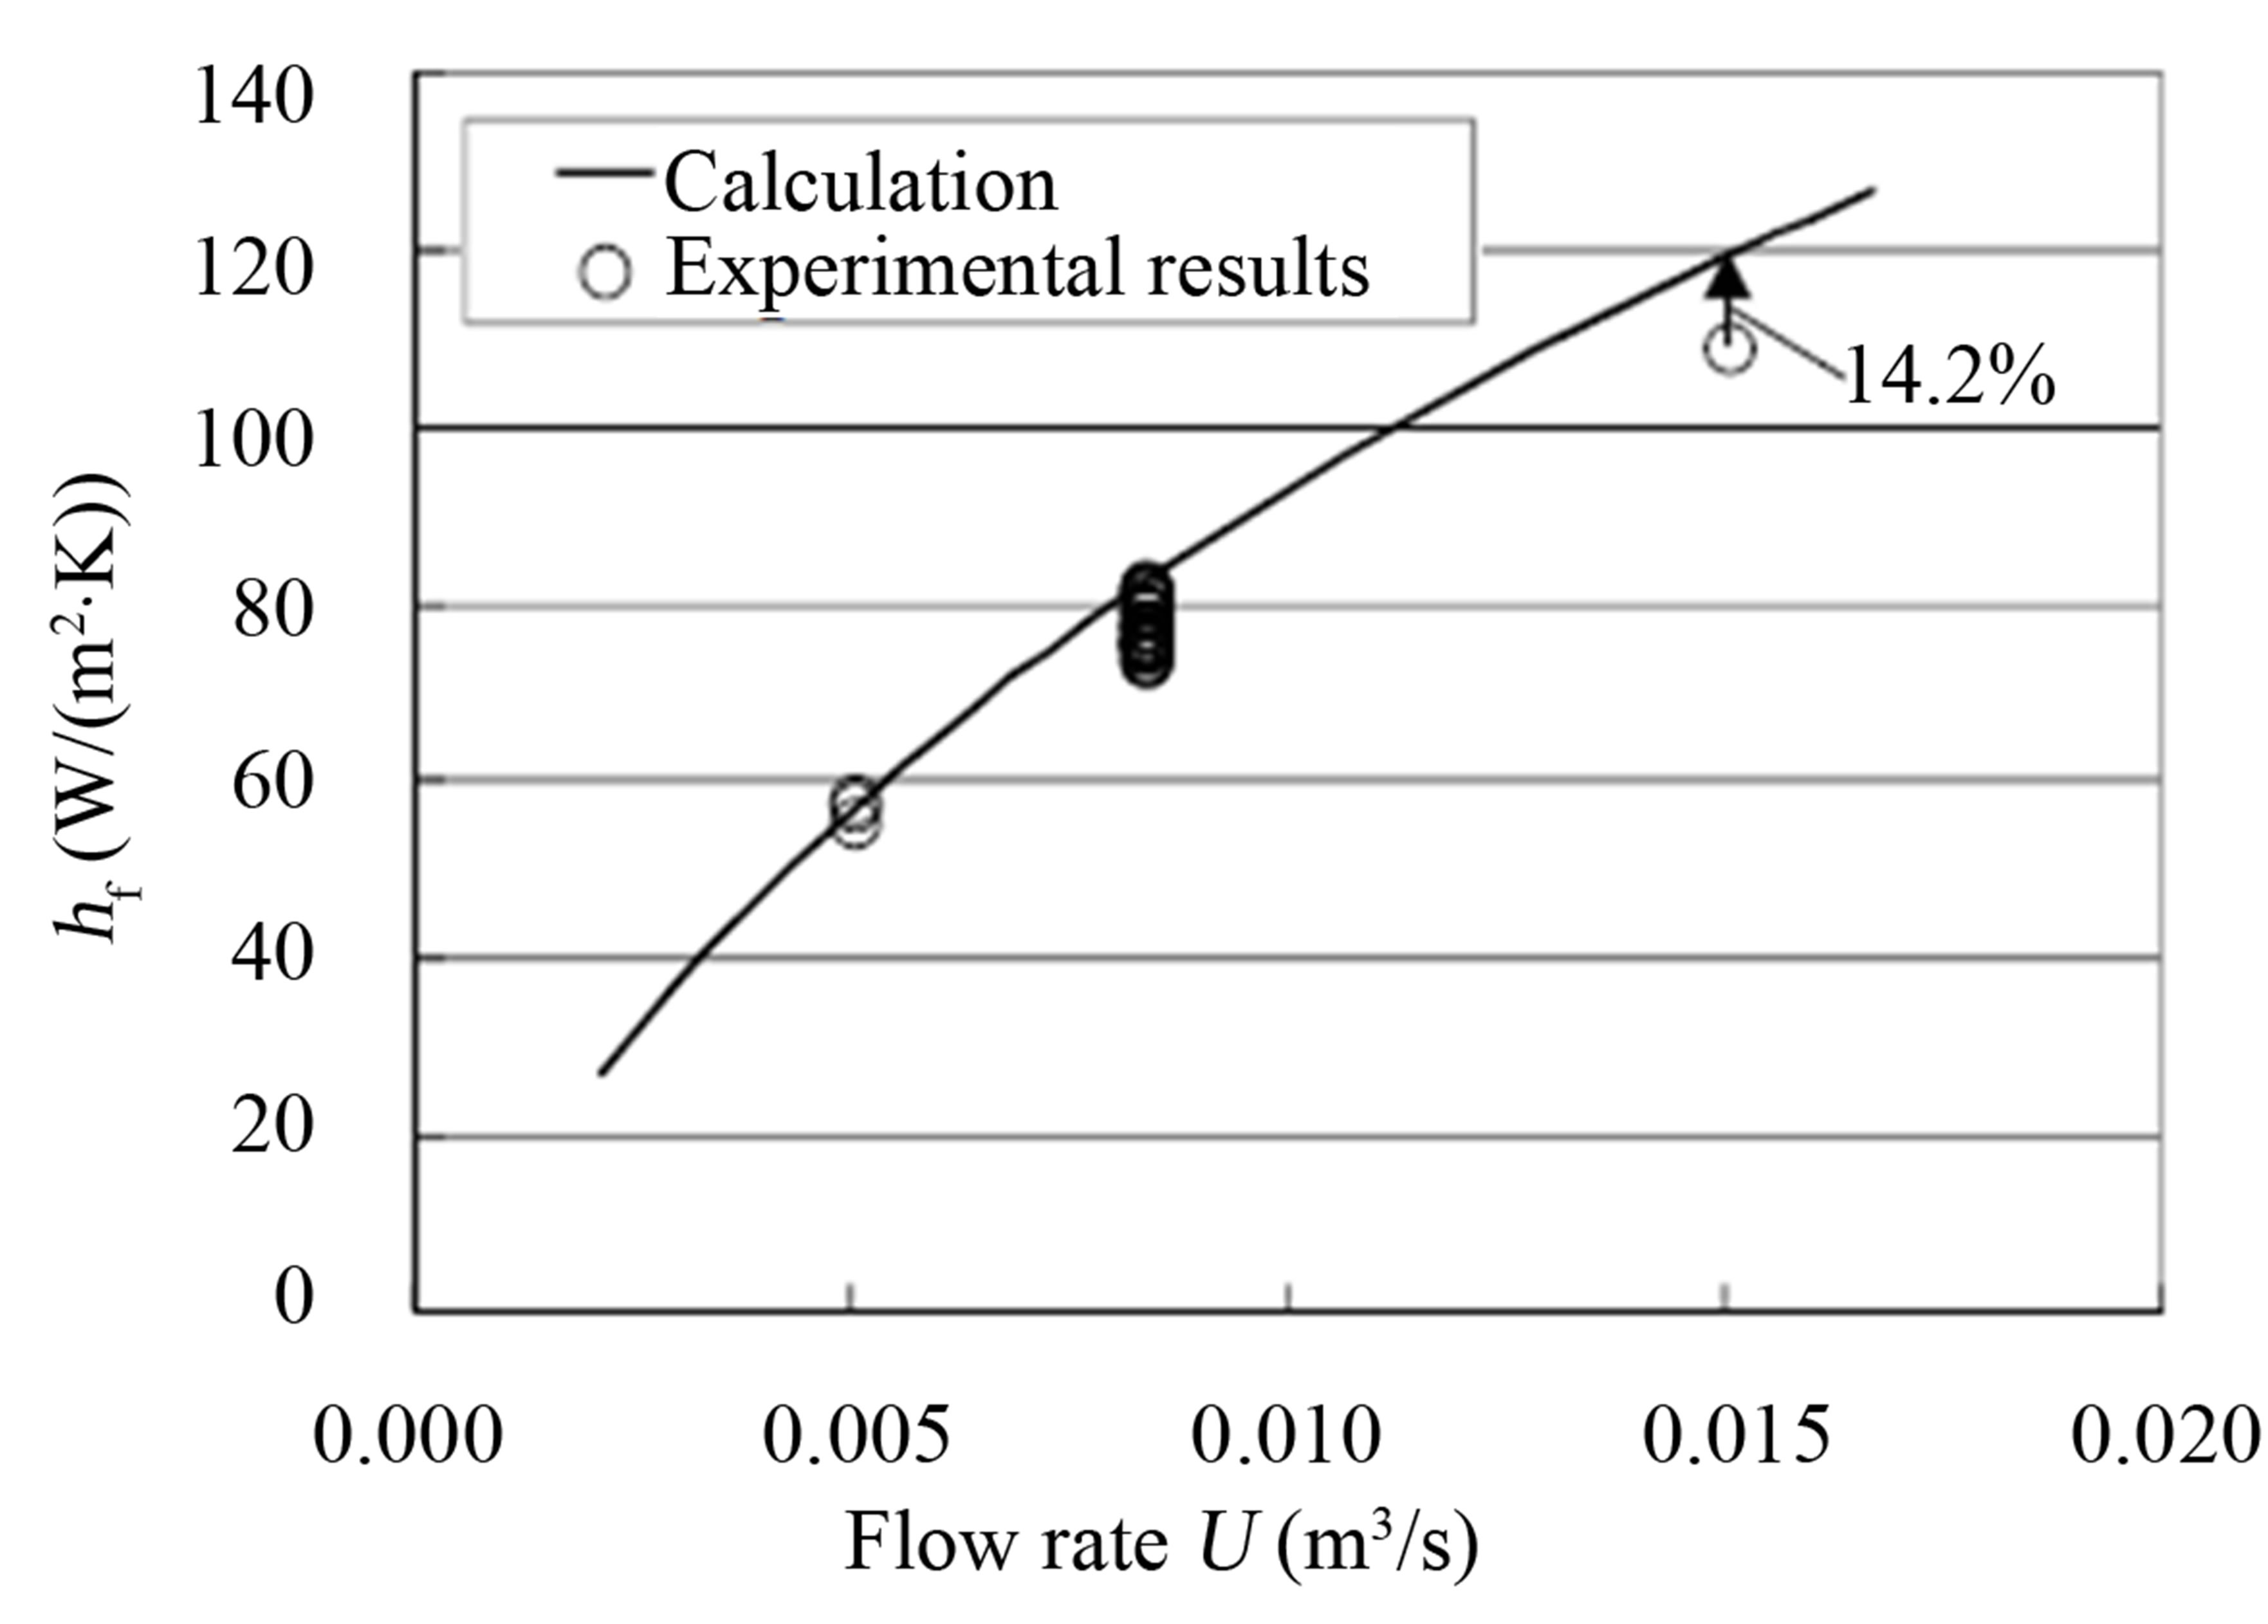
Figure 5. Heat transfer coefficient of offset fins.
3.3. Heat Leakage from Thermosyphon
The condensation heat transfer Qcond is less than amount of the input heating Q because of heat leakage from the thermosyphon. The fraction of this difference was 0% - 8% when the NCG pressure was 0 - 1 kPa and 10% - 19% when the NCG pressure was 1 - 5.5 kPa. We obtained an expression of the approximation of the heat leakage (Q-Qcond) as a function of the temperature difference of the vapor temperature, the cooling air temperature (Tv-Ta-in), and the air flow rate U from our experimental data by the following equation.
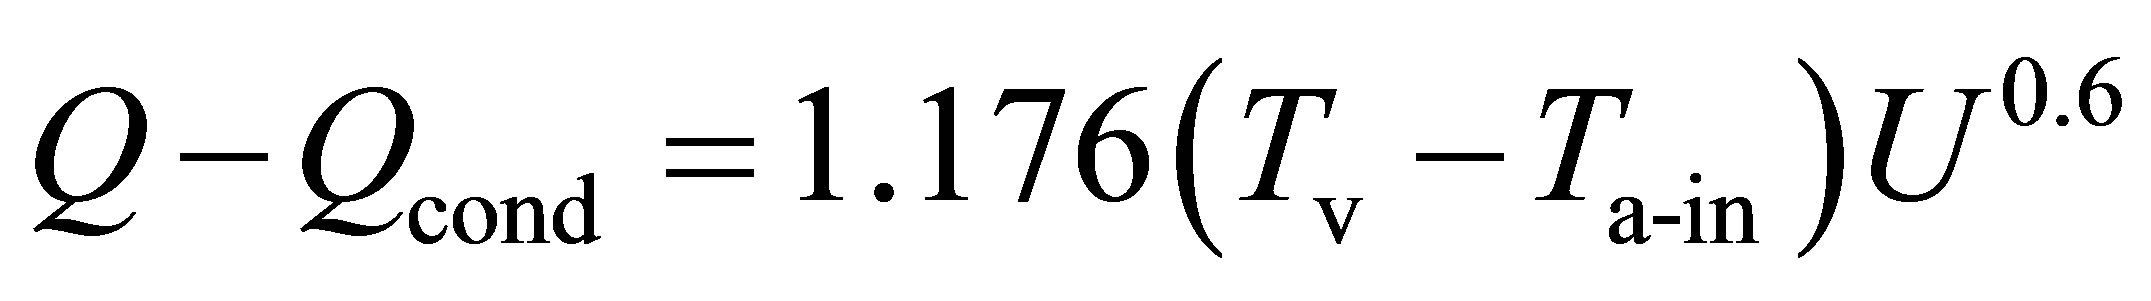 (6)
(6)
3.4. Total Thermal Resistance of Thermosyphon
The total thermal resistance θ of the thermosyphon is defined by the following equation.
 (7)
(7)
Here, Q is the amount of input heating, Te is the evaporation surface temperature, and Ta-in is temperature of the cooling air in front of the condenser. Using the abovementioned approximations, we can predict the total thermal resistance θ of the thermosyphon for given values of the partial pressure of NCG (PNCG), the amount of input heating Q, the temperature of the cooling air in front of the condenser Ta-in, and the air flow rate U. The predicted and experimental results of the total thermal resistance of the thermosyphon for the air flow rate U = 0.008 m3/s are shown in Figure 6. The difference between the experimental results and the prediction is 8% - 17%, which is good enough for the design of the thermosyphon.
4. Long Term Change of Cooling Performance Due to NCG Leakage
Here, by using the above-mentioned results, the thermal design approach for thermosyphons with slight NCG leakage is shown as follows. First, we predict the amount of partial pressure of NCG (PNCG) in the thermosyphon after 10 years with a constant leakage rate rleak and amount of dissolved NCG in injected water (DO). The leakage rate rleak gives the amount of molecules that flow into the thermosyphon when the inside is a vacuum and the outside pressure is atmospheric pressure Pa. Assuming that the leakage rate is proportional to the difference between the inner pressure P0 and the external pressure Pa, the following expression is obtained.
 (8)
(8)
Therefore, the inner pressure of the thermosyphon after t seconds is given by the following equation.
 (9)
(9)
Here, Pd is the initial partial pressure of the dissolved NCG in injected water, and Pv is the saturation vapor pressure at 25˚C. The calculation result of the amount of partial pressure of NCG (PNCG) is shown in Figure 7. The amount of dissolved NCG in injected water (DO) in Figure 7 means the amount of dissolved oxygen in water before injection into the thermosyphon. Also, we assumed that the amount of the dissolved nitrogen was twice that of dissolved oxygen. It was assumed that all the dissolved gases were discharged into the thermosyphon, and we predicted the amount of NCG discharged from the injected water.
Using Figures 6 and 7, we can predict the change in cooling performance of a thermosyphon with NCG leakage. Figure 8 shows three examples of the relation between the total thermal resistance and the elapsed years for the amount of heat input heating Q = 100 W. For the situation A (the leak rate rleak = 3 × 10⁻⁹ Pa-m3/s, dissolved oxygen DO = 2 mg/L, and air flow rate U = 0.008
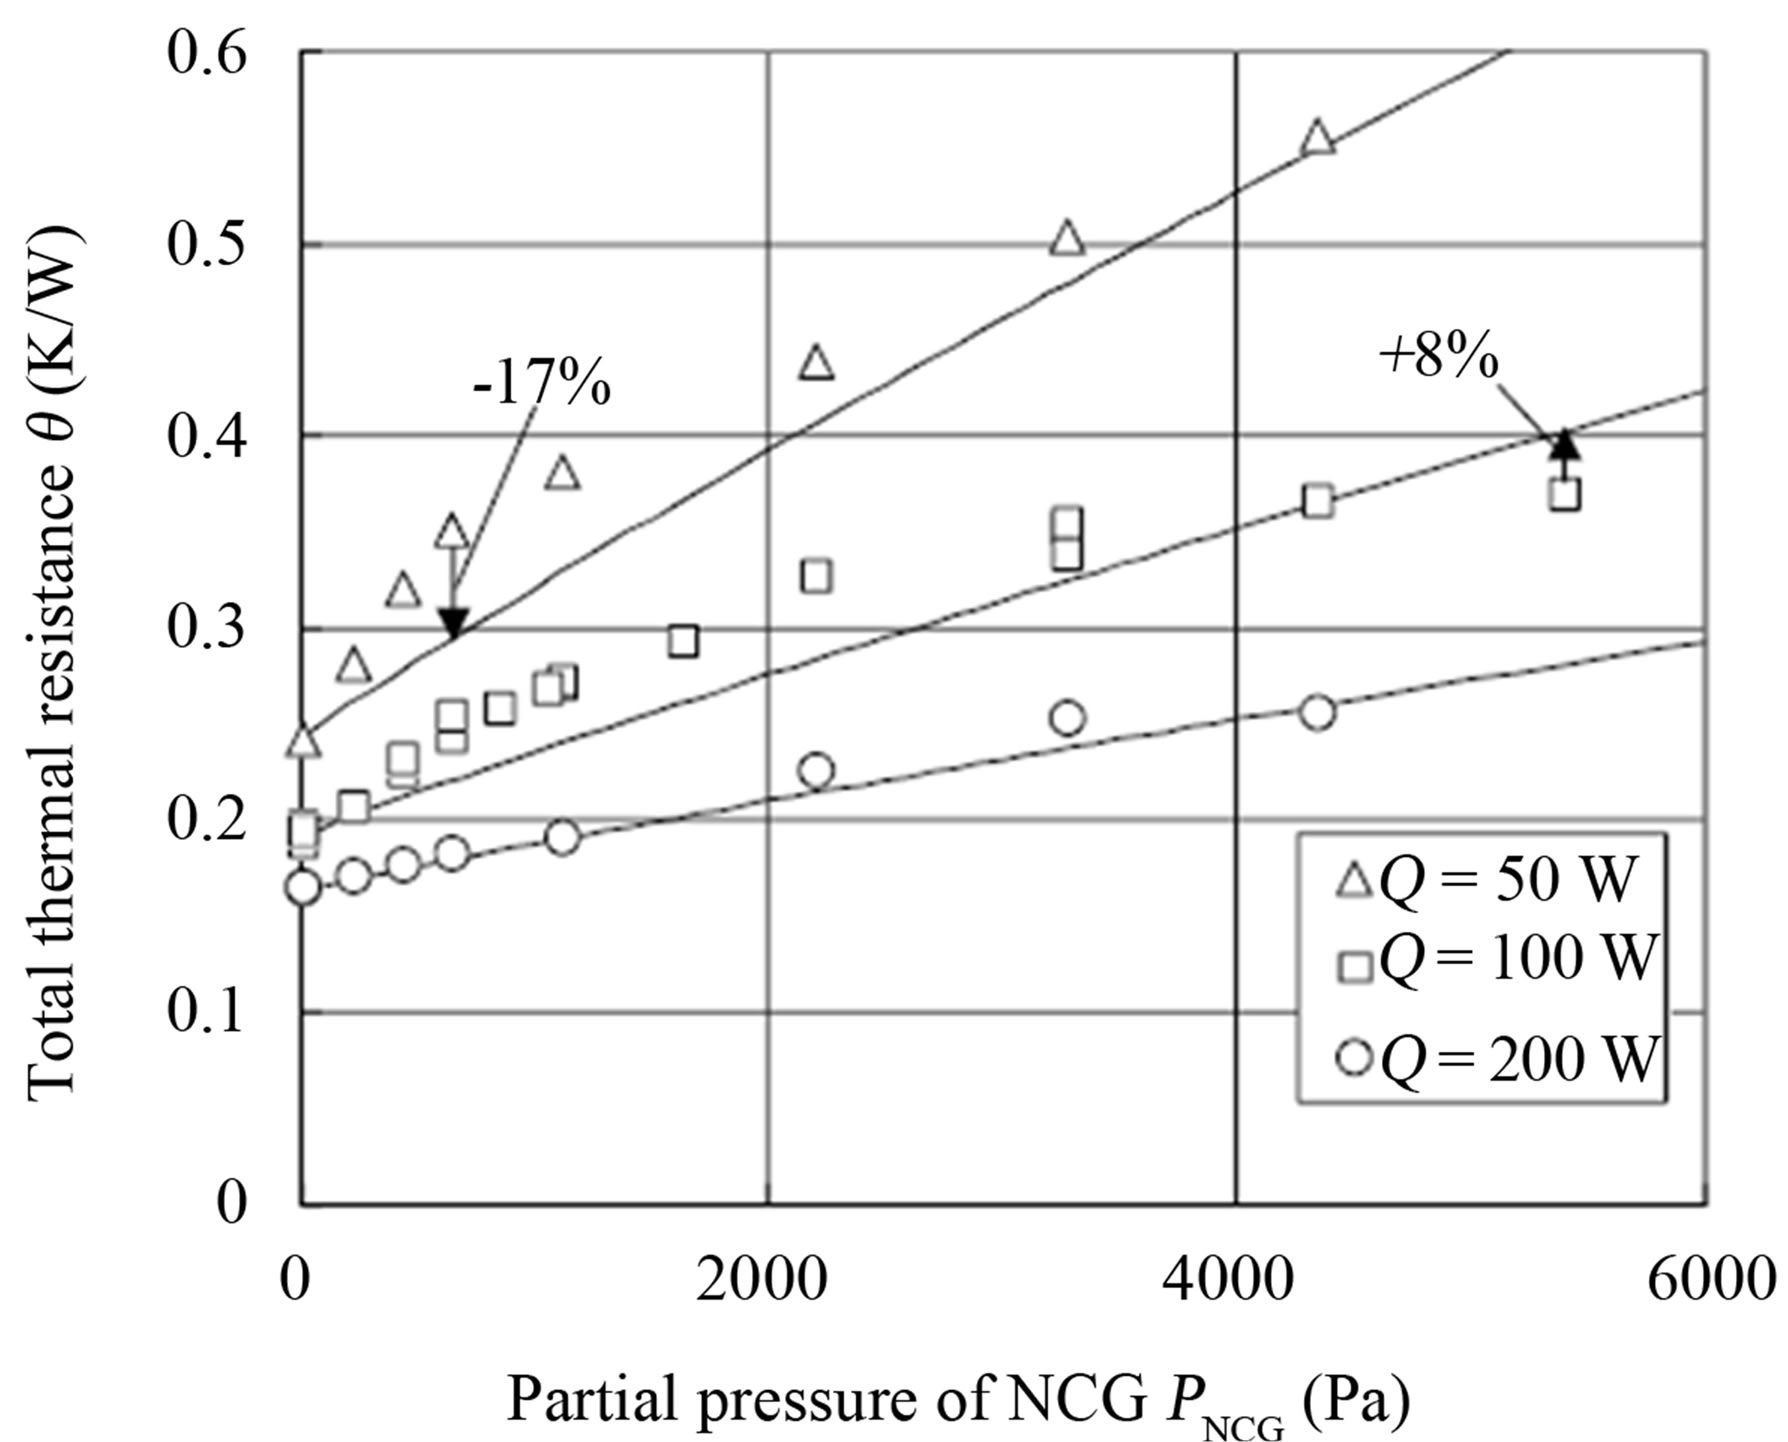
Figure 6. Total thermal resistance of thermosyphon.
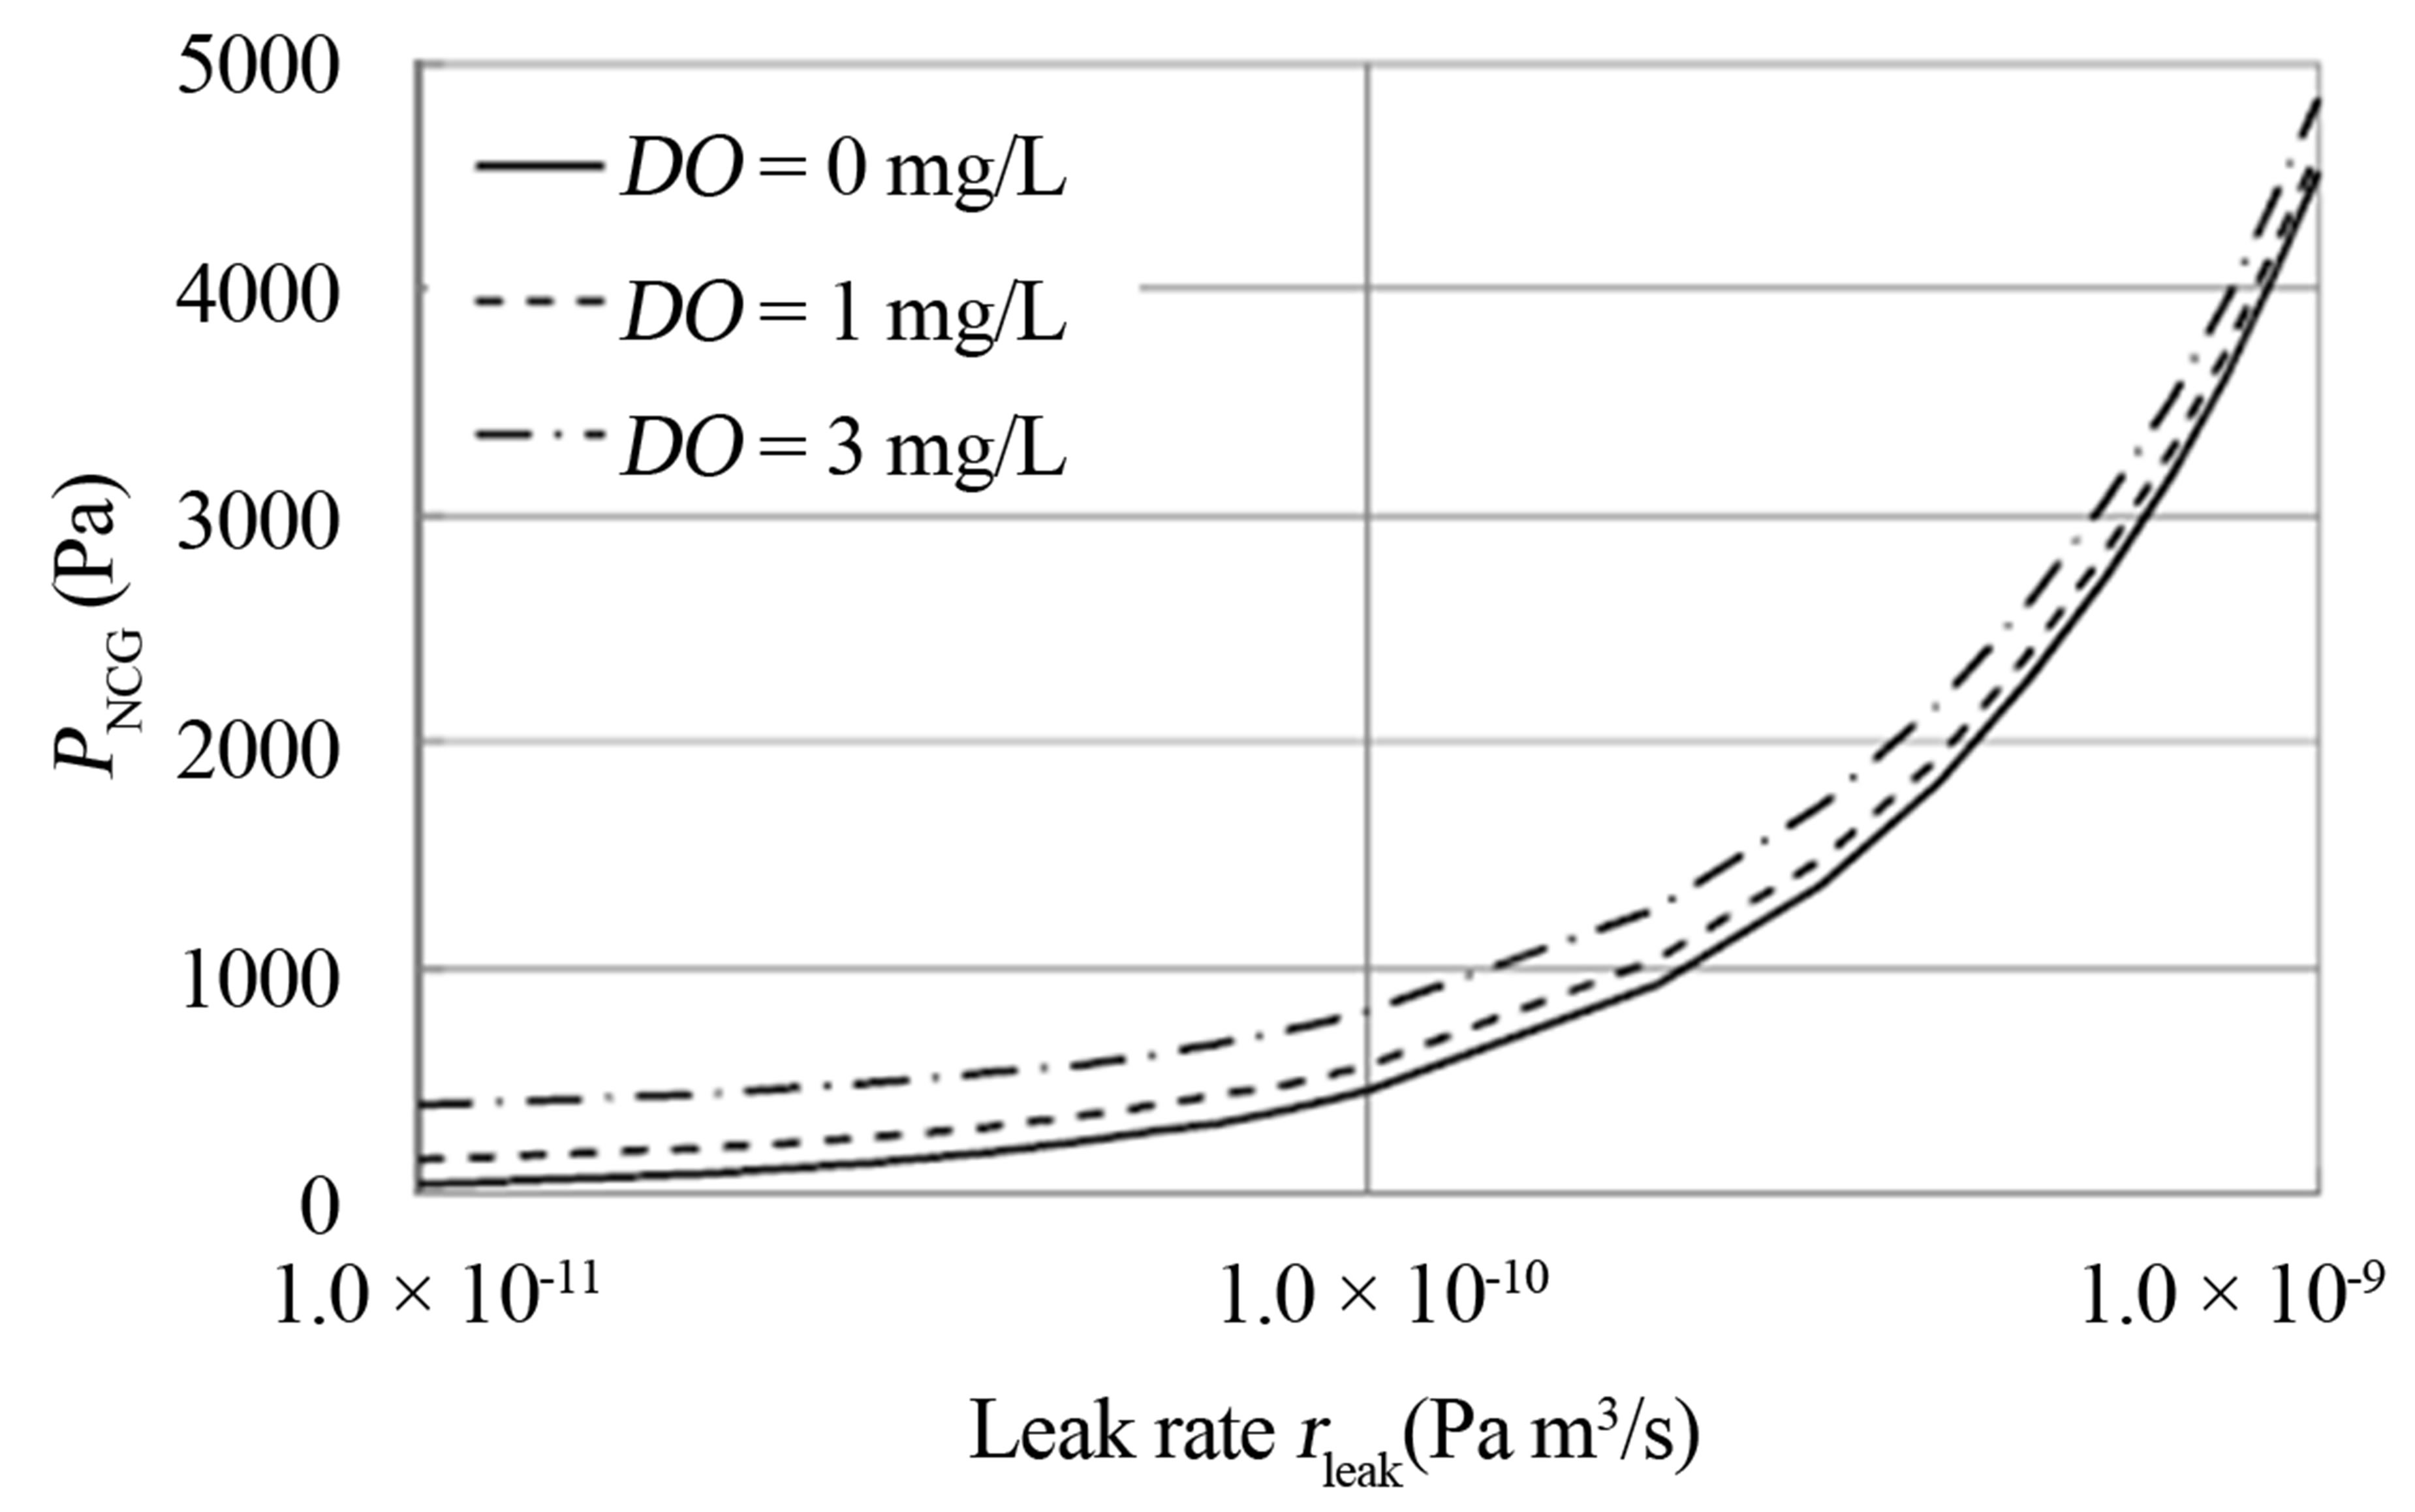
Figure 7. Partial pressure of NCG after 10 years.

Figure 8. Relation between total thermal resistance and elapsed years.
m3/s), the total thermal resistance θ was over 0.25 K/W after 10 years. The total thermal resistance after 10 years increased by 25% of the initial value. When the dissolved oxygen DO = 0 mg/L as in situation B, the total thermal resistance θ was less than 0.25 K/W after 10 years. When the air flow rate U = 0.015 m3/s in situation C, the total thermal resistance θ was also less than 0.25 K/W after 10 years. We proposed a new design method for a thermosyphon with a guaranteed level of cooling performance for a long time.
5. Conclusions
We measured the heat transfer performance of a loop thermosyphon with non-condensable gas (NCG), and the resultant performances were expressed as approximations. Then, we proposed a design method for a thermosyphon with a guaranteed level of cooling performance for a long time. We obtained the following results:
1) The predicted total thermal resistance of the thermosyphon using the obtained approximations agreed with the experimental results within an error of 8% - 17%.
2) The total thermal resistance of the thermosyphon increased by 25% after 10 years when leakage rate rleak = 3×10⁻⁹ Pa-m3/s, dissolved oxygen DO = 2 mg/L, and air flow rate U = 0.008 m3/s.
3) Although there was a slight leakage in the thermo syphon, we were able to design a thermosyphon with a guaranteed level of cooling performance for a long time using the proposed design method.
REFERENCES
- H. Toyoda, T. Nakajima, Y. Kondo, A. Idei and S. Sato, “A Design for Loop Thermosyphon including Effect of Non-Condensable Gas,” Proceedings of ASME/JSME 2011 8th Thermal Engineering Joint Conference, AJTEC2011- 44244, 2011.
- H. Toyoda, Y. Kondo, S. Sato and S. Tsubaki, “Effects of Non-Condensable Gases on Heat Transfer Performance of Loop Thermosyphon for CPU Cooling,” Transactions of Japan Society of Mechanical Engineers, Series B, Vol. 8, No. 759, 2012, pp. 2030-2045 (in Japanese). http://dx.doi.org/10.1299/kikaib.78.2030
- V. Dube, A. Akbarzadeh and J. Andrews, “The Effects of Non-Condensable Gases on the Performance of Loop Thermosyphon Heat Exchangers,” Applied Thermal Engineering, Vol. 24, No. 16, 2004, pp. 2439-2451. http://dx.doi.org/10.1016/j.applthermaleng.2004.02.013
- P. Naphon and S. Wongwises, “Experimental Study of Jet Nanofluids Impingement System for Cooling Computer Processing Unit,” Journal of Electronics Cooling and Thermal Control, Vol. 2, No. 3, 2011, pp. 38-44. http://dx.doi.org/10.4236/jectc.2011.13005
- M. M. Mohamed and M. A. A. El-Baky, “Air Cooling of Mini-Channel Heat Sink in Electronic Devices,” Journal of Electronics Cooling and Thermal Control, Vol. 3, No. 2, 2013, pp. 49-57. http://dx.doi.org/10.4236/jectc.2013.32007
- R. L. Webb and S. Yamauchi, “Test Results on a ThermoSyphon Concept to High-Power Cool Desktop Computers and Servers,” Proceedings of 18th IEEE SEMI-THERM Symposium, 2002, pp. 151-158.
- A. Samba, H. L. Gualous, S. L. Masson and D. Nörterhäuser, “Two-Phase Thermosyphon Loop for Cooling OutDoor Telecommunication Equipments,” Applied Thermal Engineering, Vol. 50, No. 1, 2013, pp. 1351-1360. http://dx.doi.org/10.1016/j.applthermaleng.2012.05.023
- S. S. Kutateladze, “US AEC Rep., AEC-tr-3770,” 1952.
- R. M. Manglik and A. E. Bergles, “Heat Transfer and Pressure Drop Correlations for the Rectangular Offset Strip Fin Compact Heat Exchanger,” Experimental Thermal and Fluid Science, Vol. 10, No. 2, 1995, pp. 171-180. http://dx.doi.org/10.1016/0894-1777(94)00096-Q
NOTES
*Corresponding author.