Journal of Electronics Cooling and Thermal Control
Vol. 2 No. 2 (2012) , Article ID: 19750 , 15 pages DOI:10.4236/jectc.2012.22002
Design Methodology for the Micronozzle-Based Electrospray Evaporative Cooling Devices
1Mechanical Engineering, University of Washington, Seattle, United States
2Electrical Engineering, University of Washington, Seattle, United States
Email: hsiuchew@u.washington.edu, mamishev@ee.washington.edu
Received April 19, 2012; revised May 23, 2012; accepted May 29, 2012
Keywords: Electrospray Cooling; Microelectronics; Microfluidic Chamber; Electrostatic Field
ABSTRACT
Thermal management of microelectronics demands higher heat flux removal capabilities due to the rapid increase in component and heat flux densities generated by integrated circuits (ICs). Electrospray evaporative cooling (ESEC) is a potential package-level thermal management solution for the next generation of microelectronics. In this paper, a design methodology is presented using numerical electrostatic field modeling to indirectly design proof-of-concept, micronozzle-based ESEC chambers. The results of the numerical modeling and heat transfer experiments indicate that the potential distribution near the micronozzle tip of the ESEC chamber dominates the heat transfer performance of ESEC cooling devices. The surface charge density at the micronozzle tips has a minor impact on the heat transfer performance. The maximum enhancement ratio of 1.87 was achieved by the 8-nozzle ESEC chamber at the lowest heat flux investigated, indicating that the heat transfer capability of ESEC chambers declines as the heat source density increases. The study demonstrates that increasing the number of micronozzles and decreasing the flow rate per nozzle may not effectively improve the heat transfer performance of ESEC devices.
1. Introduction
The thermal management of microelectronics faces a critical challenge because of rapid technology advancements, which have led to enormous component densities and heat flux generation, leaving very little physical room for thermal engineers to work. Although conventional rotary fan cooling technology has been widely adopted for industrial users and consumers due to its simplicity for large form factor electronics, it is no longer considered a viable thermal management solution for advanced microelectronics.
Liquid-driven technologies, such as spray cooling [1- 3], liquid jet cooling [4,5], microchannels [4-13], and micro pumps [4,14-21] have been widely investigated due to their high heat flux removal capabilities. Among liquid cooling technologies, spray cooling [1,2] remains to be one of the most promising cooling solutions. However, several technological barriers for conventional spray cooling technology still exist, including: the need of a high performance mechanical pump for the fluid atomization processes, limited droplet transportation abilities, and poor droplet size control.
Electrospray evaporative cooling (ESEC), which relies on Coulomb forces for energy-efficient fluid atomization, has great potential to precisely control the formation of droplet sizes and droplet distribution, and hence, can be adapted to create a uniform temperature over the surfaces of electronic devices. In the past, the electrospray technology was primarily used for applications in areas, such as: mass spectroscopy [22-24], microthrusters [23], and nanofibers [25]. The application of electrospray in heat transfer thermal management of electronics is currently limited. Feng and Bryan [26] investigated the heat transfer performance enhancement through the application of electrohydrodynamics (EHD) on traditional impinging liquid jets over a thermal exchange surface by using cooling chambers of different numbers of capillary tubes in an enclosed cooling loop system. Their experimental results show that the application of the potential on the traditional impinging liquid jets can enhance the heat transfer rate of the cooling chamber by approximately 1.7. Better enhancement of the heat transfer rate is also achieved by the chamber with multiple capillary tubes at a lower heat flux condition. Wang and Mamishev [27] have achieved a maximum enhancement ratio (defined in Equation (8)) and heat removal ratio of 1.61% and 61%, respectively, with an ESEC device utilizing four micronozzles. The corresponding calculated heat dissipation and convection heat transfer coefficients were 123.19 W/cm2 and 3.99 W/cm2∙K, respectively. The investigation also shows that increasing the number of micronozzles and decreasing the flow rate per nozzle is an effective way of improving the heat transfer performance of ESEC chambers.
Deng and Gomez [28] have achieved a heat dissipation of 96 W/cm2 with a cooling efficiency of 97% by operating a microfabricated multiplexed electrospray system (MES) in cone-jet mode. The MES uses 19 and 37 nozzles with a packing density of 253 nozzles/cm2. The results suggest that increasing the number of electrospray nozzles per unit area is feasible for cooling microelectronics in a broad range of applications.
Although the cooling capability of ESEC chambers over a CPU-sized thermal exchange surface has been demonstrated experimentally, a potential methodology to estimate the thermal management characteristics of these devices has not yet been presented. One way to design ESEC chambers is to use multiphysics modeling; however, there are still many aspects of the electrospray processes that have not been thoroughly investigated, and therefore, are not well understood. For example, the physics behind a mechanism triggering transitions between different electrospray modes [29] are not understood as a whole. Therefore, we believe that the evaluation of the thermal management characteristic of ESEC devices through numerical electrostatic field modeling is an appropriate and potential tool for design assistance.
The purpose of this paper is to present a methodology to design the proof-of-concept micronozzle-based ESEC microfluidic chambers. This design methodology uses numerical electrostatic field modeling to indirectly estimate the heat transfer performance of three different ESEC microfluidic chambers. The heat transfer performance achieved by the designed ESEC microfluidic chambers, associated with their numerical electrostatic field strength near the tips of the ESECs’ micronozzles, is discussed as well.
2. Background
In the ESEC system, the working fluid is atomized through an electrospray technique, shown in Figure 1. When voltage is applied between the nozzles and the collecting electrode, charges within the fluid are forced to the fluid meniscus surface of each nozzle. As the applied voltage increases, the electrostatic field strength and the charge density at the surface increases as well. The Coulomb forces acting on the charges in the fluid cause the fluid meniscus to deform into the shape of a Taylor cone [30-32]. At the critical electrostatic field intensity, the forces on the charged fluid in the Taylor cone overcome the intra-molecular forces of the fluid, such as viscosity, surface tension, and liquid momentum,
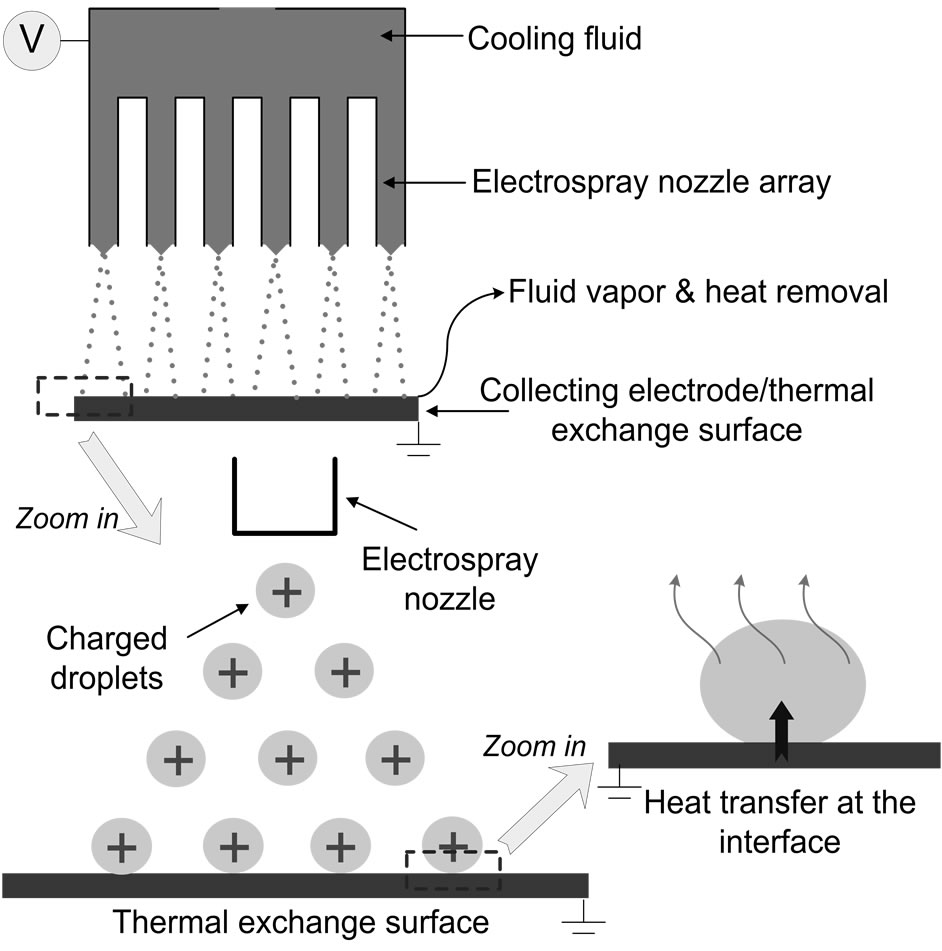
Figure 1. Schematic diagram of the fluid atomization and heat transfer mechanism of the ESEC device using an ESEC microfluidic chamber.
and a jet of charged liquid is then sprayed from the tip of the cone. The break-up of the charged fluid expelled from the tip of the fluid cone repel each other, generating fine aerosol droplets. Those charged droplets are then accelerated by the electrostatic force toward the collecting electrode surface. The collecting electrode, as shown in Figure 1, doubles as the thermal exchange surface. As a result, two-phase heat transfer occurs at the thermal exchange surface, dissipating large amounts of heat because of the droplet’s phase change from liquid to vapor.
3. Design Procedures
3.1. Numerical Modeling of the Electrostatic Field
3.1.1. Model Geometry
The geometry of the ESEC devices for electrostatic field simulations was designed following the existing microfluidic chamber prototype in our laboratory. The detailed geometry of the ESEC microfluidic chamber is shown in Figure 2. The flow rate per nozzle was relatively low compared to the rate of conventional spray cooling technologies; to achieve considerable heat transfer performance, 1-nozzle, 4-nozzle, and 8-nozzle microfluidic chambers, as shown in Figure 3, were designed.
The microfluidic chambers were made of polycarbonate. The inner diameter, the height, and the thickness of the chamber was 20 mm, 20 mm, and 2 mm, respectively. One side of the microfluidic chamber was fitted with a circular copper plate with 1, 4, or 8 microchannels fabricated through each copper plate, in three chambers.
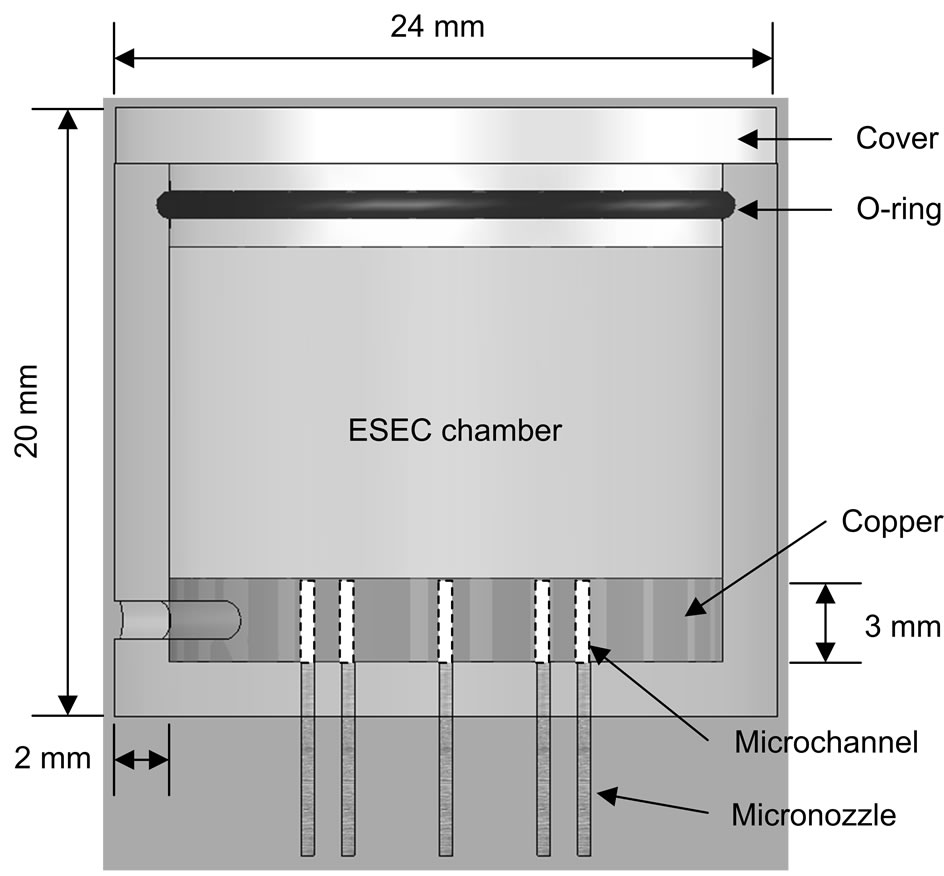
Figure 2. Schematic diagram showing the geometry and the components of the ESEC microfluidic chamber.
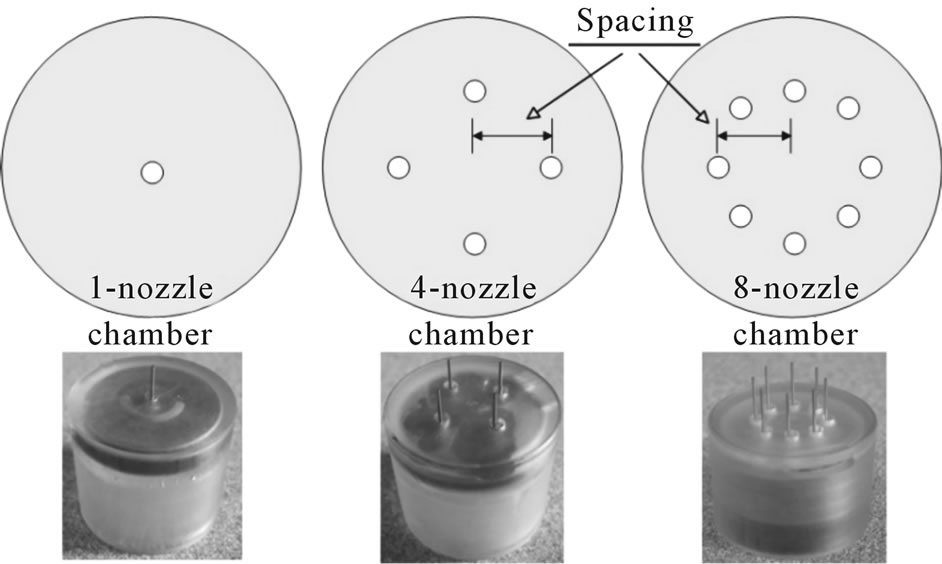
Figure 3. The bottom view and arrangement of the micronozzles of the three different kinds of ESEC microfluidic chambers. The spacing of the 4-nozzle chamber and 8-nozzle chamber is 5 mm between the centerline of the chamber and the centerline of one of micronozzles.
Microchannels were connected by stainless steel micronozzles with an inner diameter (Di) of 210 µm, an outer diameter (Do) of 410 µm, and a length of 6.98 mm.
According to our previous experimental results [27], a high heat transfer enhancement was achieved at a distance of 7.5 mm between the tips of the micronozzles and the thermal exchange surface; therefore, this distance was adopted as a fixed distance for the numerical modeling and experimental investigation.
3.1.2. Governing Equations
The classic Poisson’s equation is derived from the combination of the definition of potential from Gauss’s law and the equation of continuity. Under static conditions, the electrical potential, V, is defined by the relationship
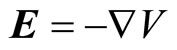 (1)
(1)
where E is the electrostatic field. The electrical displacement field, D, can be expressed as
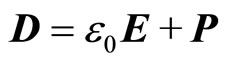 (2)
(2)
where ε0 and P are permittivity of the vacuum and the electrical polarization, respectively. By combining Equation (1) and Equation (2), Gauss’s law can be modified as Poisson’s equation by the constitutive relationship between E and D.
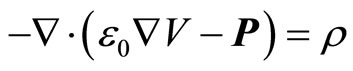 (3)
(3)
where ρ is space-charge density. For the axisymmetric electrostatics application mode, since the field and geometry are axially symmetric, the electrical potential is constant in the φ direction, implying that the electrostatic field is tangential to the rz-plane. In cylindrical coordinates, when multiplying Equation (3) by r to avoid singularities at r = 0, the equation becomes
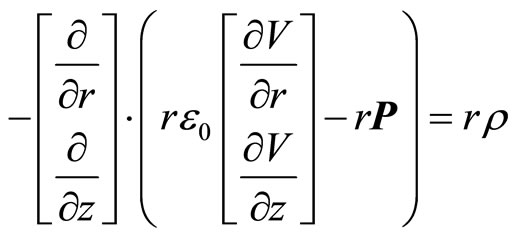 (4)
(4)
3.1.3. Boundary Conditions
The geometry of the electrostatic field model of the ESEC microfluidic chamber was established in the COMSOL AC/DC module with three different boundary conditions applied to the boundary of the model, including zero charge/symmetry, ground, and specific electrical potential. Figure 4 indicates where the boundary conditions were applied to the components of the model.
The zero charge/symmetry boundary condition was applied to the exterior boundaries of the model to eliminate the effect of the geometry of the model on the simulation results. In addition, since the positive potential was adopted, the ground boundary condition was applied to the copper plate and the electric potential boundary condition was applied to an ESEC microfluidic chamber. The general physical meaning of these boundary conditions can be found in the user manual for the AC/DC module.
3.2. Modeling Result Analysis
3.2.1. Space Charge Distribution
Figures 5(a), (b), and (c), show the surface charge distribution over the tip of one of the micronozzles of the 1-nozzle, 4-nozzle, and the 8-nozzle ESEC chambers, respectively, at the applied potential of 7.0 kV. The results show that the surface charge distribution near the inner diameter of the micronozzle is more uniform, while it is highly non-uniform near the outer diameter of the micronozzle.
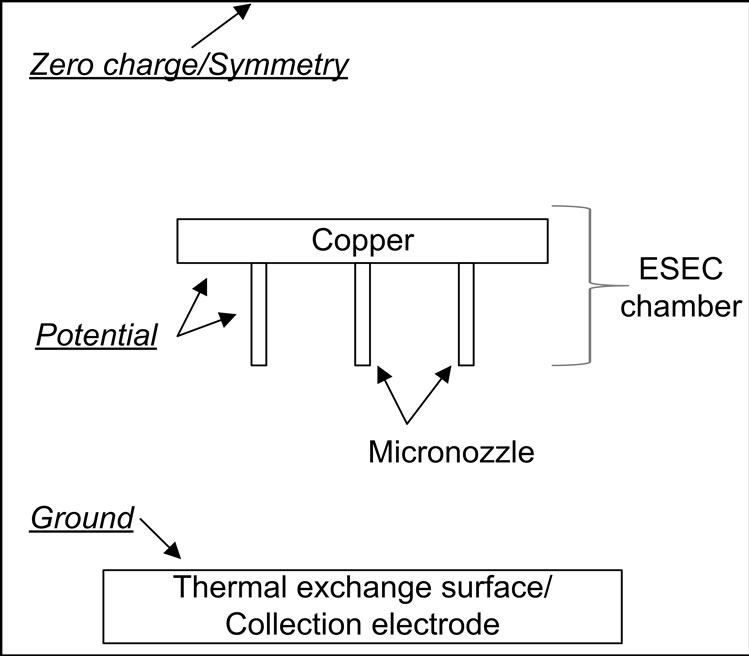
Figure 4. Schematic diagram showing the boundary conditions applied to the electrostatic field simulation model. The figure is not in scale.
Additionally, the higher surface charge distribution at the outer diameter of the micronozzle tip for the 1-nozzle microfluidic chamber is more uniform than those of the 4-nozzle and 8-nozzle ESEC chambers. The non-uniform distribution of the space charge over the micronozzle tips is mostly a result of the influence of the adjacent micronozzles. The relative geometric orientation among the micronozzles, the micronchannel-based copper plate, and the collection electrode directly under the micronozzles is also another factor influencing the distribution of the surface charge at the tip of the micronozzle of the ESEC chambers.
When an electrospray device is operated in the EHD multi-jet mode, the distribution of the droplet diameters are from submicron meters to several hundred micron meters [32]. Observing all of the electrified jets through photography becomes complicate. Figure 6 shows the multi-jet EHD functioning mode achieved by the 4-nozzle chamber at the applied potential of 7.0 kV and total flow rate of 2 cm3/hr. Three observable electrified ethyl alcohol jets are formed at the tip of one of the micronozzles of the 4-nozzle ESEC chamber. The number of the electrified jets observed is very close to the number of regions where local surface charge density is relatively higher, as shown in Figure 5(b).
Although the formation of the local higher surface charge density regions from the simulation results could explain the formation of the electrified jets of the multi-jet EHD mode, the actual number of the electrified jets from the experiments might not exactly match the simulation results because the model is assumed to be an ideal model. The experimental observation highly depends on the fabrication and integration processes of the components of the ESEC chambers. In addition, a slight deviation from the length of the micronozzles and the inclination angle between the tip of the micronozzles and the collection electrode is also the major factor affecting the
 (a)
(a)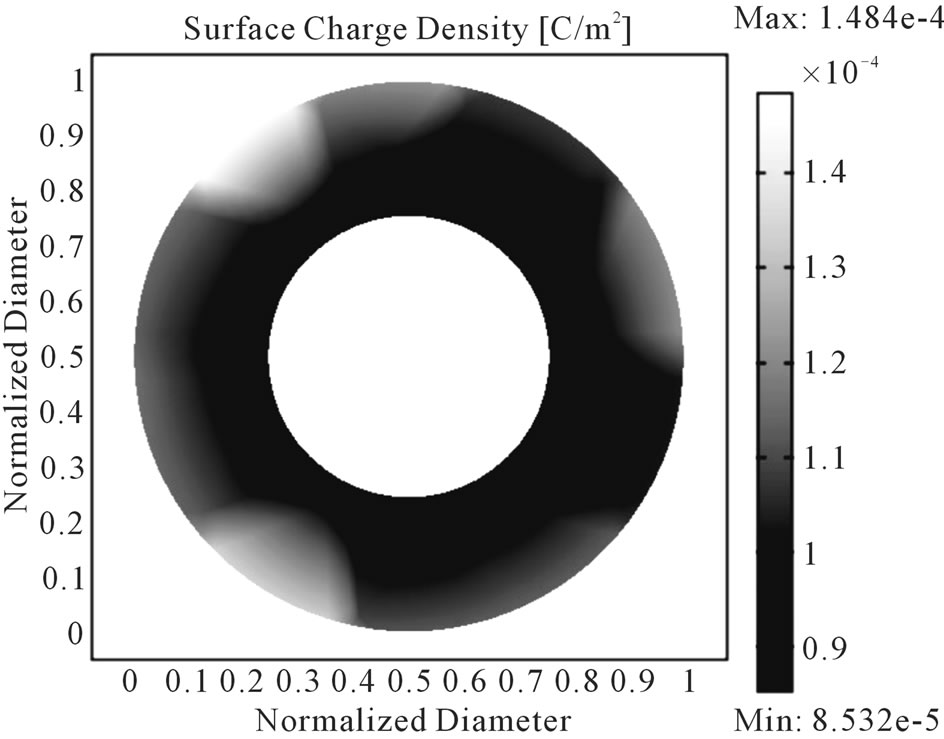 (b)
(b) (c)
(c)
Figure 5. Simulation results of the surface charge distribution at the tip of one of the micronozzles of the 1-nozzle, 4-nozzle, and 8-nozzle microfluidic chambers at the potential of 7.0 kV. (a) 1-nozzle microfluidic chamber; (b) 4-nozzle microfluidic chamber; (c) 8-nozzle microfluidic chamber.
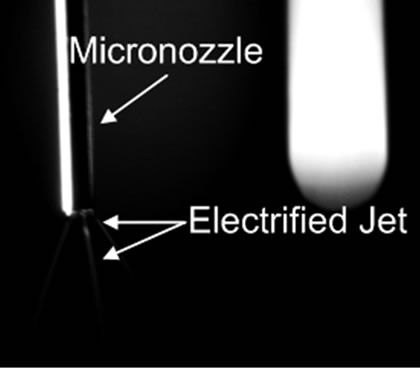
Figure 6. Multi-jet EHD mode of the 4-nozzle ESEC microfluidic chamber operated at the potential of 7.0 kV and the flow rate of 2 cm3/hr. Three obvious ethyl alcohol jets is electrified close to the tip of one of the micronozzles of the chamber. (color picture is available in digital copy).
EHD functioning mode near the tip of all the micronozzles. To obtain more accurate modeling results regarding the formation of the electrified jets, a complete multiphysics model, including electrostatics, fluid mechanisms, and heat transfer modes, is necessary.
Figure 7 shows the average surface charge at the tip of the micronozzle of three microfluidic chambers. As the applied DC potential is increased, the average surface charge is raised linearly for all three ESEC chambers. Additionally, although the average surface charge of the 1-nozzle and 4-nozzle chambers is almost identical, while that of the 8-nozzle chamber is relatively lower than the others, the total surface charge of the 8-nozzle chamber is the highest, indicating that more charges can be distributed to each nozzle to efficiently electrify the fluid at the tip of the nozzle. Furthermore, higher total surface charge at the tip of the micronozzles means more charge can be carried by the electrified droplets. The charged droplets with higher amounts of charge can be accelerated toward the thermal exchange surface, which induces the convective heat transfer rate near the thermal exchange surface, although the majority of the heat transfer is due to the phase change of the fluid on the thermal exchange surface.
3.2.2. Electrostatic Field Strength
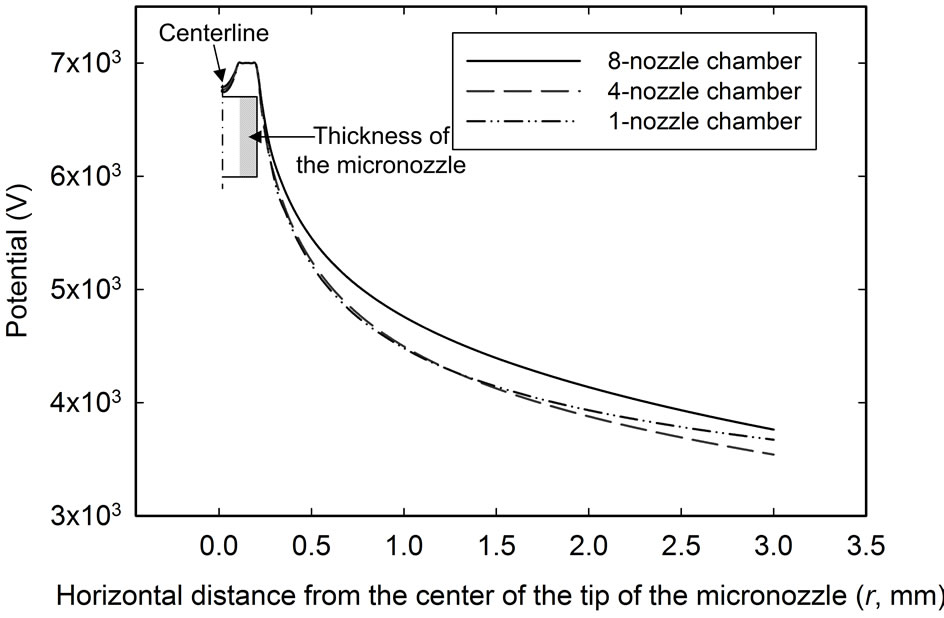
Figure 8(a) shows the numerical modeling results of the distribution of the potential of all three ESEC microfluidic chambers. This distribution of the potential lies along the r axis (defined in Figure 8(b)) from the center of the tip of one of the micronozzles, to the distance 3 mm away from the tip center in the radial direction of the chambers, parallel to the collection electrode. The applied potential is 7.0 kV for all three ESEC microfluidic chambers. The result shows that at a certain distance away from the centerline of the micronozzle, the 8-nozzle ESEC chamber still retains higher potential than the other two chambers. This is attributed to the fact that the effect of the adjacent micronozzles of the 8-nozzle ESEC chambers is stronger than that of the 4-nozzle ESEC chamber.

Figure 7. Simulation results showing the amount of the average surface charge at the tip of the micronozzles of each ESEC microfluidic chamber at different DC potential.
 (a)
(a)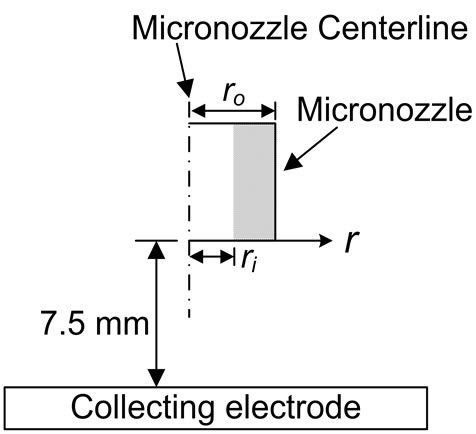 (b)
(b)
Figure 8. Simulation results showing the distribution of the potential of all three ESEC chambers from the center of tip of the micronozzle to the distance 3 mm away from the tip center in the radial direction of the chambers and the direction parallel to the collection electrode. The applied potential for these three ESEC microfluidic chambers is 7.0 kV. r0 and ri are the outer radius and inner radius of the micronozzle. (a) Simulation results; (b) Schematic showing where the electrostatic field is presented in (a).
Additionally, although the geometric orientation of the micronozzle centerlines between the 1-nozzle and 4-nozzle ESEC chambers and the respective ESEC chambers differ, Figure 8 indicates that the potential distribution of the 1-nozzle and 4-nozzle ESEC chambers in the horizontal direction is almost identical when the distance is within 1.5 mm. This phenomenon implies that, although there are four micronozzles within the 4-nozzle ESEC chamber, the electrostatic field of the individual micronozzle is almost the same as that of the 1-nozzle chamber. Therefore, the electrostatic field of each of the micronozzles of the 4-nozzle ESEC chamber near the outer diameter of the tip of the micronozzle can be regarded as an isolated unit.
However, when the distance is beyond 1.5 mm, the declining slope of the potential for the 4-nozzle and 8- nozzle chambers is almost the same, i.e., at a distance of 3.0 mm, shown in Figure 8(a). The decline slope is even larger than that of the 1-nozzle chamber. This is because of the geometric position of the micronozzle to the centerline of the ESEC chamber, as shown in Figure 3.
Therefore, the greater the amount of micronozzles used, the wider the equipotential distribution around the micronozzles. For example, the 5.0 kV potential for the 1-nozzle and 4-nozzle chamber is 0.5 mm away from the centerline of the micronozzle, while the 8-nozzle chamber extends to around 0.8 mm away from the centerline of the micronozzle. The broadened equipotential distribution results in the wider electrospray angle between the centerline of the micronozzle and the tangential direction of the electrified jet at the outer diameter of the tip of the micronozzle when the electrospray is operated in the multi-jet mode. The definition of the electrospray angle is shown in Figure 9.
To estimate the average electrostatic field strength of the ESEC microfluidic chambers, we modified the analytical model describing the electrostatic field strength of a hyperboloid-to-plane EHD configuration [26,33] to fit our electrostatic field strength modeling results. Some physical parameters, such as the distance of 7.5 mm between the tips of the micronozzle and the thermal exchange surface, as well as the diameter of the micronozzles, are fixed values, while the only variable for modeling is the applied potential on three ESEC chambers.
The general form describing the electrostatic field strength of a hyperboloid-to-plane EHD configuration is

Figure 9. Schematic diagram showing the definition of the electrospray angle in the multi-jet EHD mode.
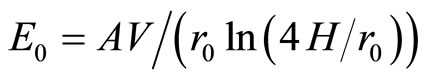 (5)
(5)
where r0 and H are the outer radius of the hyperboloid object and the distance between the tip of the hyperboloid object and the thermal exchange surface, respectively. The constant, A, is determined from experimental results of different EHD configurations [34-36]. For the ESEC chambers, r0 is the outer radius of the micronozzle. There are two reasons why we chose r0 as the key parameter. First, the operation of the ESEC device primary depends on the potential distribution between the tips of the micronozzles and the collecting electrode. The outer diameter of the micronozzle affects the potential distribution between the tips of the micronozzles and the collecting electrode. Second, although the electrostatic field modeling results shown in Figure 8 indicates that there is a potential distribution inside the micronozzle, for practical operating of the ESEC device, the working fluid fills the entire inner part of the micronozzle; therefore, the potential distribution inside the micronozzle should be more uniform in comparison to the potential distribution outside of the micronozzle.
For the hyperboloid-to-plane EHD configuration, A usually ranges from  to 2. However, the estimation of the electrostatic field strength of the 1-nozzle ESEC chamber using the previously determined value of A results in an electrostatic field strength 50 times higher than that generated by the numerical results in this paper because the analytical model is based on a tip radius of the hyperboloid needle much smaller than the outer radius of the micronozzle of the 1-nozzle ESEC chamber. Therefore, we suggest that the constant, A, of the simplified analytical model for the geometry of the micronozzle of the 1-nozzle ESEC chamber is modified as 2.89 × 10⁻², two orders lower than that of the previously determined values.
Figure 10 also shows the average electrostatic field strength of the three ESEC microfluidic chambers at different applied DC potentials. Figure 10 also shows the plot of the electrostatic field strength of the analytical model with the modified constant, A, of 2.89 × 10⁻². As the applied DC potential is increased, the average electrostatic field strength of the 8-nozzle chamber is always higher than that of the 4-nozzle and the 1-nozzle chambers. The average electrostatic field strength of the 1- nozzle and 4-nozzle chambers is almost the same, which can explain the difference of the experimental heat transfer performance of the three chambers discussed in Section 4.
4. Experimental Results
4.1. Experimental Apparatus
Figure 11 shows the experimental apparatus for the heat
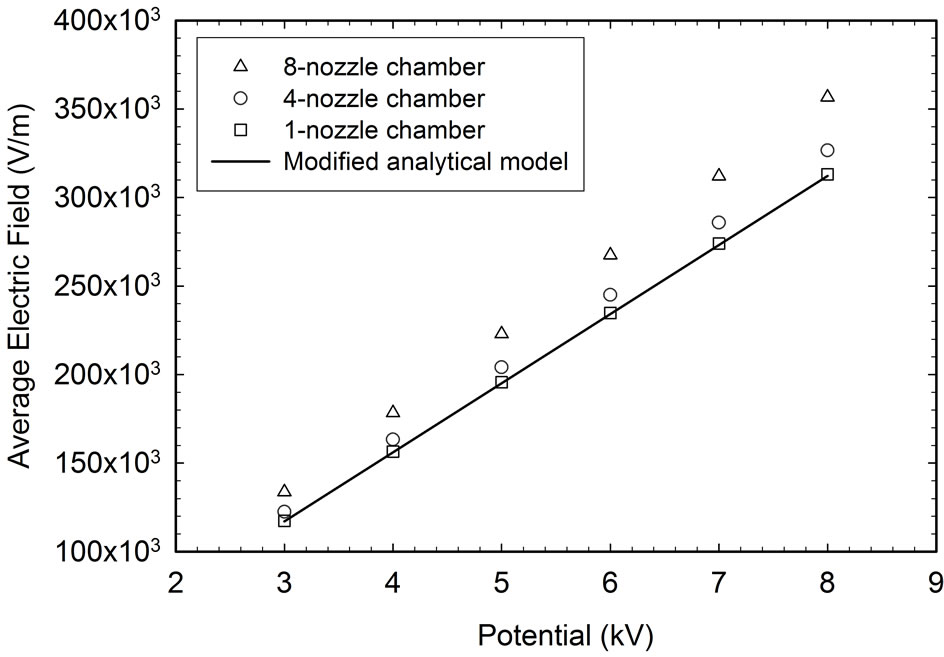
Figure 10. Simulation results of the average electrostatic field strength at the central line of the chamber. The central line is parallel to the micronozzles of three microfluidic chambers. The electrostatic field strength of the modified hyperboloid-to-plane EHD configuration is also plotted to fit the numerical result of electrostatic field strength of the 1-nozzle ESEC chamber.
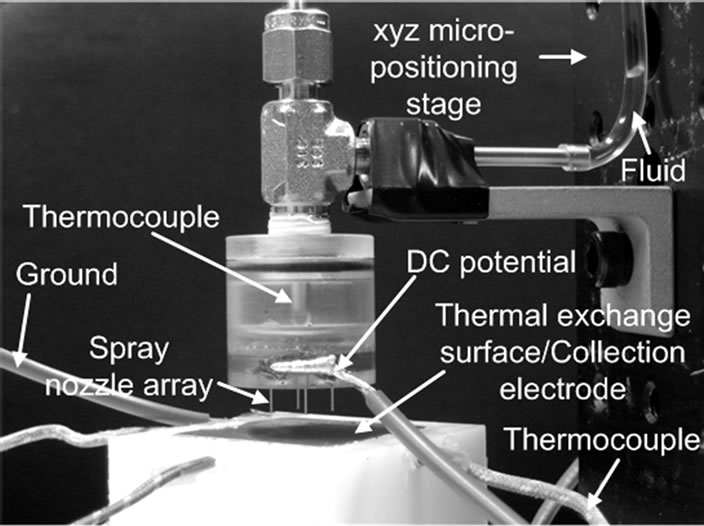
Figure 11. The experimental apparatus for the heat transfer enhancement measurement of the ESEC devices with different ESEC microfluidic chambers.
transfer performance measurement of the ESEC devices. A custom testing platform, as shown in Figure 12, was design for experiments. The platform consists of a thermal insulation block (44 mm × 44 mm × 40 mm), an electrical heater (2.54 × 2.54 cm2), a layer of ceramicbased thermal compound, a 4 mm thick copper collecting electrode (30 mm × 30 mm), four plastic screws, and four K-type thermocouples.
To position the collecting electrode in place and minimize the heat loss from its peripheral surfaces, the electrode was clamped using four plastic screws inside the thermal insulation block, which was made of Teflon. Only the top surface of the electrode was exposed to the surrounding air. Assuming approximately moderate heat flux generated from the heater, the estimated heat loss from the peripheral surfaces and the bottom surface were calculated at less than 5% and 1%, respectively. Four holes were drilled into the sidewalls of both the thermal insulation block and the collecting electrode to position
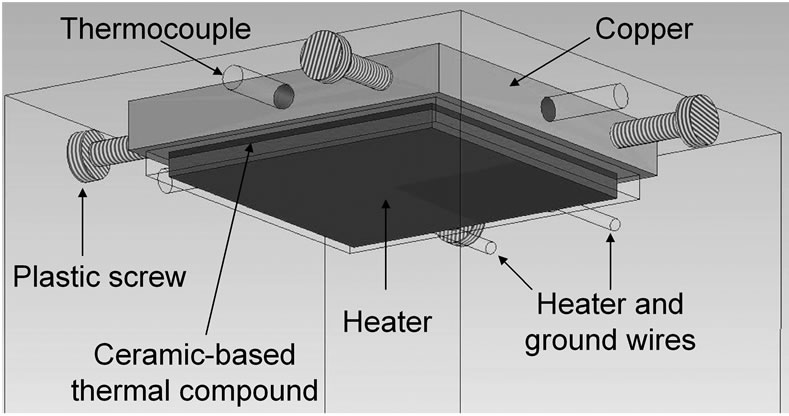
Figure 12. Schematic diagram of the testing platform for heat transfer enhancement measurement of ESEC devices. The platform consists of an electrical and thermal insulation block (transparent), an AC electrical heater (red), a layer of ceramic-based thermal compound (blue), a collecting electrode (orange), four plastic screws (gray), and four electrically insulated K-type thermocouples (transparent tubes).
the electrically insulated thermocouples used to measure temperatures inside the thermal exchange surface. One thermocouple was placed directly under the center of the collecting electrode and the rest of them were positioned 7 mm deep inside the electrode from the remaining sidewalls. In addition, a ceramic-based thermal compound layer was placed between the collecting electrode and the electrical heater to ensure that no electrical conduction path exists in between, as well as to minimize the interfacial thermal resistance.
The working fluid, ethyl alcohol, was pumped into the chamber using a syringe pump. The inlet temperature of the working fluid is room temperature. Four total different flow rates were set at 1, 2, 4, and 8 cm3/hr. A micropositioning xyz optical stage was used to control the distance of 7.5 mm from the nozzle tip to the thermal exchange surface. During the experiment, the electrical heater was connected in series with a resistor to an AC power supply. The copper plate in the microfluidic chamber was connected to a high voltage power supply with positive polarity and the collection electrode, which is also the thermal exchange surface, was connected in series with a resistor to ground.
Experiments were conducted in ambient conditions. All temperatures were measured at the steady state condition, which defined that the temperature difference was ± 0.15˚C with respect to an average temperature and lasted for at least 5 minutes.
4.2. Operated EHD Modes
According to the investigation results from Cloupeau et al. [37] and Jaworek et al. [29], the EHD functioning modes of a single-capillary-to-plane configuration, in general, can be classified as dripping modes and jet modes. The dripping mode is the mode that only fragments of liquid are electrified directly from the nozzle tip. The jet mode is the mode that liquid is electrified directly into a long fine jet, which can either be stable or move in any regular way. The cone-jet mode and the multi-jet mode are both referred to as the jet mode.
The stable cone-jet mode has the advantage of generating uniform submicron droplets [32,38,39], which has the ability to generate the appropriate droplet’s size for optimal heat transfer. However, the operating range of the potential to achieve the cone-jet mode is narrow and highly influenced by the properties of the working fluid, the quantity of electrospraying nozzles, the arrangement of the nozzles, and so on [39,40]. The critical voltage for a given flow rate to change from the cone-jet to the multi-jet mode has not been quantitatively investigated.
Although the droplet control ability in multi-jet mode is poor, the electrified liquid jets can cover larger portions of the thermal exchange surface, which results in higher heat transfer performance. Therefore, in this investigation, all ESEC chambers were operated in the multi-jet EHD mode.
4.3. Data Reduction
The general form describing the average corresponding convection heat transfer coefficient is [41]
 (6)
(6)
where q″ is the heat flux, and Ts is the average temperature of the entire thermal exchange surface (collecting electrode). Since the copper is a thermally conductive material and it is thin (4 mm), we assumed that the entire copper (collecting electrode) temperature Ts is uniform. T∞ is the ambient temperature. The heat flux (q″) was assumed uniform over the entire thermal exchange surface, and it is expressed as
 (7)
(7)
where I is the current from the heater, V is the applied voltage on the electric heater, and As is the surface area of the thermal exchange surface, which is 900 mm2 (30 mm × 30 mm), faces the micronozzles.
During the experiments, the heat flux from the heater was kept constant. Therefore, the enhancement ratio (ER) of the average corresponding convection heat transfer coefficient was
 (8)
(8)
where  and
and  are average corresponding convection heat transfer coefficients calculated at non-electrospray and electrospray conditions, respectively. T0,s and T0,∞ are the average surface and environmental temperatures during non-electrospray condition, respectively. T1,s and T1,∞ are the average surface and environmental temperatures during electrospray condition, respectively.
At the steady state condition, the total heat (Qt) is transferred through the thermal conduction to the thermal exchange surface, and is then transferred by convection (Qconv), vaporization (Qv) and thermal radiation (Qrad) at the thermal exchange surface. Therefore, heat removed by the ESEC device, QESEC, was calculated and expressed as
 (9)
(9)
where Ql is the heat loss of the thermal stand. In the analysis, according to the design data of the thermal stand, the maximum heat loss was assumed to be approximately 5% of the total heat flux. Furthermore, according to the experiments, the heat loss due to thermal radiation is less than 0.1%; therefore, Qrad can be neglected in Equation (9). The uncertainty of this investigation mainly comes from the measurement of the surface temperature of the thermal exchange surface and the measurement of the current from the electric heater.
4.4. Results
4.4.1. Enhancement Ratio
Figure 13 shows the relationship between the enhancement ratio and the mass flow rate of the 8-nozzle ESEC microfluidic chamber at different applied potentials at a heat flux of 4384.40 W/m2. At the fixed mass flow rate, a higher applied potential results in a higher enhancement ratio. At the fixed potential, increasing the mass flow rate increases the enhancement ratio. The 4-nozzle ESEC microfluidic chamber and the 1-nozzle ESEC microfluidic chamber show the same relationship between the enhancement ratio and the mass flow rate.
Figure 14 shows that at a constant heat flux (4384.40 W/m2) and potential of 7.0 kV, the enhancement ratio increases as the mass flow rate of the fluid increases. At the same mass flow rate, the highest enhancement ratio was achieved by the 8-nozzle ESEC chamber, which
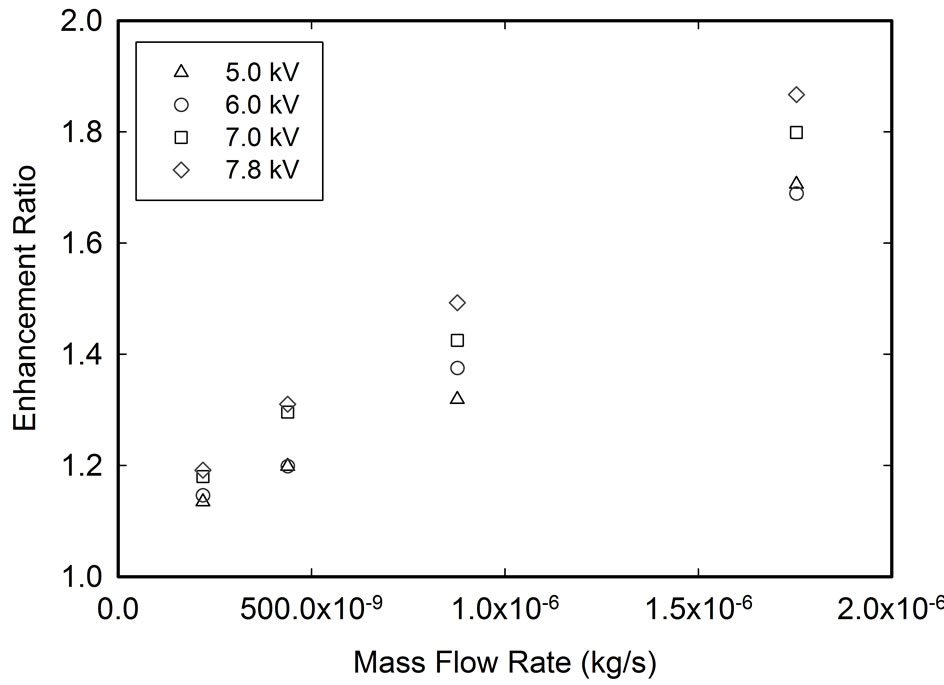
Figure 13. The relationship between the mass flow rate and the enhancement ratio of the 8-nozzle ESEC chamber at different potentials. The heat flux is 4384.40 W/m2.
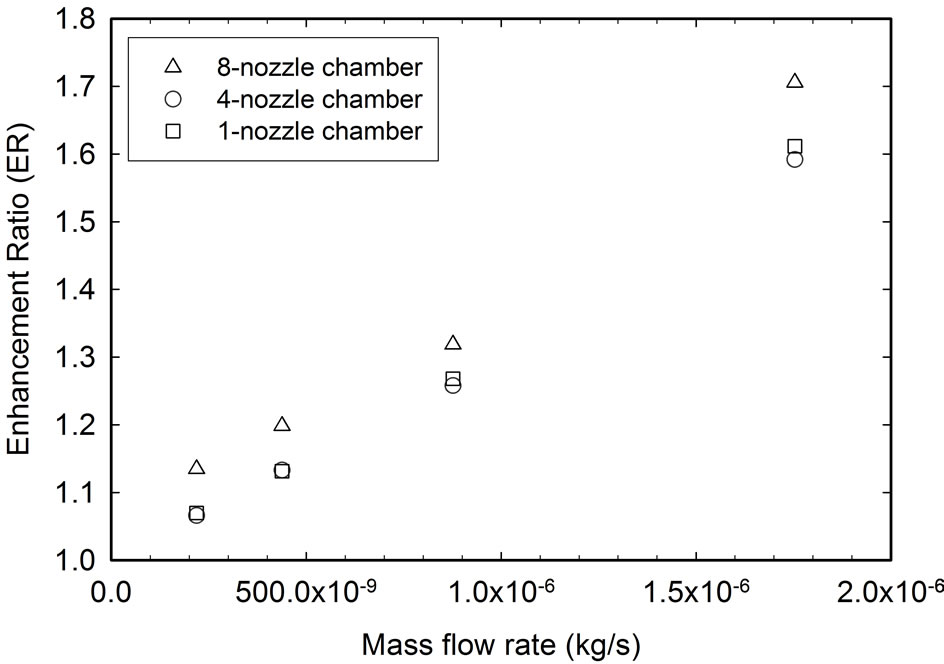
Figure 14. Relationship between the mass flow rate and the enhancement ratio achieved by three microfluidic chambers at constant heat flux and 7.0 kV DC potential. The heat flux is 4384.40 W/m2.
indicates that the higher the number of micronozzles used, the more efficient the fluid could be distributed to cover larger surface areas of the thermal exchange surface for heat transfer.
At a heat flux of 43843.40 W/m2, Figure 15 shows the relationship between the enhancement ratio and the average electrostatic field of all ESEC microfluidic chambers at a total flow rate of 8 cm3/hr. In general, at the same average electrostatic field, the 8-nozzle ESEC chamber has the highest enhancement ratio, followed by the 1-nozzle ESEC chamber and the 4-nozzle ESEC chamber.
To compare the enhancement ratio achieved by three ESEC chambers at different average electrostatic fields, we use linear curve regression to discuss the relationship between the average electrostatic field and the enhancement ratio of the ESEC chambers.
For the 8-nozzle ESEC chamber, the regression curve is
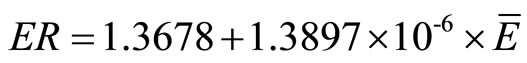 (10)
(10)
For the 4-nozzle ESEC chamber, the regression curve is
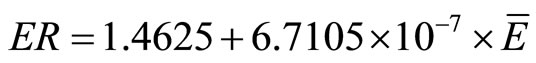 (11)
(11)
For the 1-nozzle ESEC chamber, the regression curve is
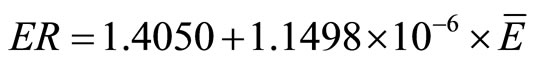 (12)
(12)
where  is the average electrostatic field and ER is the enhancement ratio. The regression curve slope for the 1-nozzle chamber and 8-nozzle chamber are of the same order, which indicates that the increase of the average electrostatic field in these two chambers results in the same increasing rate of the enhancement ratio. Furthermore, Figure 15 also indicates that ESEC chambers with

Figure 15. The relationship between the average electrostatic field and the enhancement ratio among three different ESEC chambers at the flow rate of 8 cm3/hr and the heat flux of 4384.40 W/m2.
the same average electrostatic field intensity cannot achieve the same magnitude of the enhancement ratio. It is the local electrostatic field intensity near the micronozzle tip, Figure 8(a), of the ESEC chamber that influences the achievable enhancement ratio. The 4-nozzle ESEC chamber’s electrostatic field intensity near the micronozzle tip (within 3 mm) is not highly influenced by adjacent micronozzles and each micronozzle on this ESEC chamber can be considered as an isolated micronozzle. Weak local electrostatic field intensity results in a smaller electrospray angle (Figure 9). Therefore, the electrified liquid jets must cover a small surface area, which reduces the heat transfer performance. In addition, our experimental enhancement ratios are within ± 5.0% of the linearly regressed curve for the ESEC chambers, which indicates that choosing linear curve regression should provide us with enough information regarding the relationship between the average electrostatic field intensity and the corresponding enhancement ratio for the ESEC design.
Figure 16(a) shows enhancement ratios achieved by each ESEC chamber at a potential of 7.0 kV, flow rate of 8 cm3/hr, and four different heat fluxes. At each heat flux, the 8-nozzle microfluidic ESEC chamber always achieves the highest enhancement ratio, followed by the 1-nozzle ESEC chamber and the 4-nozzle ESEC chamber. The reason why the highest enhancement ratio was achieved by the 8-nozzle ESEC chamber is because the potential distribution near one of the tips of the micronozzle is higher than that of the other two ESEC chambers (Figure 8(a)). In this operating condition, the electrified jets are forced to eject in a higher electrospray angle, allowing the electrified jets to cover a larger portion of the thermal exchange surface, yielding greater heat transfer performance and leading to a significantly lowered initial surface temperature for the thermal exchange surface.
In addition, for the same ESEC chamber, increasing the heat flux results in a decreased enhancement ratio. Enhancement ratio differences among the three ESEC chambers become noticeable when the ESEC chambers are operated in lower heat flux conditions. At the lower heat flux, the temperature difference between the ethyl alcohol and the thermal exchange surface is small, resulting in a lower heat transfer rate by conduction from the thermal exchange surface to the ethyl alcohol film accumulated on the thermal exchange surface. The ethyl alcohol film does not absorb enough heat to vaporize on the thermal exchange surface. Furthermore, the amount of coming ethyl alcohol from the ESEC chamber is larger than that of the vaporized ethyl alcohol on the thermal exchange surface. Therefore, the surface temperature of the thermal exchange surface is largely lowered by the net increased amount of ethyl alcohol. The accumulation of the electrified ethyl alcohol decreases as the heat flux becomes higher. This phenomenon occurs at all heat flux conditions.
Figure 16(b) shows the highest enhancement ratio achieved by each ESEC chamber at the highest achievable potential, highest flow rate of 8 cm3/hr, and four different heat fluxes investigated in this paper. The highest achievable potential occurs before the breakdown between the ESEC chamber and the collection electrode and is therefore different for all three ESEC chambers. The highest achievable potential for the 1-nozzle chamber, 4-nozzle chamber, and 8-nozzle chamber is 7.0 kV, 7.7 kV, and 7.8 kV, respectively. The corresponding average electrostatic field strength for the 1-nozzle chamber, 4-nozzle chamber, and 8-nozzle chamber is 2.74 × 10⁵ (V/m), 3.14 × 10⁵ (V/m), and 3.48 × 10⁵ (V/m), respectively.
The maximum enhancement ratio of 1.87 was achieved by the 8-nozzle chamber at the highest achievable potential and lowest heat flux of 7.8 kV and 4384.40 W/m2, respectively. The same tendency that the maximum enhancement ratio occurs at the lowest heat flux and the highest potential was also presented by Feng et al. [26].
Figure 16(b) shows that for heat flux higher than 5000 W/m2, the highest enhancement ratio achieved by the 1-nozzle ESEC chamber is slightly higher than that achieved by the 4-nozzle ESEC chamber. Although the average electrostatic field of the 4-nozzle chamber is higher than that of the 1-nozzle chamber, the potential distribution close to the tip of the micronozzle dominates the enhancement ratio.
Therefore, we conclude that the potential distribution close to the tip of the micronozzles dominates the enhancement ratios of all the ESEC chambers investigated. Although the universal criterion that correlates the average electrostatic field and the enhancement of the ESEC chambers with different geometries is still not available,
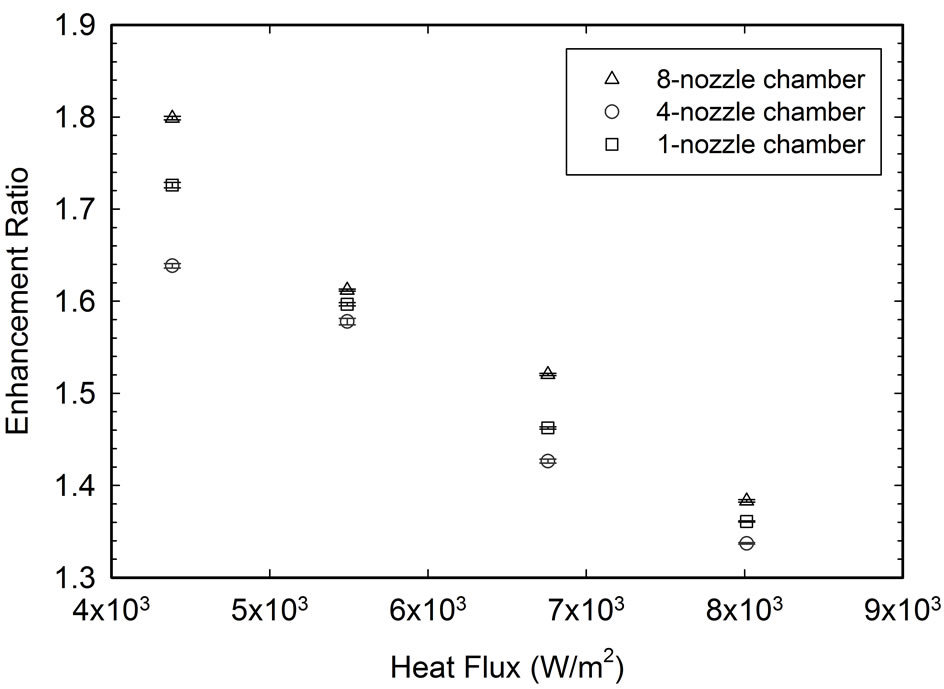 (a)
(a)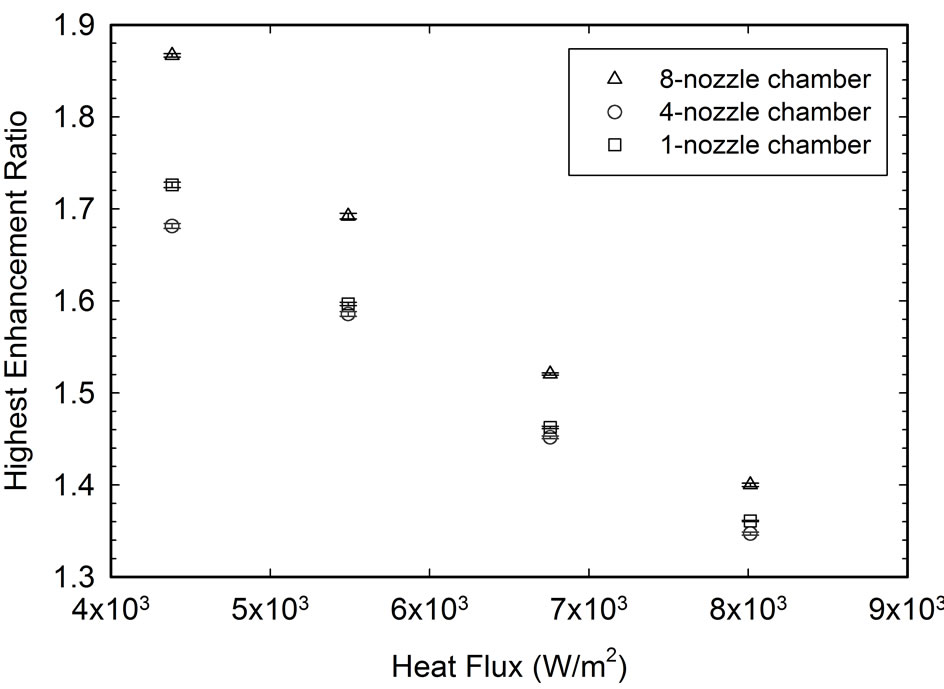 (b)
(b)
Figure 16. Enhancement ratios achieved by the three chambers at different heat fluxes. The highest enhancement ratios occur at the flow rate of 8 cm3/hr.
the modeling results regarding the potential distribution near the tip of the micronozzles of the ESEC chambers could point out the relative magnitude of the enhancement ratio among the ESEC chambers.
To understand the effect that the increasing potential and total mass flow rate have on the enhancement ratio, the potential, total mass flow rate, and enhancement ratio are all normalized according to the smallest values for analysis. Figure 17 shows the effect of the potential increasing rate on the enhancement ratio increasing rate achieved by the three different ESEC microfluidic chambers at a heat flux of 4384.40 W/m2. The slope of the regression curves among the three ESEC chambers indicates that, at the same potential increasing rate, the 8-nozzle ESEC chamber achieves the fastest increasing rate in the enhancement ratio, followed by the 1-nozzle ESEC chamber and the 4-nozzle ESEC chamber. The same performance behavior among the three ESEC chambers regarding the total mass flow rate increasing rate and the enhancement ratio increasing rate is shown in Figure 18.
Additionally, for the same ESEC microfluidic chamber and heat flux, Figure 17 and Figure 18 also indicate that to achieve a higher enhancement ratio increasing rate, increasing the applied potential is more efficient than increasing the total mass flow rate.
4.4.2. Thermal Resistance
Thermal resistance (TR) is the temperature difference across a structure when a unit of heat energy flows through it in unit time. From Newton’s law of cooling, thermal resistance for convection heat transfer is expressed as
 (13)
(13)
where h and A are the convective heat transfer coefficient and the surface area of the thermal exchange surface, respectively. Lower thermal resistance represents a higher
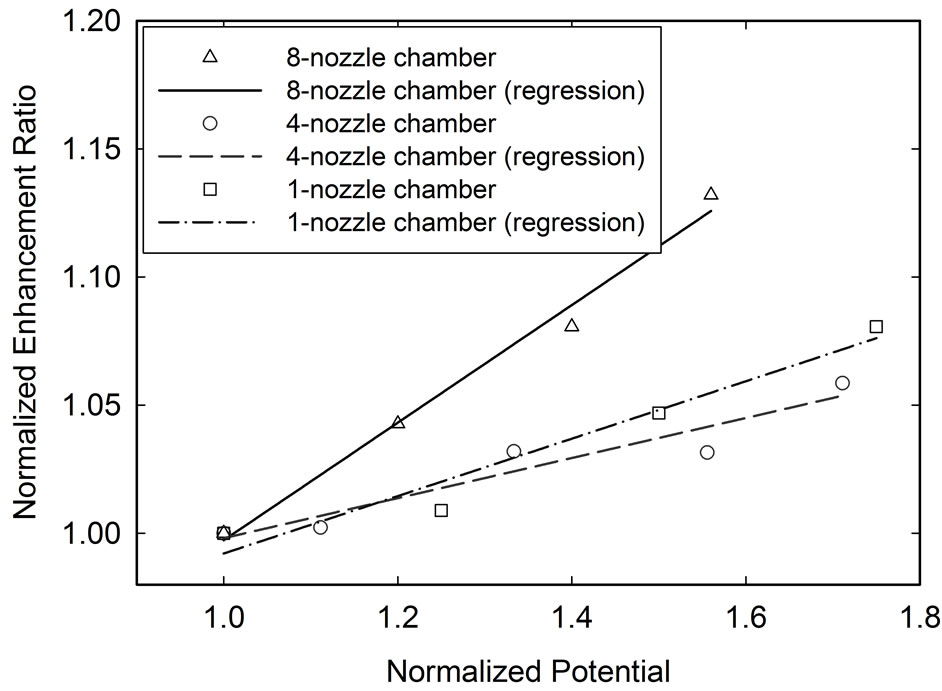
Figure 17. The enhancement ratio increasing rate due to the increased potential among the three ESEC microfluidic chambers. The heat flux is 4384.40 W/m2.

Figure 18. The enhancement ratio increasing rate due to the increased total mass flow rate among the three ESEC microfluidic chambers. The heat flux is 4384.40 W/m2.
convective heat transfer coefficient in the same thermal exchange area.
At the same heat flux and applied potential, Figure 19 shows that increasing the mass flow rate decreases the average thermal resistance. At the same mass flow rate and heat flux, increasing the applied potential reduces the average thermal resistance.
At a heat flux of 43843.40 W/m2, Figure 20 shows the relationship between the average thermal resistance and the average electrostatic field of all the ESEC microfluidic chambers at the total flow rate of 8 cm3/hr. At the same average electrostatic field, the 8-nozzle ESEC chamber has the lowest average thermal resistance, followed by the 1-nozzle and the 4-nozzle ESEC chambers, respectively. The regression curves regarding the relationship between the average electrostatic field and the average thermal resistance for all three chambers are described next.

Figure 19. The relationship between the mass flow rate and the average thermal resistance of the 4-nozzle ESEC chamber at different potentials. The heat flux is 4384.40 W/m2.
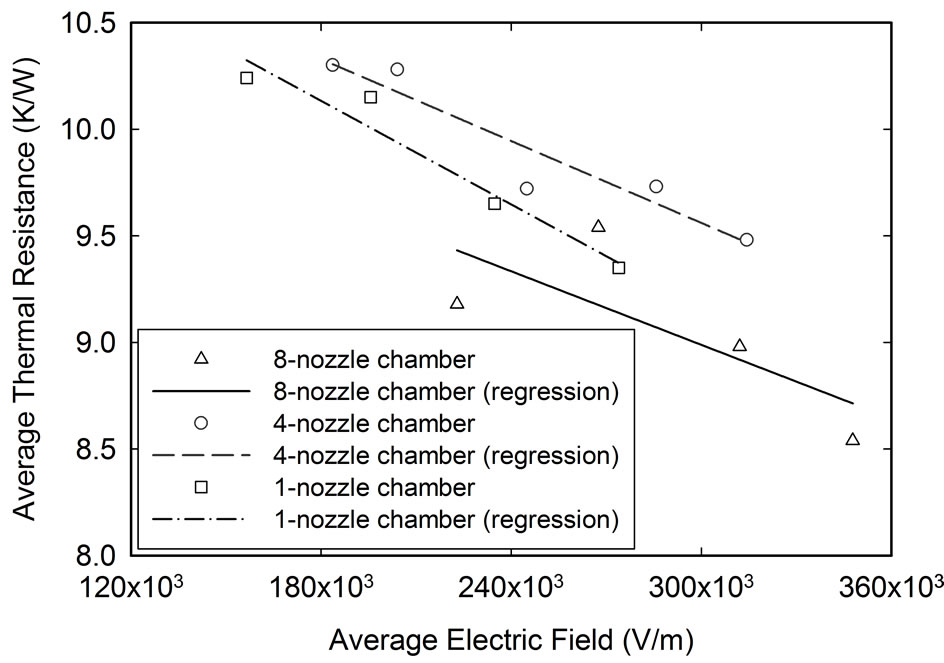
Figure 20. The relationship between the average electrostatic field and the average thermal resistance among three different ESEC chambers at the flow rate of 8 cm3/hr and the heat flux of 4384.40 W/m2.
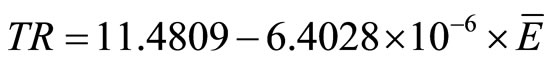
For the 8-nozzle ESEC chamber, the regression curve is
 (14)
(14)
For the 4-nozzle ESEC chamber, the regression curve is
 (15)
(15)
For the 1-nozzle ESEC chamber, the regression curve is
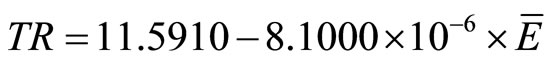 (16)
(16)
where  is the average electrostatic field and TR is the average thermal resistance. Unlike the behavior between the average electrostatic field and the enhancement ratio, the slope of the regression curve of all three ESEC chambers investigated in this paper are of the same order, indicating that increase of the average electrostatic field results in the same rate of increase of the average thermal resistance.
4.4.3. Average Cooling Rate
To explain how fast different ESEC chambers can transfer heat from the thermal exchange surface, the average cooling rate (CR) was defined and expressed as
 (17)
(17)
where ΔT is the temperature difference between the starting temperature and the steady state temperature, and Δt is the time required for the chambers to reach the steady state temperature from a defined starting temperature. Figure 21 shows that the 8-nozzle ESEC chamber might not be able to achieve a better average cooling rate at a higher applied potential or higher mass flow rate. For example, at a mass flow rate of 8.77 × 10⁻⁷ kg/s, the 8-nozzle ESEC chamber achieves the maximum average cooling rate of 7.56 × 10⁻³˚C/s as the applied potential is 5 kV, while the minimum average cooling rate of 2.00 × 10⁻³˚C/s is achieved when the applied potential is 7.8 kV. In addition, the maximum average cooling rate of 8.75 × 10⁻³˚C/s is achieved by the chamber at the applied potential of 7.0 kV instead of 7.8 kV.
Figure 22 shows the transient relationship between the average electrostatic field and the average cooling rate for all three ESEC chambers at a heat flux of 4384.40 W/m2 and the total flow rate of 8 cm3/hr for the first five minutes after the ESEC cooling device is started. In general, increase the average electrostatic field results in an increase in the average cooling rate. For all three ESEC chambers, the slopes between the average electrostatic field and the average cooling rate are approximately 5.0 × 10⁻⁸ K/s per average electrostatic field strength.
At the same average electrostatic field, the average cooling rate of the 1-nozzle ESEC chamber is the highest, followed by the 4-nozzle and 8-nozzle chambers. The

Figure 21. The relationship between the mass flow rate and the average cooling rate of the 8-nozzle ESEC chamber at different potentials. The heat flux is 4384.40 W/m2.
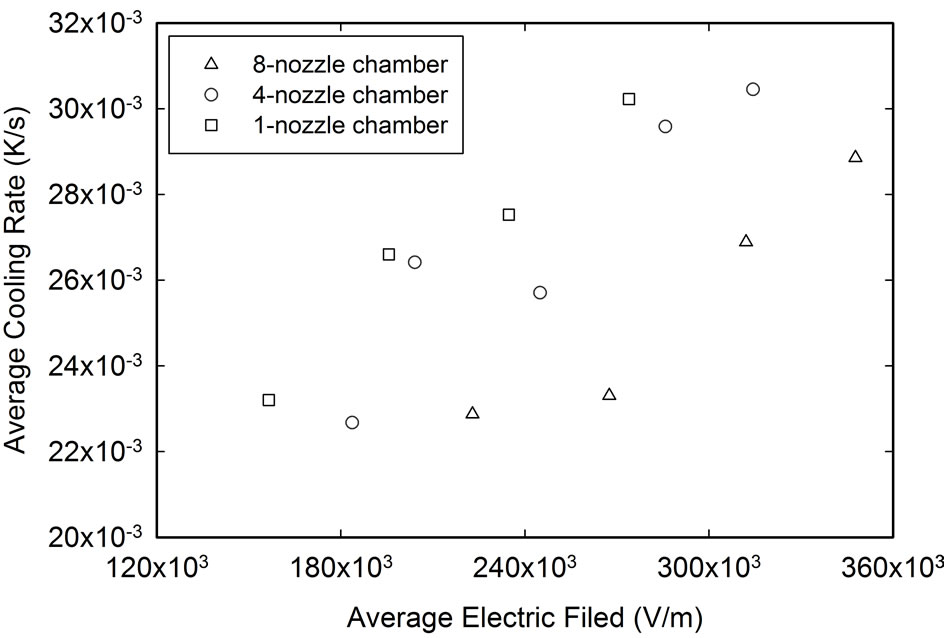
Figure 22. The relationship between the average electrostatic field and the average thermal resistance among three different ESEC chambers at the total flow rate of 8 cc/hr and the heat flux of 4384.40 W/m2.
average cooling rates for the 4-nozzle and 8-nozzle ESEC chambers are 11.74% and 21.82%, respectively, lower than that of the 1-nozzle ESEC chamber at the same average electrostatic field. At these conditions, the corresponding potentials applied on the 4-nozzle and 8-nozzle ESEC chambers are 4.00% and 12.13%, respectively, lower than that applied on the 1-nozzle ESEC chamber.
Neither the potential distribution close to the tip of the micronozzle of the ESEC chambers nor the average surface change on the tip of the micronozzle can explain the average cooling rate achieved by the three ESEC chambers. The most possible reason is due to the EHD function mode. Although all ESEC chambers were operated in the multi-jet mode, the amount of the applied potential still dominates the number of electrified jets, the electrospray angle (defined in Figure 9) of each jet, and the corresponding distribution of the droplet diameter. Further quantitative investigations regarding these effects through experiments and full multiphysics modeling are necessary.
At steady state conditions, Figure 23 shows the relationship between the highest cooling rate and the heat fluxes among all three ESEC microfluidic chambers. In general, the highest cooling rate of the three ESEC chambers at different heat fluxes ranges from 8 × 10⁻³ K/s to 1.4 × 10⁻³ K/s. Furthermore, the results show that the 4-nozzle chamber could deal with a wider range of heat flux while still maintain the highest average cooling rate over the 1-nozzle and 8-nozzle ESEC chambers.
Additionally, although the actual highest cooling rates of the 4-nozzle and the 1-nozzle ESEC chambers are not the same, the average difference of the highest cooling rate between the 4-nozzle and the 1-nozzle ESEC chambers at different heat fluxes is approximately 3 × 10⁻³ K/s. The potential distribution close to the tip of the micronozzle of the 1-nozzle and 4-nozzle ESEC chambers is also applicable to point out the tendency of the highest cooling rate of the 4-nozzle and the 1-nozzle ESEC chambers at different heat fluxes.
5. Conclusions
The design of ESEC chambers through direct full multiphysics modeling at the molecular level has not been developed to date and is consequently unavailable for practical design, especially when the size of the devices is at the micro-scale. Therefore, this paper focuses on the proof-of-concept design tool of ESEC microfluidic chambers for the thermal management of microelectronics. We have adopted the direct simulation results of the electrostatic field strength to design the ESEC microfluidic chambers and have discussed the impact of the electrostatic field strength difference close to the tips of the designed ESEC chambers’ micronozzles on the chambers’ heat transfer performance.
The numerical results show that the surface charge distribution at the tip of the micronozzle of the chambers has an indirect effect on the heat transfer performance of the ESEC chambers, while the potential distribution close to the tip of the micronozzle of the ESEC chambers has great influence on the thermal characteristics of the ESEC cooling devices. The latter indicates that the 8- nozzle chamber would have the highest thermal characteristic, followed by the 1-nozzle and 4-nozzle chambers.
According to the experimental results, at the same heat flux and average electrostatic field, the 8-nozzle chamber has the highest enhancement ratio and the lowest average thermal resistance among all ESEC chambers. This is attributed to the effect of the potential distribution close to the tip of the micronozzles of the ESEC chamber. The maximum enhancement ratio of 1.87 was achieved by the 8-nozzle ESEC microfluidic chamber at the maximum
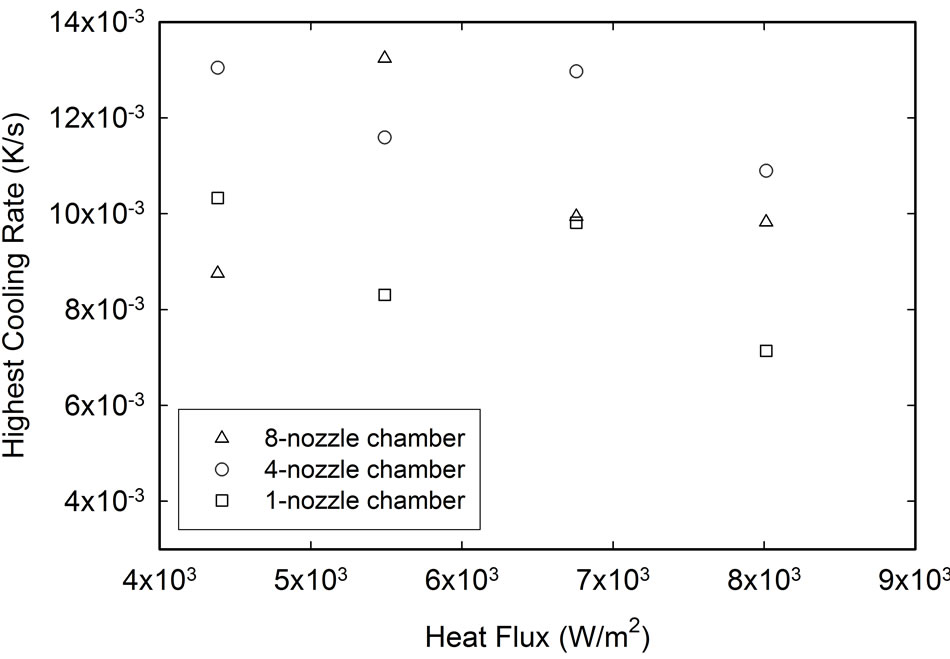
Figure 23. Highest cooling rate achieved by the three ESEC chambers at different heat fluxes.
flow rate investigated and the heat flux of 4384.40 W/m2. Finally, the results indicate that increasing the number of micronozzles on ESEC chambers may not be an effective way of improving the heat transfer performance of an ESEC cooling device. The enhancement ratio and the average thermal resistance of the 1-nozzle chamber are even better than those of the 4-nozzle chambers. The potential distribution near the tip of the micronozzle of ESEC chambers dominates the difference of the heat transfer performance of ESEC chambers.
Although the experimental results of the highest enhancement ratio and the lowest thermal resistance shows the model-predicted performance difference, the average and the highest cooling rate is different. However, the difference of the highest cooling rate between the 4-nozzle and the 1-nozzle ESEC chambers at different heat fluxes is almost the same, demonstrating that the numerical electrostatic field modeling result is still applicable to pre-estimate the heat transfer performance difference among different ESEC chambers. Further investigation and analysis to explore the achievable cooling rate among the ESEC devices will be necessary.
Future work will focus on applications of electrostaticfield-distribution-optimized ESEC chambers on the thermal management of microelectronics, where high heat flux thermal management solutions are necessary. Power consumption and the coefficient of performance of the ESEC chambers will be investigated as well.
6. Acknowledgements
This work was supported by the Center for Commercialization, University of Washington, under the internal grant number BN 65-5342.
REFERENCES
- E. A. Silk, J. Kim and K. Kiger, “Spray Cooling of Enhanced Surfaces: Impact of Structured Surface Geometry and Spray Axis Inclination,” International Journal of Heat and Mass Transfer, Vol. 49, No. 25-26, 2006, pp. 4910-4920. doi:10.1016/j.ijheatmasstransfer.2006.05.031
- A. C. Cotler, E. R. Brown, V. Dhir and M. C. Shaw, “Chip-Level Spray Cooling of an LD-MOSFET RF Power Amplifier,” IEEE Transactions on Components and Packaging Technologies, Vol. 27, No. 2, 2004, pp. 411-416. doi:10.1109/TCAPT.2004.828550
- X. Feng and J. E. Bryan, “Application of Electrohydrodynamic Atomization to Two-Phase Impingement Heat Transfer,” Journal of Heat Transfer-Transactions of the ASME, Vol. 130, No. 7, 2008, 072202. doi:10.1115/1.2885178
- S. V. Garimella, “Advances in Mesoscale Thermal Management Technologies for Microelectronics,” Microelectronics Journal, Vol. 37, No. 11, 2006, pp. 1165-1185. doi:10.1016/j.mejo.2005.07.017
- T. Widerski, E. Raj and Z. Lisik, “Cooling Microstructure for Automotive Electronic Module,” The International Conference on “Computer as a Tool”, Warsaw, 9-12 September 2007, pp. 1429-1432.
- V. Khanikar, I. Mudawar and T. Fisher, “Flow Boiling in a Micro-Channel Coated with Carbon Nanotubes,” IEEE 11th Intersociety Conference on Thermal and Thermomechanical Phenomena in Electronic Systems, Orlando, 28- 31 May 2008, pp. 960-969.
- J. Schutze, H. Ilgen and W. R. Fahrner, “An Integrated Micro Cooling System for Electronic Circuits,” IEEE Transactions on Industrial Electronics, Vol. 48, No. 2, 2001, pp. 281-285. doi:10.1109/41.915406
- J. Lee and I. Mudawar, “Fluid Flow and Heat Transfer Characteristics of Low Temperature Two-Phase MicroChannel Heat Sinks—Part 1: Experimental Methods and Flow Visualization Results,” International Journal of Heat and Mass Transfer, Vol. 51, No. 17-18, 2008, pp. 4315-4326. doi:10.1016/j.ijheatmasstransfer.2008.02.012
- J. Lee and I. Mudawar, “Low-Temperature Two-Phase Micro-Channel Cooling for High-Heat-Flux Thermal Management of Defense Electronics,” IEEE 11th Intersociety Conference on Thermal and Thermomechanical Phenomena in Electronic Systems, Orlando, 28-31 May 2008, pp. 132-144.
- Y. J. Kim, Y. K. Joshi and A. G. Fedorou, “An Absorption Based Miniature Heat Pump System for Electronics Cooling,” International Journal of Refrigeration-Revue Internationale Du Froid, Vol. 31, 2008, pp. 23-33.
- L. N. Jiang, J. Mikkelsen, J. M. Koo, D. Huber, S. H. Yao, L. Zhang, P. Zhou, J. G. Maveety, R. Prasher, J. G. Santiago, T. W. Kenny and K. E. Goodson, “Closed-Loop Electroosmotic Microchannel Cooling System for VLSI Circuits,” IEEE Transactions on Components and Packing Technologies, Vol. 25, 2005, pp. 347-355.
- N. R. Jankowski, L. Everhart, B. R. Geil, C. W. Tipton, J. Chaney, T. Heil and W. Zimbeck, “Stereolithographically Fabricated Aluminum Nitride Microchannel Substrates for Integrated Power Electronics Cooling,” IEEE 11th Intersociety Conference on Thermal and Thermomechanical Phenomena in Electronic Systems, Orlando, 28-31 May 2008, pp. 180-188.
- V. Chiriac and F. Chiriac, “An Overview and Comparison of Various Refrigeration Methods for Microelectronics Cooling,” IEEE 11th Intersociety Conference on Thermal and Thermomechanical Phenomena in Electronic Systems, Orlando, 28-31 May 2008, pp. 618-625.
- V. Singhal and S. V. Garimella, “Induction Eectrohydrodynamics Micropump for High Heat Flux Cooling,” Sensors and Actuators A: Physical, Vol. 134, No. 2, 2007, pp. 650-659. doi:10.1016/j.sna.2006.05.007
- M. Stubbe, M. Holtappels and J. Gimsa, “A New Working Principle for AC Electro-Hydrodynamic On-Chip Micro-Pumps,” Journal of Physics D: Applied Physics, Vol. 40, No. 21, 2007, pp. 6850-6856. doi:10.1088/0022-3727/40/21/055
- C. K. Lee, A. J. Robinson and C. Y. Ching, “Development of EHD Ion-Drag Micropump for Microscale Electronics Cooling,” IEEE 13th International Workshop on Thermal Investigation of ICs and Systems (THERMINIC 2007), Budapest, 17-19 September 2007, pp. 1-6.
- J. Darabi and H. X. Wang, “Development of an Electrohydrodynamic Injection Micropump and Its Potential Application in Pumping Fluids in Cryogenic Cooling Systems,” Journal of Microelectromechanical Systems, Vol. 14, No. 4, 2005, pp. 747-755. doi:10.1109/JMEMS.2005.845413
- J. Darabi, M. M. Ohadi and D. DeVoe, “An Electrohydrodynamic Polarization Micropump for Electronic Cooling,” Journal of Microelectromechanical Systems, Vol. 10, No. 1, 2001, pp. 98-106. doi:10.1109/84.911097
- J. Darabi and K. Ekula, “Development of a Chip-Integrated Micro Cooling Device,” Microelectronics Journal, Vol. 34, No. 11, 2003, pp. 1067-1074. doi:10.1016/j.mejo.2003.09.010
- S. Chowdhury, J. Darabi, M. Ohadi and J. Lawler, “Chip Integrated Micro Cooling System for High Heat Flux Electronic Cooling Applications,” pp. 1-9. http://www.atec-ahx.com/about/publications/Chowdhury%202002.pdf
- K. Adamiak, A. Mizuno and M. Nakano, “Electrohydrodynamic Flow in Optoelectrostatic Micropump: Experiment versus Numerical Simulation,” IEEE Transactions on Industry Applications, Vol. 45, No. 2, 2009, pp. 615- 622. doi:10.1109/TIA.2009.2013555
- J. Sjodahl, J. Melin, P. Griss, A. Emmer, G. Stemme and J. Roeraade, “Characterization of Micromachined Hollow Tips for Two-Dimensional Nanoelectrospray Mass Spectrometry,” Rapid Communications in Mass Spectrometry, Vol. 17, No. 4, 2003, pp. 337-341. doi:10.1002/rcm.920
- B. Q. T. Si, D. Byun and S. Lee, “Experimental and Theoretical Study of a Cone-Jet for an Electrospray Microthruster Considering the Iinterference Effect in an Array of Nozzles,” Journal of Aerosol Science, Vol. 38, No. 9, 2007, pp. 924-934. doi:10.1016/j.jaerosci.2007.07.003
- G. A. Schultz, T. N. Corso, S. J. Prosser and S. Zhang, “A Fully Iintegrated Monolithic Microchip Electrospray Device for Mass Spectrometry,” Analytical Chemistry, Vol. 72, No. 17, 2000, pp. 4058-4063. doi:10.1021/ac000325y
- J. Doshi and D. H. Reneker, “Electrospinning Process and Applications of Electrospun Fibers,” Journal of Electrostatics, Vol. 35, No. 2-3, 1995, pp. 151-160. doi:10.1016/0304-3886(95)00041-8
- X. Feng and J. E. Bryan, “Application of Electrohydrodynamic Atomization to Two-Phase Impingement Heat Transfer,” Transactions of the ASME Journal of Heat Transfer, Vol. 130, No. 7, 2008, p. 072202. doi:10.1115/1.2885178
- H. C. Wang, A. V. Mamishev and C. P. Hsu, “The Enhancement Ratio of Corresponding Convection Heat Transfer Coefficient Using Electrospray Evaporative Cooling System,” ASME Summer Heat Transfer Conference, San Francisco, 19-23 July 2009.
- W. Deng and A. Gomez, “Electrospray Cooling for Microelectronics,” International Journal of Heat and Mass Transfer, Vol. 54, No. 11-12, 2011, pp. 2270-2275. doi:10.1016/j.ijheatmasstransfer.2011.02.038
- A. Jaworek and A. T. Sobczyk, “Electrospraying Route to Nanotechnology: An Overview,” Journal of Electrostatics, Vol. 66, No. 3-4, 2008, pp. 197-219. doi:10.1016/j.elstat.2007.10.001
- A. G. Bailey, “Electrostatic Spraying of Liquids,” Research Studies Press Ltd., Taunton, 1988.
- A. Jaworek and A. Krupa, “Classification of the Modes of EHD Spraying,” Journal of Aerosol Science, Vol. 30, No. 7, 1999, pp. 873-893. doi:10.1016/S0021-8502(98)00787-3
- Y. Tatemoto, R. Ishikawa, M. Takeuchi, T. Takeshita, K. Noda and T. Okazaki, “An Electrospray Method Using a Multi-Capillary Nozzle Emitter,” Chemical Engineering & Technology, Vol. 30, No. 9, 2007, pp. 1274-1279. doi:10.1002/ceat.200700060
- H. Watanabe, T. Matsuyama and H. Yamamoto, “Experimental Study on Electrostatic Atomization of Highly Viscous Liquids,” Journal of Electrostatics, Vol. 57, No. 2, 2003, pp. 183-197. doi:10.1016/S0304-3886(02)00139-0
- X. F. Zhong, R. Yi, A. E. Holliday and D. D. Y. Chen, “Field Distribution in an Electrospray Ionization Source Determined by Finite Element Method,” Rapid Communications in Mass Spectrometry, Vol. 23, No. 5, 2009, pp. 689-697. doi:10.1002/rcm.3914
- A. R. Jones and K. C. Thong, “Production of Charged Monodisperse Fuel Droplets by Electrical Dispersion,” Journal of Physics D: Applied Physics, Vol. 4, 1971, pp. 1159-1166.
- D. P. H. Smith, “The Electrohydrodynamic Atomization of Liquids,” IEEE Transactions on Industry Applications, Vol. 22, No. 3, 1986, pp. 527-535. doi:10.1109/TIA.1986.4504754
- M. Cloupeau and B. Prunetfoch, “Electrohydrodynamic Spraying Functioning Modes—A Critical Review,” Journal of Aerosol Science, Vol. 25, No. 6, 1994, pp. 1021- 1036. doi:10.1016/0021-8502(94)90199-6
- W. W. Deng, J. F. Klemic, X. H. Li, M. A. Reed and A. Gomez, “Increase of Electrospray throughput Using Multiplexed Microfabricated Sources for the Scalable Generation of Monodisperse Droplets,” Journal of Aerosol Science, Vol. 37, No. 6, 2006, pp. 696-714. doi:10.1016/j.jaerosci.2005.05.011
- W. Deng, C. M. Waits, B. Morgan and A. Gomez, “Compact Multiplexing of Monodisperse Electrosprays,” Journal of Aerosol Science, Vol. 40, No. 10, 2009, pp. 907- 918. doi:10.1016/j.jaerosci.2009.07.002
- R. T. Kelly, J. S. Page, I. Marginean, K. Tang and R. D. Smith, “Nanoelectrospray Emitter Arrays Providing Interemitter Electric Field Uniformity,” Analytical Chemistry, Vol. 80, No. 14, 2008, pp. 5660-5665. doi:10.1021/ac800508q
- F. P. Incropera, D. P. DeWitt, T. L. Berqman and A. S. Lavine, “Introduction to Heat Transfer,” 5 Edition, John Wiley & Sons, Inc., New York, 2006.