Advances in Materials Physics and Chemistry
Vol.3 No.5(2013), Article ID:36467,5 pages DOI:10.4236/ampc.2013.35034
Prepared of Olive Oil Doped SiO2 via Sol-Gel Technique
1Higher Institute for Laser Research, Damascus University, Damascus, Syrian
2College of Science, Baghdad University, Baghdad, Iraq
Email: fawmus@gmail.com, moh4691@gmail.com
Copyright © 2013 Fawaz Nasro Saiof, Mohammed Alwan Hamza. This is an open access article distributed under the Creative Commons Attribution License, which permits unrestricted use, distribution, and reproduction in any medium, provided the original work is properly cited.
Received June 7, 2013; revised July 8, 2013; accepted July 23, 2013
Keywords: Sol-Gel; SiO2; Olive Oil
ABSTRACT
Olive oil doped Nanosilica is successfully prepared by wet chemical synthesis method. Samples were analyzed by a variety of techniques, including X-ray diffraction, FTIR, absorption and emission spectrometers to report the capability of Sol-Gel technology on preparing of silica monolith as a host material for Olive oil, and investigate the effect of converting Olive oil to a solid state on its optical properties. Some absorption bands of Olive oil are disappearing from absorption spectrum of doped silica. Only single strong fluorescence peak was appearing in fluorescence spectrum of pure Olive oil at wavelength around 678 nm which attributed to chlorophylls, while fluorescence spectrum to doped sample shows two strong fluorescence peaks at the wavelength 681 nm and 585 nm which attributed to chlorophylls and Vitamin E respectively. The doping process enhances fluorescence activity of Olive oil through enhancing intensity of the fluorescence peak corresponding to Vitamin E. Absorption and fluorescence spectrums to doped silica sample give a good indication in direction of using Sol-Gel technique to prepare for Olive oil doped SiO2 as an optical active material.
1. Introduction
Virgin olive oil, due to its high price, is a target for adulteration with low price/quality oils. Fluorescence spectroscopy has been used to determine the authenticity of olive oils [1]. Many papers have been published in recent years on the use of fluorescence in vegetable oils [2-9]. Sayago et al. [7] applied fluorescence spectroscopy for detecting hazelnut oil adulteration in virgin olive oils. Kyriakidis and Skarkalis [8] showed that emission fluorescence spectra of virgin olive oils between 400 and 700 nm measured at excitation wavelength 365 nm have clear differences compared with the spectra of other vegetable oils. Virgin olive oils present two low peaks at 445 and 475 nm (related to conjugated hydroperoxides), one intense peak at 525 nm (due to Vitamin E) and another peak at 681 nm (due to chlorophylls) [8]. The very low intensity of the peaks at 445 and 475 nm is due to their large content on monounsaturated fatty acids and phenollic antioxidants, which provide more stability against oxidation. All refined oils show only one intense peak at 445 nm. It is due to fatty acid oxidation products formed as a result of the large percentage of polyunsaturated fatty acids present in these oils.
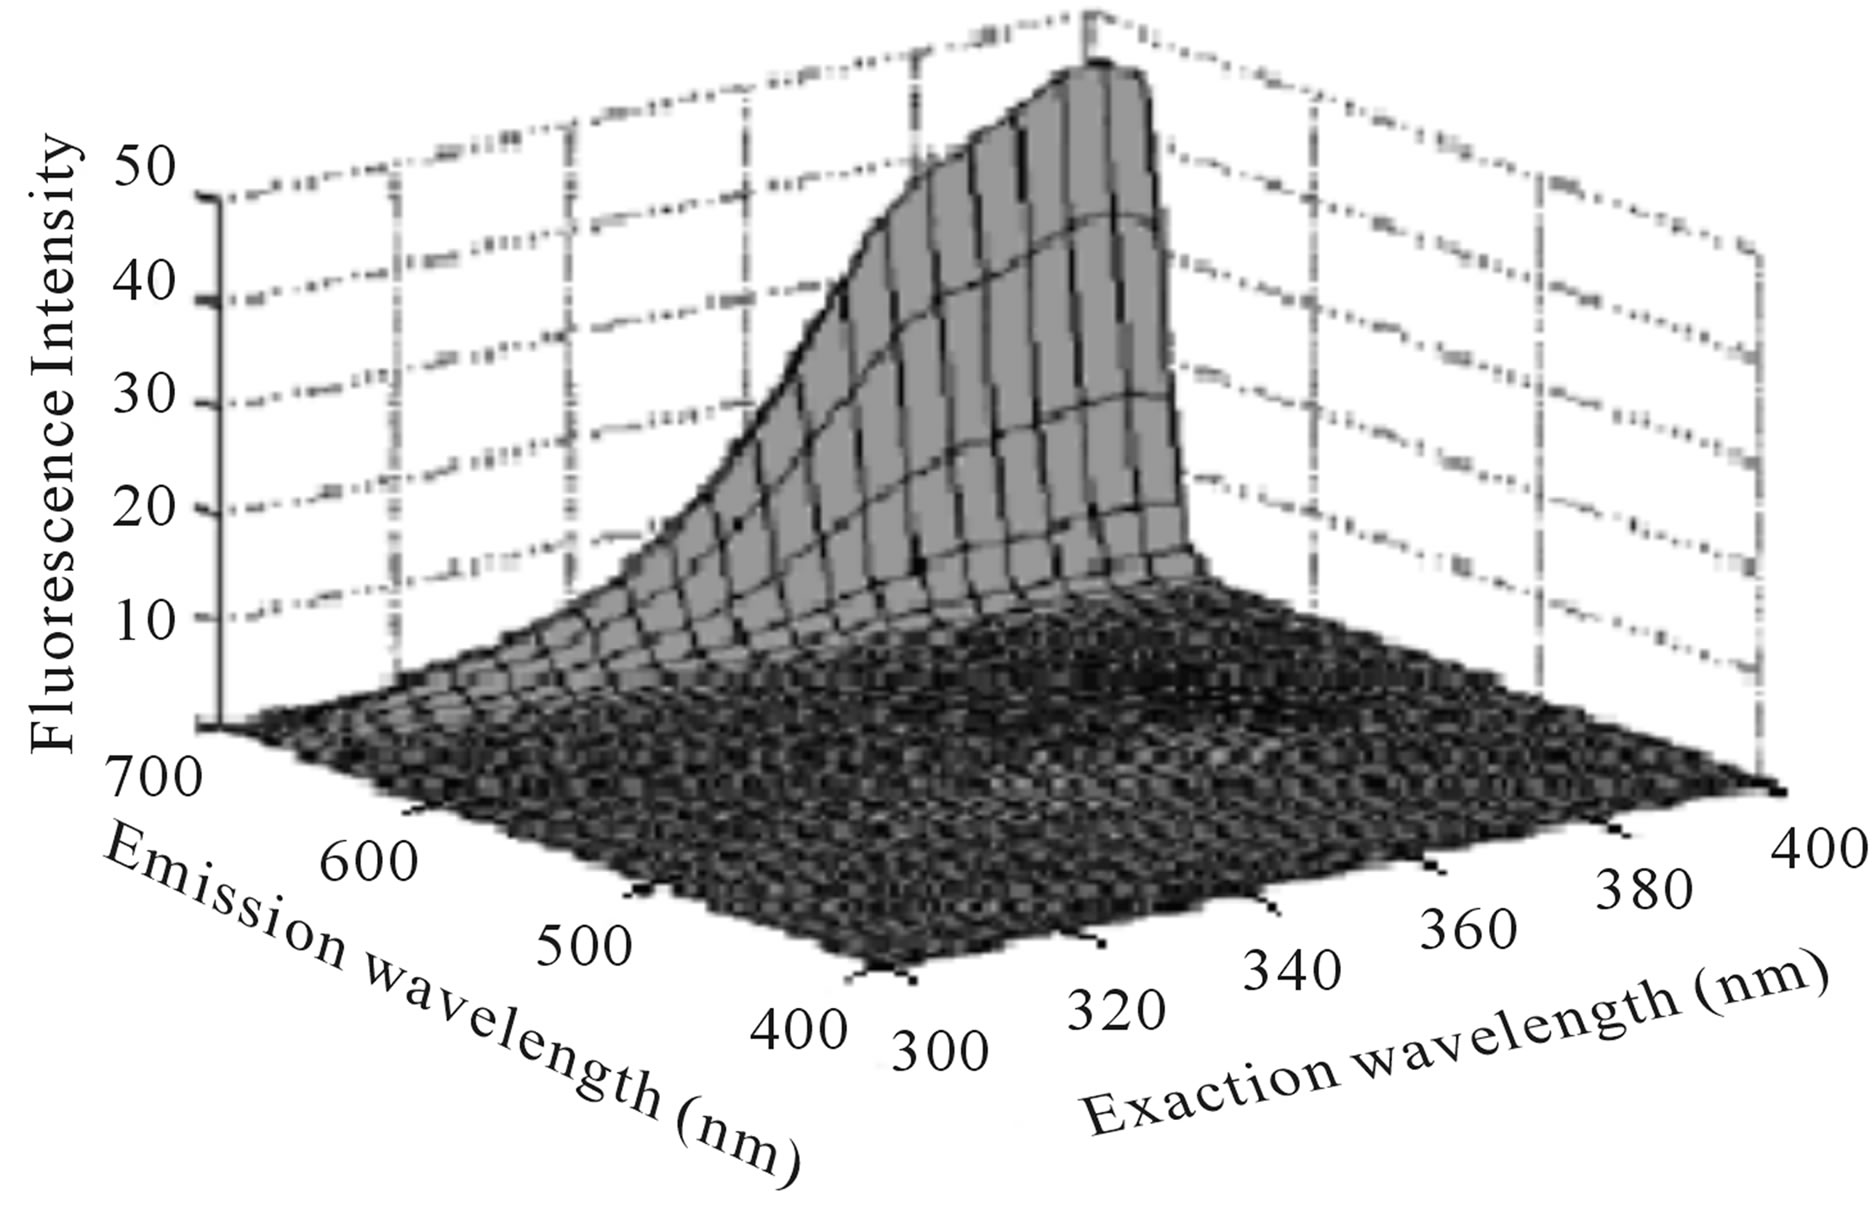
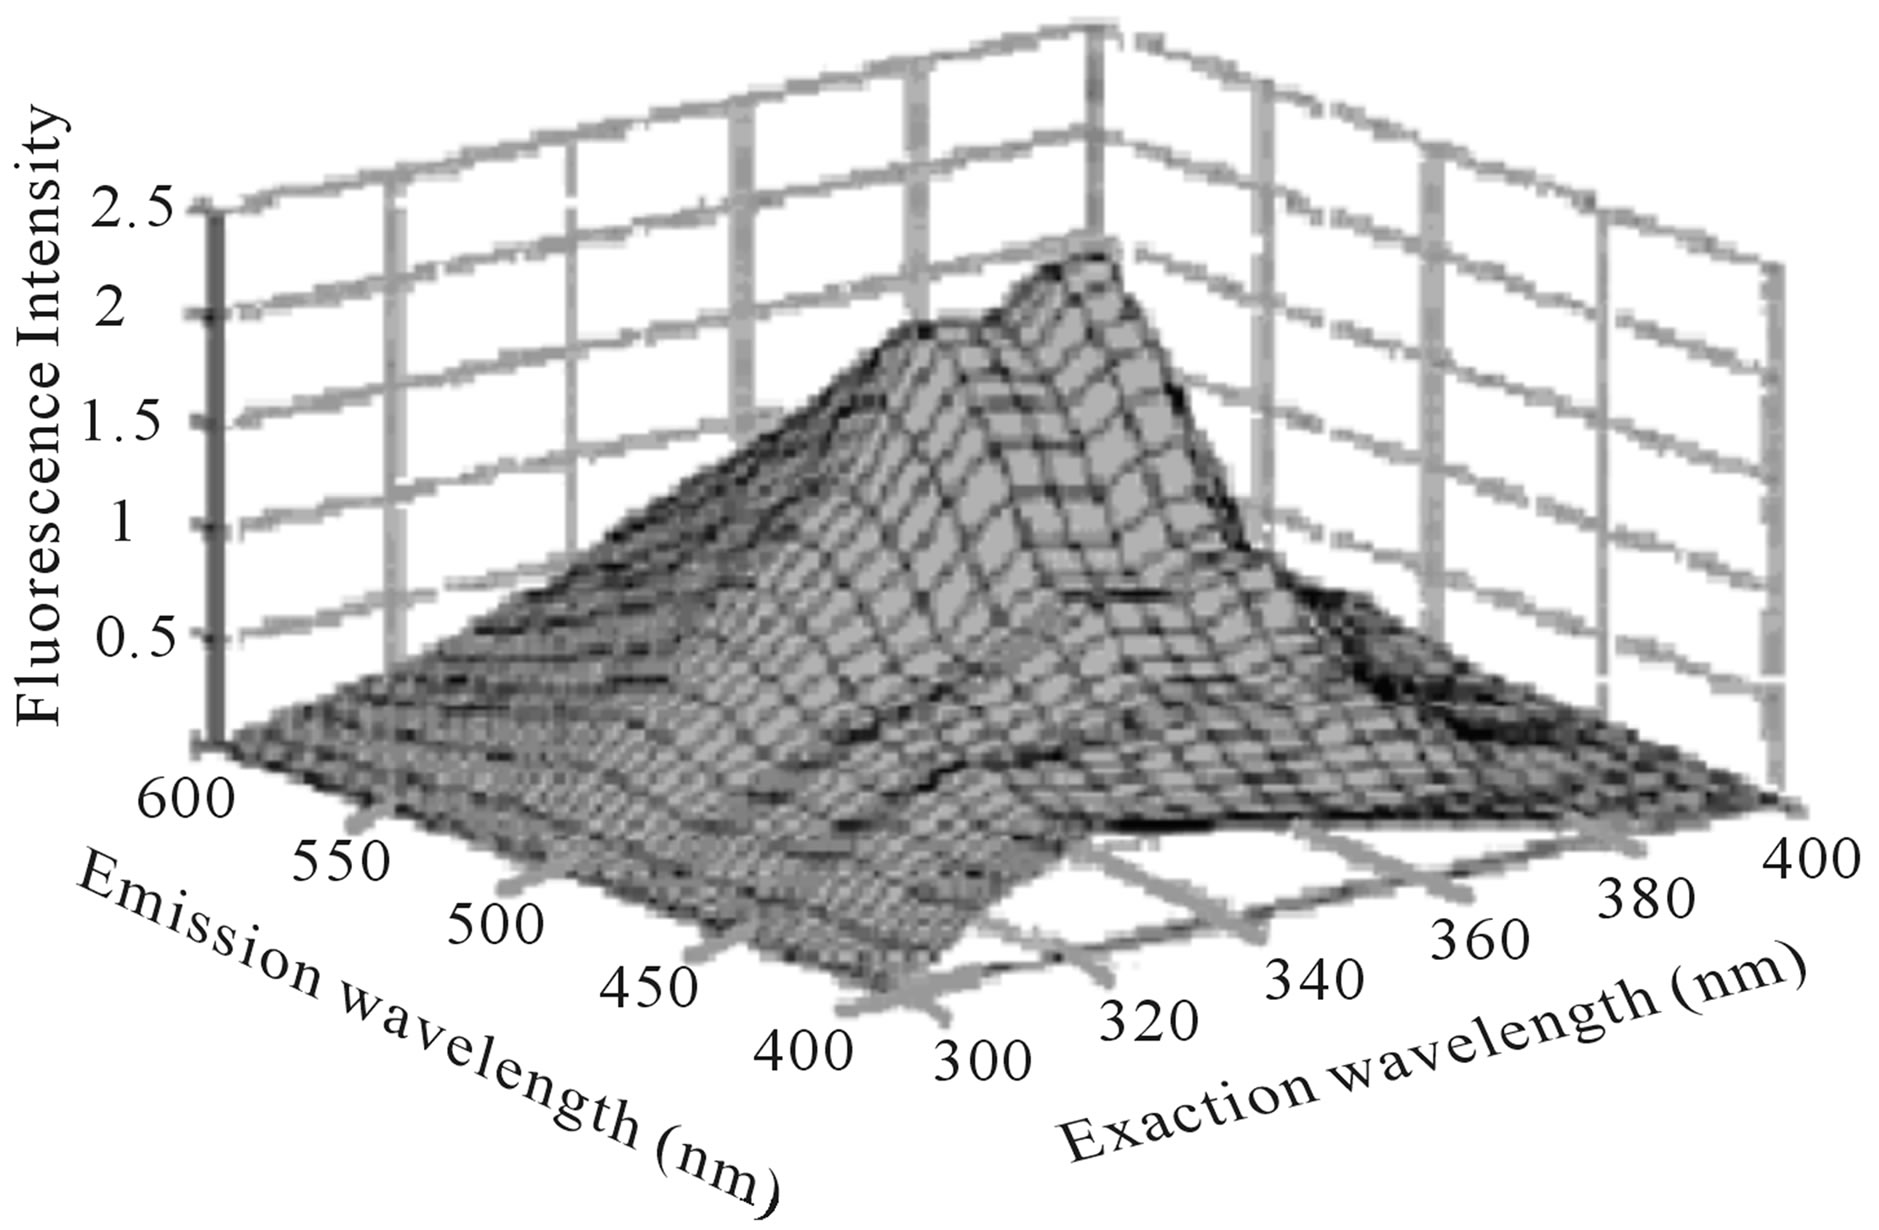
F. Guimet Vila [5,9] study Excitation-Emission Matrix EEMs of virgin and pure olive oils in the range λex = 300 - 400 nm, λem = 400 - 695 nm. He shows that emission peak at the range 600 - 695 nm is attributed to chlorophylls (Figure 1), while emission peak at the range 400 - 600 nm is attributed to oxidation products and Vitamin E (Figure 2).
According to Figures 1 and 2, we can note that the two fluorescence peaks which attributed to chlorophylls and Vitamin E have a maximum intensity when excitation wavelength around 400 nm and 350 nm respectively. Also we can note that the second fluorescence peak is weaker in comparison with the first fluorescence peak.
The purpose of this paper is to report the capability of Sol-Gel technology on preparing of silica monolith as a host material for Olive oil, and investigate the effect of converting Olive oil to a solid state on its optical properties. Major optical properties are determined from analysis of absorption and emission spectra to both of pure Olive oil and prepared doped silica sample.
2. Experimental
2.1. Samples Preparation
Sol-Gel process was used to preparing Silicon nanostructures monolith because it’s capable to producing highly
 (a)
(a)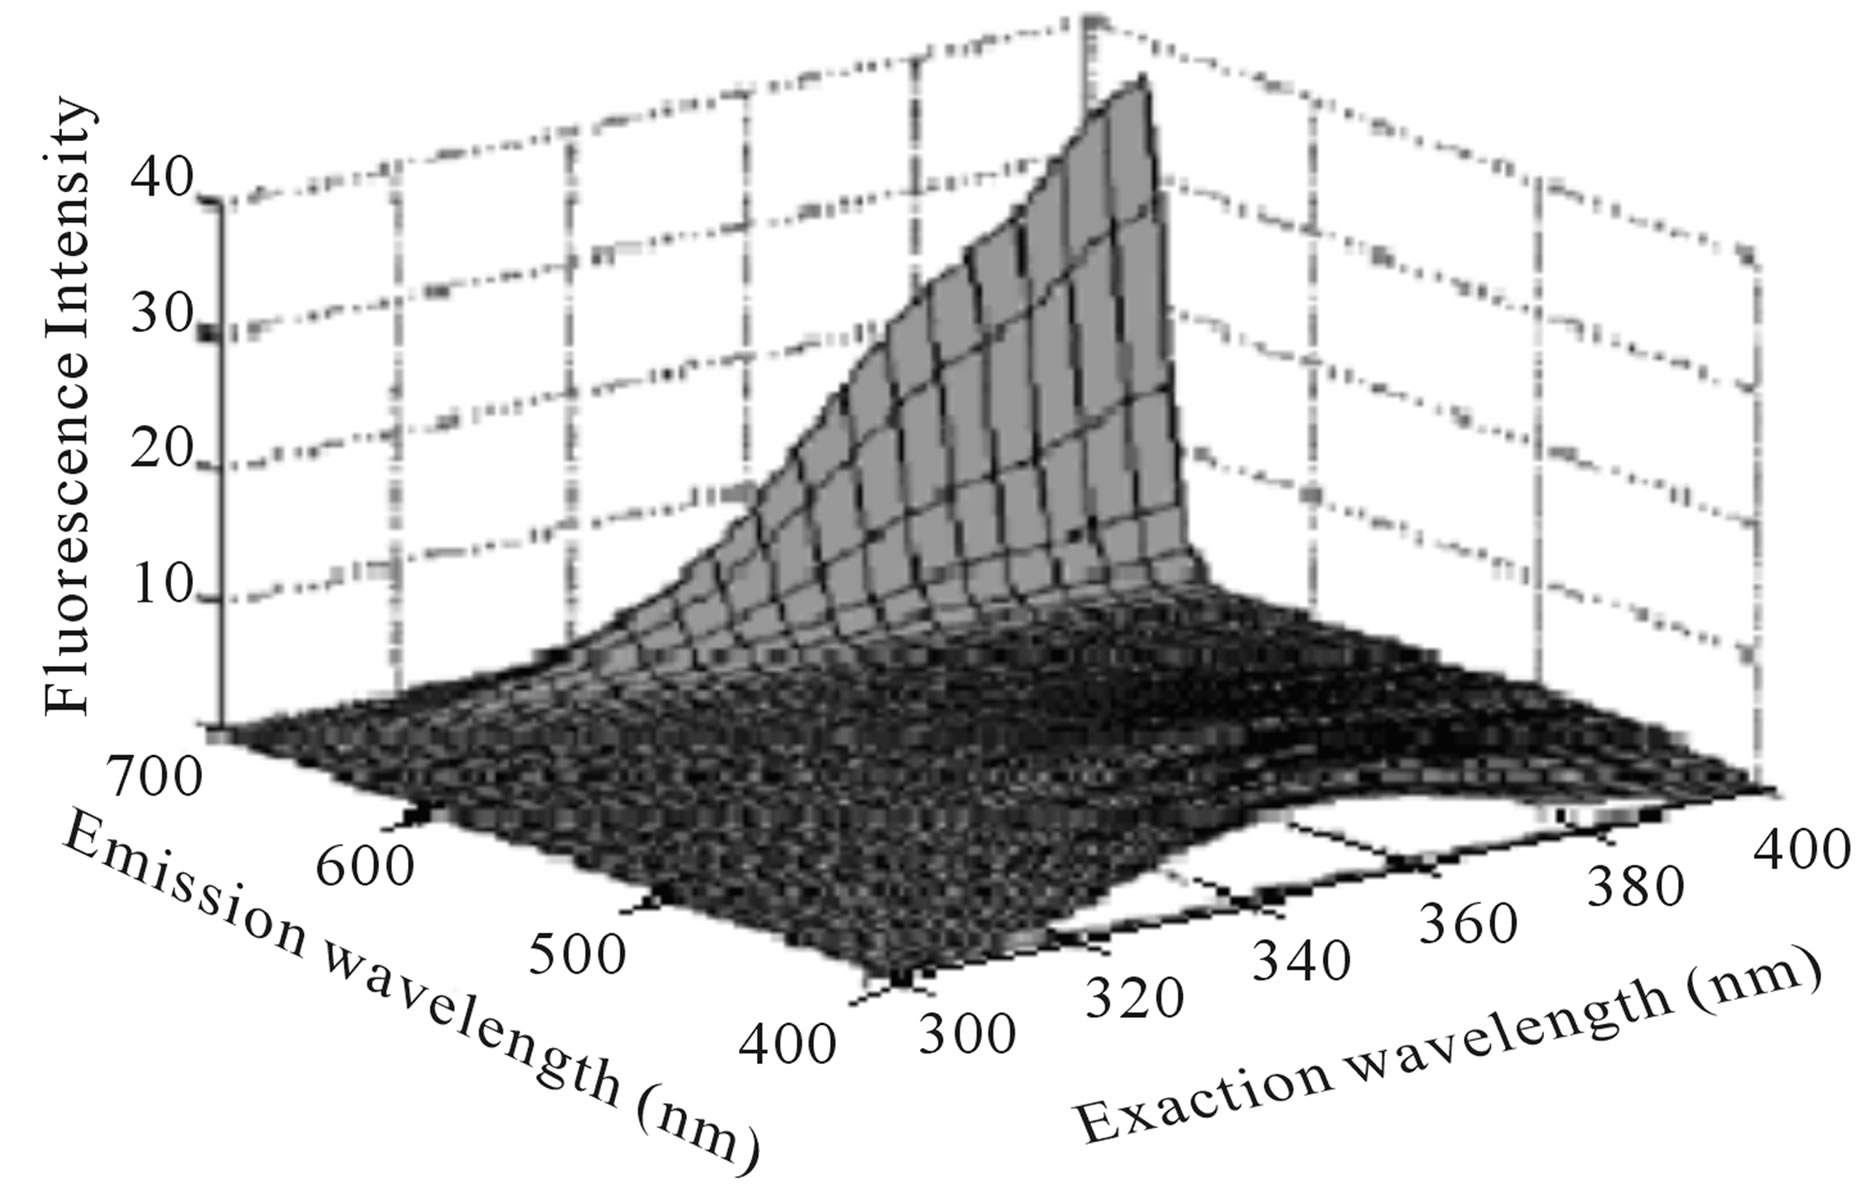 (b)
(b)
Figure 1. EEMs of a virgin (a) and a pure (b) olive oil between λex = 300 and 400 nm, λem = 400 and 695 nm [5].
 (a)
(a) (b)
(b)
Figure 2. EEMs of a virgin (a) and a pure (b) olive oil between λex = 300 and 400 nm, λem = 400 and 600 nm [5].
homogeneous metal oxide nanoparticles as well as its facility for dopant addition [10,11].
The doped and un-doped samples were synthesized by sol-gel method from tetraethylorthosilicate (TEOS) (Aldrich 98%), Ethanol (EtOH 99.9%) from GCC, hydrochlor ic acid (HCl, 34.5%) from BDH. Deionized water was used for the hydrolysis of (TEOS) and preparation of pure and doped SiO2 sol. The reaction was performed at a cooler water jacket (i.e. the solution was cooled by water at temperature (10˚C - 15˚C). The amount of each chemical in this procedure was TEOS:H2O:EtOH:HCl = 1:1:10:0.1 in molar ratio. All solution was prepared as follows: 1 mole of tetraethylorthosilicate (TEOS) and 1 moles of ethanol (EtOH) were mixed and stirred for 10 min. While stirring, 0.1 M catalysts in water were added dropwise to the solution until water to TEOS molar ratio of R = 2 are attained. For dopand samples, a 0.6 ml commercial Syrian Olive oil was used and added with ethanol before mixing with TEOS. All solutions were then stirred at room temperature for 2 hours further and aged for 24 hours before use.
After aging for 24 hour, first drying occurred for 2 hour at temperature 60˚C. Then samples left in room temperature without covers in order to permit solvent evaporation through the drying process. Figure 3 shows a Snapshot for prepared doped sample.
2.2. Samples Characterization
Structural characterizations of the doped and un-doped SiO2 samples were done by X-ray diffraction (XRD). θ - 2θ scans were recorded using ITAL-STRUCTURE diffractometer equipped. While Mid-IR spectra were obtained for the prepared samples using FT-IR spectrometer, Shimadzu, on KBr pellets of the samples.
Absorption spectra were measured at room temperature with TupCen UV-VIS Spectrometer. Emission spectra were measured at room temperature by using SolarLab mono chromatore. As excitation source we used the 405 nm/250 mW Laser diode. For comparison, further more absorption and emission spectra were measured to pure Olive oil.
3. Result and Discussion
Crystalline phases were not observed in the olive oil doped samples in agreement with the X-ray diffraction measurements as shown in Figure 4. The broad peaks presented of doped monoliths at about 2θ ~ 24.2˚, show that the Olive oil can be randomly distributed in the SiO2 network.
Fourier transform infrared (FTIR) absorption spectra in the range of 4000 - 400 cm−1 were taken. The FTIR spectrum of doped and un-doped samples was illustrated in Figure 5. The characteristics vibrational bands of silica were found in the FTIR spectra. Where; the absorption bands at about 472 cm−1, 808 cm−1 and 1100 cm−1 which were due to bending, symmetric stretching and asymmetric stretching vibrations of Si-O-Si groups respectively. The band at around 960 cm−1 which is ascribed to stretching vibration of silanol (Si-OH) groups [12,13], indicates the amount of these groups in the silica network [12]. The amount of silanol groups is proportional with the ratio of condensation reaction of Sol-Gel method, and indicates that condensation reaction dose not completely finished.
Another two bands were appeared at around 1600 cm−1 and 3400 cm−1. These two bands were the characteristics vibration of O-H bond in water molecules [12], and indicating that the drying process at 60˚C dose not com-
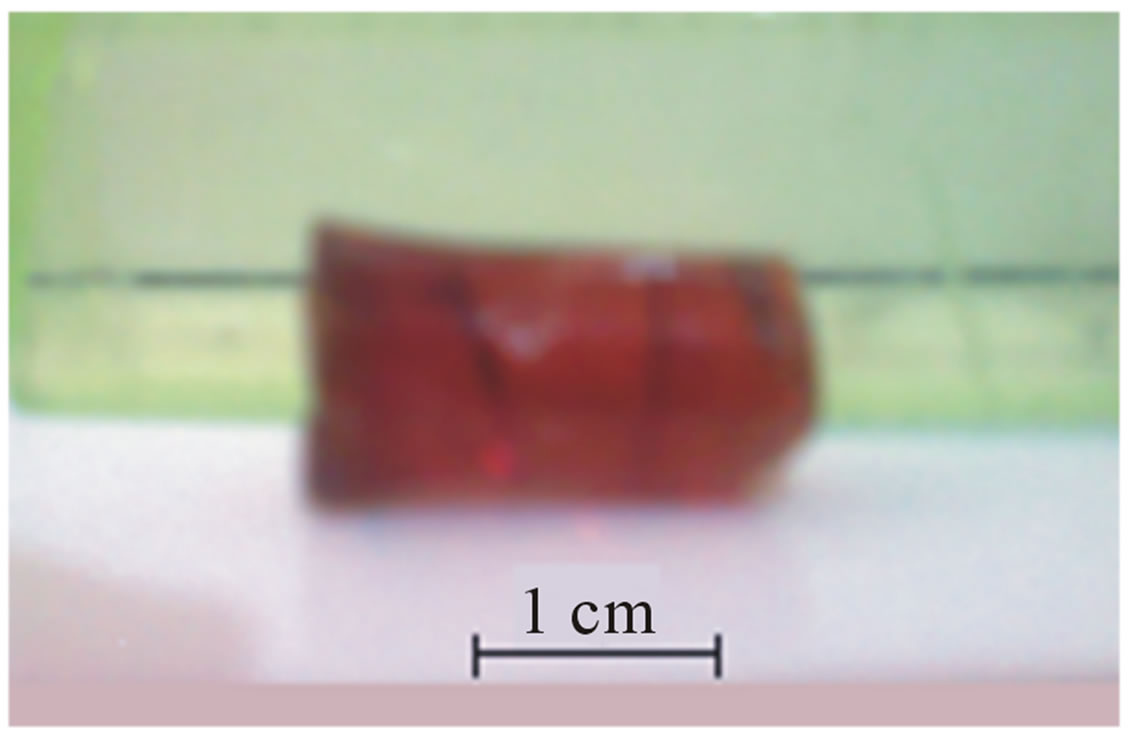
Figure 3. Snapshot for prepared silica sample doped with Olive oil.

Figure 4. X-ray diffraction patterns of SiO2 doped with Olive oil.

Figure 5. FTIR spectrums for samples: (A) SiO2 doped with Olive oil and (B) Pure SiO2.
pletely trap the water molecules from the pores of silica Xerogel network.
UV/Vis absorption spectrums in the range of 250 - 850 nm were taken at room temperature to pure olive oil and to prepared doped silica and presented in Figure 6. Absorption spectrum of pure olive oil has a strong two peak around wavelength at 409 nm and 668 nm, with three other weak peaks appears at wavelength around 506 nm, 534 nm and 610 nm [2,3]. All these peaks are disappearing from absorption spectrum of doped silica, in which it could see only wide absorption peak cover most of UV region. That’s mean silica matrix effect on optical properties of Olive oil through changing of its absorption bands.
To determine the optical characteristics of the samples, photoluminescence measurements were carried out using the 405 nm/250 mW Laser Diode for excitation. Fluorescence spectrums in the range of 450 - 900 nm were taken at room temperature to pure Olive oil and to prepared silica doped with Olive oil and presented in Figure 7. The fluorescence spectrum of pure Olive oil in range 600 - 695 nm have a peak around the wavelength 678nm which attributed to chlorophylls [5,9]. The fluorescence peak at the range 450 - 600 nm does not appears which could be attributed that the fluorescence peak is so weak in comparison with other fluorescence peak.
The fluorescence spectrum of doped sample show two fluorescence peaks, first one in range of 600 - 695 nm appear at wavelength 681 nm which attributed to chlorophylls. The seconds peaks in range of 450 - 600 nm appear at wavelength 585 nm which attributed to Vitamin E [5,8,9]. Unlike with fluorescence spectrum of pure Olive oil, the intensity of the second peak becomes strong with
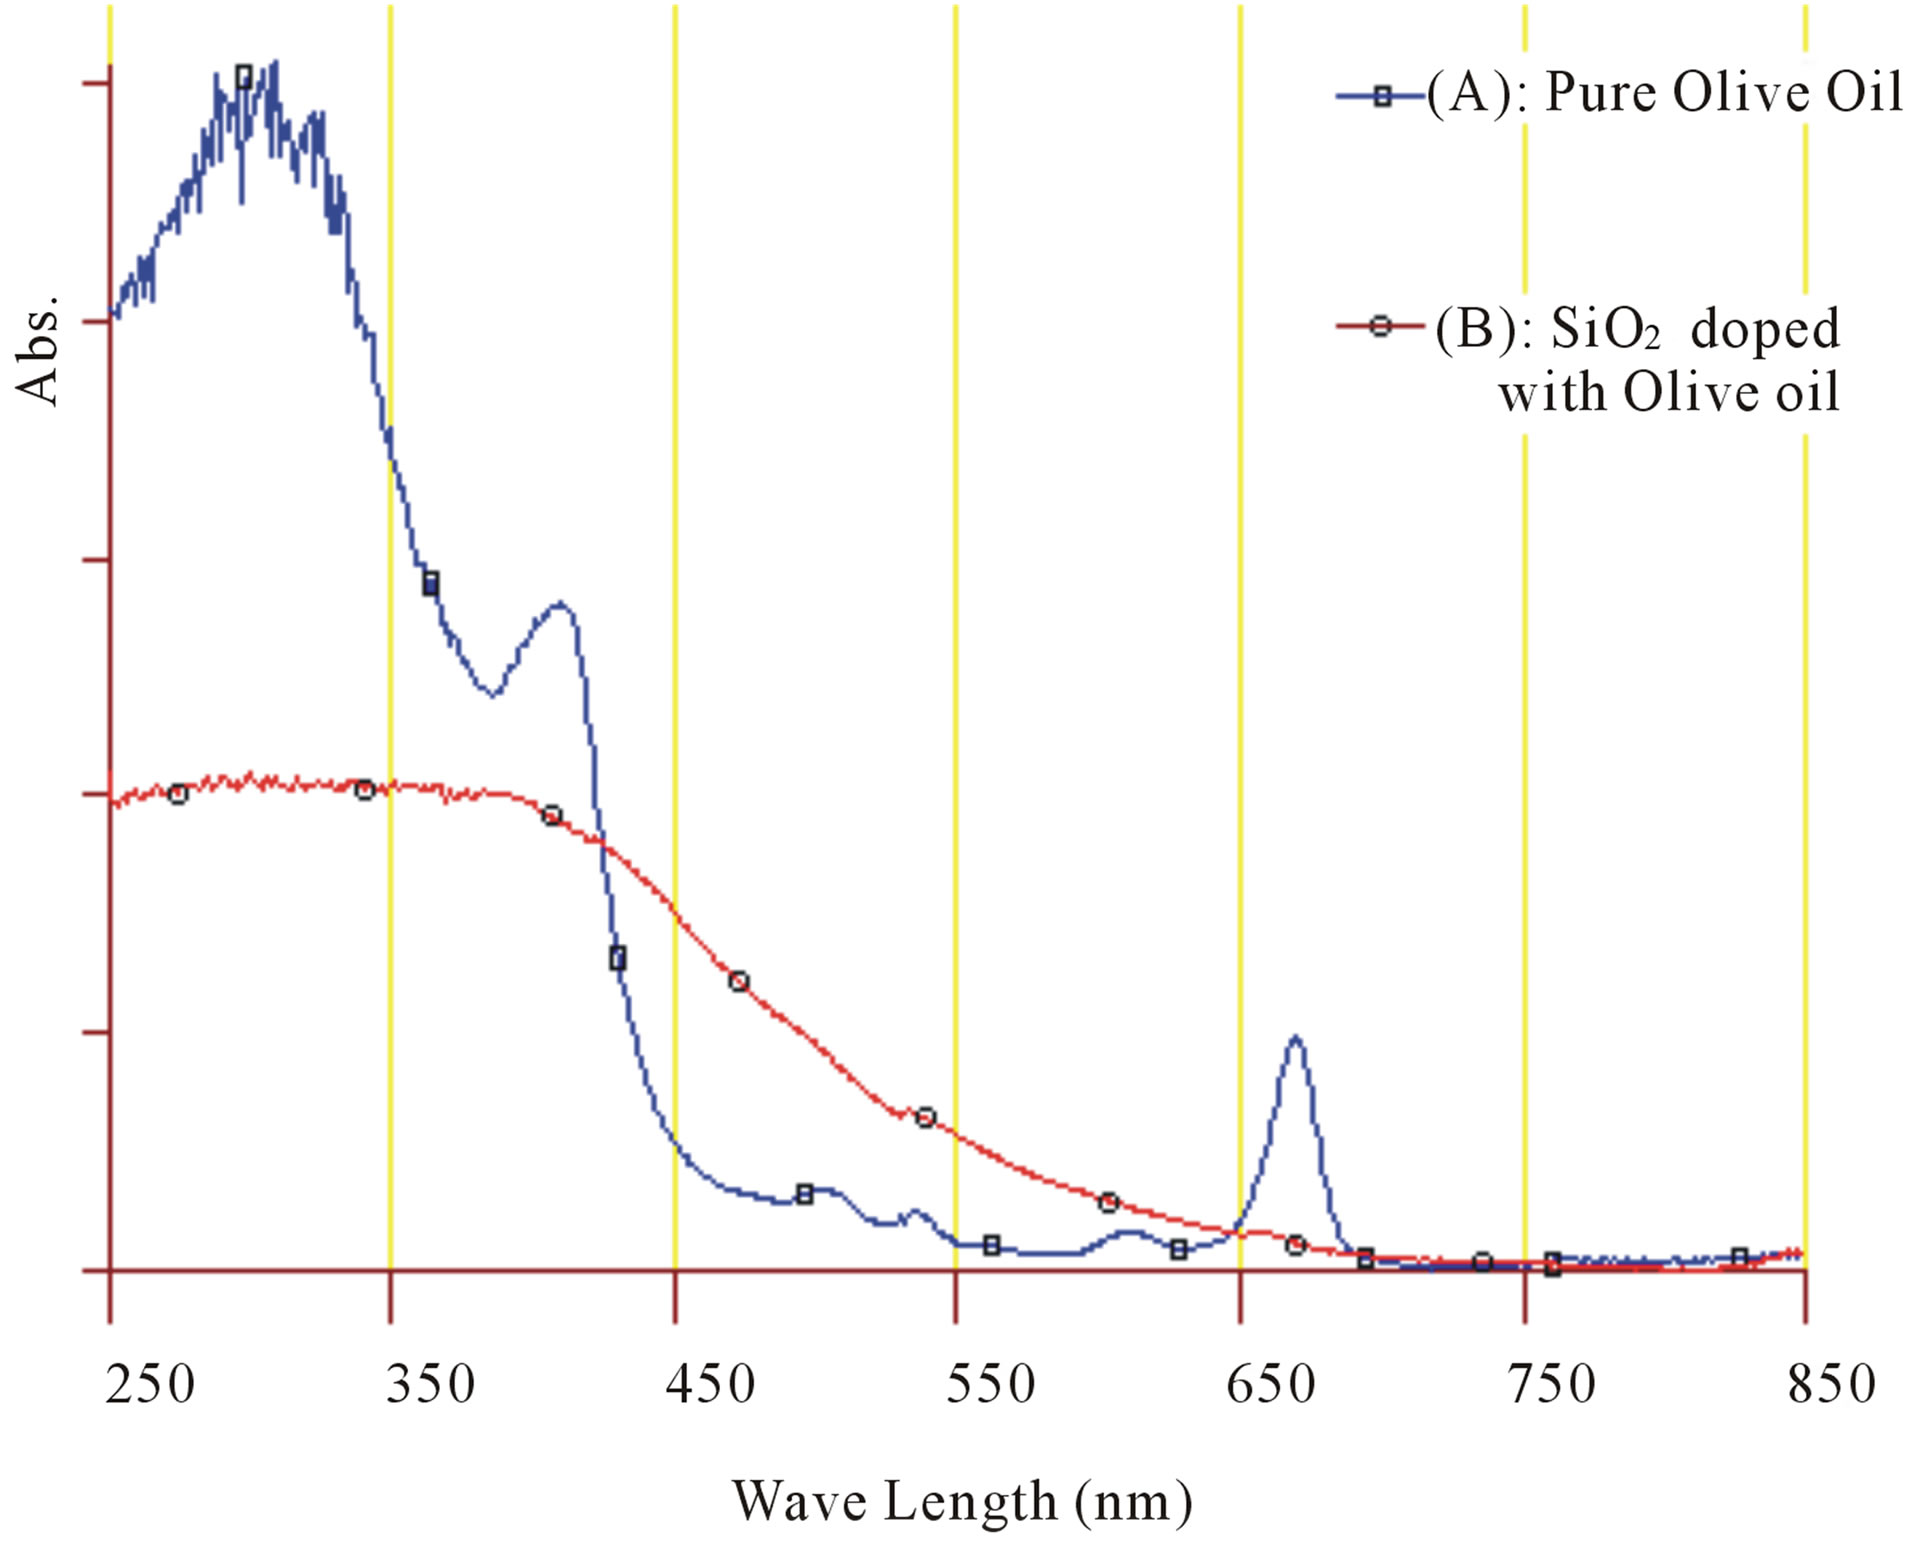
Figure 6. Absorption spectrums for: (A) Pure Olive oil and (B) SiO2 doped with Olive oil.
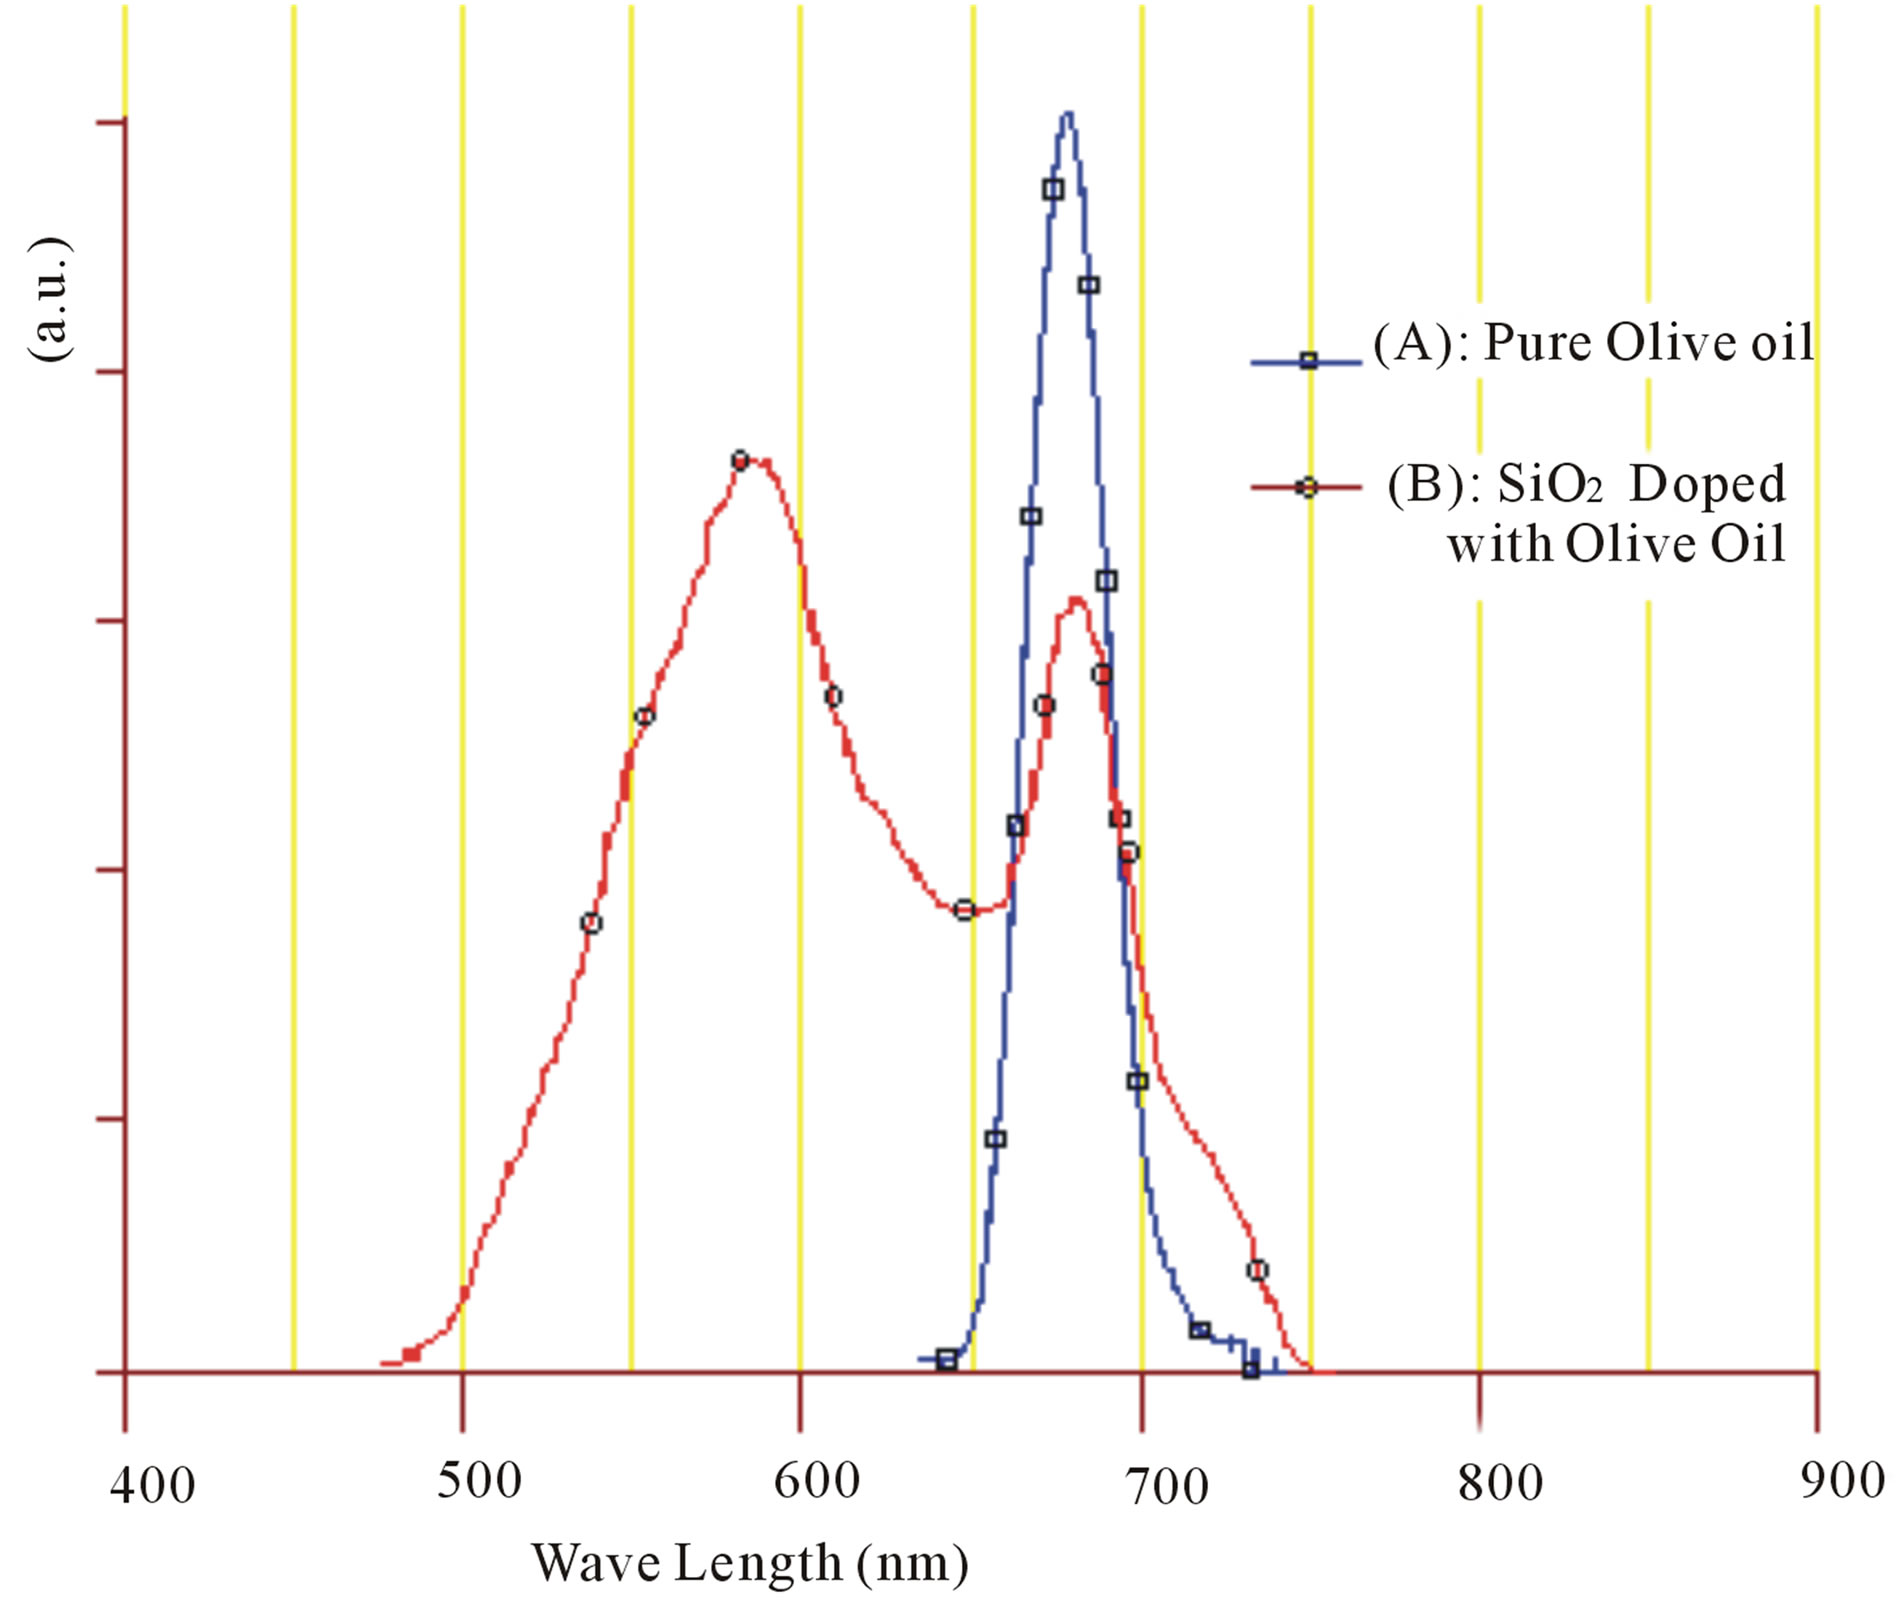
Figure 7. Fluorescence spectrums for: (A) Pure Olive oil and (B) SiO2 doped with Olive oil.
wide bandwidth and somewhat larger than the intensity of first peak. That’s mean the doping process enhanced of fluorescence activity of Olive oil especially in the range of 450 - 600 nm. According to Figure 2, it can note that SiO2 host medium effect on the second fluorescence peak (attributed to Vitamin E) and shift the peak location intensity to wavelength around 585 nm.
4. Conclusions
The Olive oil doped Nanosilica is successfully prepared by wet chemical synthesis method. The doped prepared Nanosilica sample has amorphous structures, and seems to be transparent and unbroken which due to the suitable Sol-Gel parameters used. Some absorption bands of Olive oil are disappearing from doped silica absorption spectrum. Fluorescence spectrum of pure olive oil shows only a single strong fluorescence peak at 678 nm which attributed to chlorophylls, while fluorescence spectrum of doped sample shows two strong fluorescence peaks at the wavelength 681 nm and 585 nm which attributed to chlorophylls and Vitamin E respectively. A peak shift was recorded on the Vitamin E fluorescence peak.
The doping process enhances of fluorescence activity of Olive oil especially at the range of 450 - 600 nm through enhancing intensity of the fluorescence peak corresponding to Vitamin E.
Absorption and fluorescence spectrums to doped silica sample give a good indication in direction of using SolGel technique to prepare of Olive oil doped SiO2 as an optical active material.
5. Acknowledgements
This work was financially supported by High institute for laser technology and their applications/Damascus University.
REFERENCES
- J. Gracian, “Analysis and Characterization of Oils, Fats and Fat Products,” Vol. 2, John Wiley & Sons, London, 1968.
- S. Fawaz, M. A. Gafary and L. A. Mamouly, “Determination of the Elements in the Olive Oil Responsible for the Luminescence Spectra Using a Green Laser,” AIP Conference Proceedings, Vol. 1172, Cairo, 17-21 May 2009, pp. 20-23.
- F. Saiof, “Spectral Characteristic of Olive Oil and Some Other Vegetable Oils in Range 200 - 2000 nm,” 2009.
- F. Guimet, R. Boqué and J. Ferré, “Cluster Analysis Applied to the Exploratory Analysis of Commercial Spanish Olive Oils by Means of Excitation-Emission Fluorescence Spectroscopy,” Journal of Agricultural and Food Chemistry, Vol. 52, No. 22, 2004, pp. 6673-6679. doi:10.1021/jf040169m
- F. Guimet, J. Ferré, R. Boqué and F. X. Rius, “Application of Unfold Principal Component Analysis and Parallel Factor Analysis to the Exploratory Analysis of Olive Oils by Means of Excitation-Emission Matrix Fluorescence Spectroscopy,” Analytica Chimica Acta, Vol. 515, No. 1, 2004, pp. 75-85. doi:10.1016/j.aca.2004.01.008
- F. Guimet, R. Boqué and J. Ferré, ”Study of Oils from the Protected Denomination of Origin “Siurana” Using Excitation Emission Fluorescence Spectroscopy and ThreeWay Methods of Analysis,” Grasas y Aceites, Vol. 56, No. 4, 2005, pp. 292-297. doi:10.3989/gya.2005.v56.i4.95
- A. Sayago, M. T. Morales and R. Aparicio, “Detection of Hazelnut Oil in Virgin Olive Oil by a Spectrofluorimetric Method,” The Journal European Food Research and Technology, Vol. 218, No. 5, 2004, pp. 480-483. doi:10.1007/s00217-004-0874-9
- N. B. Kyriakidis and P. Skarkalis, “Fluorescence Spectra Measurement of Olive Oil and Other Vegetable Oils,” Journal of AOAC International, Vol. 83, No. 6, 2000, pp. 1435-1439.
- F. Guimet “Olive Oil Characterization Using ExcitationEmission Fluorescence Spectroscopy and Three-Way Methods of Analysis,” PH.D. Thesis, University of Rovira i Virgili, Tarragona, 2005.
- J. Livage, M. Henry and C. Sanchez, “Sol-Gel Chemistry of Transition Metal Oxides,” Progress in Solid State Chemistry, Vol. 18, No. 4, 1988, pp. 259-342. doi:10.1016/0079-6786(88)90005-2
- J. P. Boilot, F. Chaput, T. Gacoin, et al., “Organic-Inorganic Solids by Sol-Gel and Optical Applications,” Comptes Rendus de l'Académie des Sciences, Vol. 322, No. 1, 1996, pp. 27-43.
- L. Yang, “Fabrication and Characterization of Microlasers by Sol-Gel Method,” Ph.D. Thesis, California Institute of Technology, California, 2005.
- M. N. Muralidaran, C. A. Rasmitha and R. Ratheesh, “Photoluminescence and FTIR Studies of Pure and Rare Earth Doped Silica Xerogel and Aerogel,” Journal of Porous Materials, Vol. 16, No. 6, 2009, pp. 635-640.