Advances in Materials Physics and Chemistry
Vol. 2 No. 1 (2012) , Article ID: 17890 , 10 pages DOI:10.4236/ampc.2012.21001
Carbon Nano Material Synthesis from Polyethylene by Chemical Vapour Deposition
1Chemistry Department, Solapur University, Solapur, India
2N. Shankaran Nair Research Centre for Nanotechnology and Bionanotechnology, S.I.C.E.S. College, Ambarnath, India
3Department of Electrical Engineering, Chubu University, Kasugai, Japan
Email: *sharonmaheshwar@gmail.com, *sharon@iitb.ac.in
Received August 14, 2011; revised October 8, 2011; accepted November 14, 2011
Keywords: Polyethylene; Pyrolysis; LDPE; HDPE; LLDPE; Carbon Nano Material (CNM); Carbon Nano Beads (CNB); Carbon Nano Tubes (CNT)
ABSTRACT
Three different types of Polyethylene family, High Density Polyethylene, (HDPE), Low Density polyethylene (LDPE) and Linear Low Density polyethylene (LLDPE) polymers having different molecular weight and density; were pyrolyzed in the temperature range of 550˚C - 1050˚C under H2, N2 and Ar gases. Taguchi Optimization technique was applied to find out the best operating conditions to get maximum yield of carbon nano material (CNM). For Taguchi optimization, experimental set up was done in two different temperature ranges i.e. 550˚C - 750˚C and 850˚C - 1050˚C. CNMs synthesized were characterized by SEM, TEM, Micro Raman and XRD analysis. HDPE was found to yield maximum CNM. Its pyrolysis at 750˚C under hydrogen atmosphere for 2h gave carbon nano beads and some carbon nano tubes. Whereas under same conditions at 1050˚C more multi wall carbon nano tubes (MWCNT) were produced, with some carbon nano beads. XRD data confirmed the graphitic nature of carbon-nanotube. The intensities of G-band and D-band of Raman spectra suggested that CNM has more defect sites and spectra were similar for CNM obtained in both the temperature ranges. The TGA analysis of CNM obtained at 550˚C - 750˚C, indicated that they are not amorphous carbon and CNM obtained at 850˚C - 1050˚C decomposed at 624˚C - 668˚C; suggesting that CNT synthesized at this temperature range were more crystalline than what was obtained at the 550˚C - 750˚C.
1. Introduction
Discovery of carbon nano material (CNM) in 1991 [1] has attracted enormous attention of scientists; because of their unique structural, chemical, mechanical and electrical properties. In order to utilize CNM for commercial applications, efforts are being made to reduce the cost of its production. Because of its simplicity, CVD technique has been found to be the most popular technique for the large scale production of CNM. One of the factors controlling the price of the CNM is the precursors used for its production. The conventionally used precursors are expensive petro-derivatives e.g. benzene, acetylene etc. However, plant derived waste products like camphor, oils of non-edible plants [2-5] have also been tried, in our lab as source of cheaper precursor.
In our pursuit of getting a cheaper precursor we have directed our efforts to use waste plastics; especially polythenes of thickness of less than 50 µm that are creating environmental disposal problems. Since these materials are composed of polyethylene (PE) and contains long linear or branched chains of hydrocarbons (which are a good precursor for synthesis of CNM) it was thought to be appropriate to develop the pyrolysis technology to synthesize CNM from waste plastics. This attempt will not only solve the problem of disposal of waste plastic in most ecofriendly way (as it converts plastic in absence of oxygen, thus does not produce oxidized toxic carbon compounds like carbon monoxide and dioxane) but also converts the waste (plastic) to wealth (CNT). There has been efforts made in this direction, but due to proprietor and patentable nature of the work, there are very few publications available.
In order to establish conditions of synthesis of CNM from waste plastics, it was decided to develop the technique for the synthesis of CNM first from virgin PE polymers. This was necessary because the waste plastic may contain mixture of different types of polymers. In this paper results obtained with only virgin polymers are discussed; though we have successfully synthesized CNT using same methodology from waste PE also. Application for getting patent has been applied; hence detail cannot be disclosed at present.
Since there were more than 3 parameters involved for pyrolysis techniques and each parameter was with 3 variables, it was decided to use Taguchi Optimization Technique to find out the most suitable parameters of pyrolysis that can give maximum yield of CNM [6-8].
1.1. Taguchi Optimization Methodology
In a pyrolysis process the product’s quality and quantity varies widely due to the parameters like temperature, flow rate and type of carrier gas, catalyst and precursor etc. Each parameters can have several levels. For example, temperature can have a range from 400˚C to 900˚C. Likewise other parameters will also have various levels. Considering these factors, the number of experiments becomes enormous to select the most effective parameters which can give the desired product. Taguchi Optimization Technique gives an opprotunity to carry out minimum number of experiments yet giving the best desired parameters and its level to get the desired product [9,10].
Taguchi method is based on calculating the statistical analysis of “Orthogonal Arrays” (OA) of data [11,12]. The ANOVA is used to analyse the results of the OA experiment to determine how much variation in each parameters has contributed towards the production of desired product. This is found out by calculating the Signal-to-Noise ratio. Signal-to-Noise ratios (S/N) are log functions of desired output. If our interest is in getting product with largest quantity, then “larger the better” is used for such calculation. This is calculted by using the Equation (1):
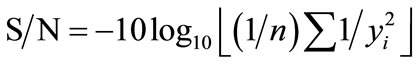 (1)
(1)
where “yi” is the mean response calculated as 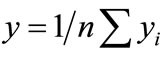 and n is the number of experiments carried out under similar conditions.
1.2. Calculation for Effect of Each Parameter
To determine the effect of each parameter level (mi) average value of S/N ratios is calculated for each parameter using “Analysis of Mean” (ANOM) [9-13]. For this calculation the S/N ratios of each experiment with corresponding parameter levels are calculated using Equation (2).
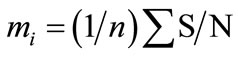 (2)
(2)
Two types of average value of S/N ratio are calculated. One is overall mean S/N ratio calculated from the entire experiments viz. from nine experiments of L9 orthogonal array (Tables 1 and 2). The second average S/N ratio is calculated for each parameter from Equation (1). Sum of Squares (SOS) are calculated by using Equation (3),
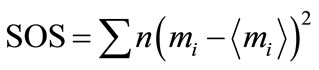 (3)
(3)
where,  is average value of mi.
The total Degrees of Freedom (DOF) is considered as (number of levels of paprameters minus one). If there are three levels for each parameters then DOF = 2.
Factor of Effect (FOE) are calculated from Equation (4),
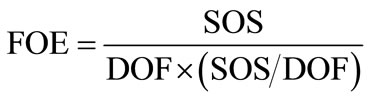 (4)
(4)
From this FOE the percentage effect of each parameter on the production of the desired product is calculated.The main advantage of this technique is that, if for example there are 4 parameters each having 3 variables, and if they are to be repeated for 3 times, the total number of experiments becomes very large. Taguchi Optimization requires only 27 experiments if they are to be repeated three times. It is for these advantages, we have used Taguchi Optimization technique in the present work.
2. Material and Methods
Pyrolysis of three types of PE i.e. High Density Polyethylene, (HDPE), Low Density polyethylene (LDPE) and Linear Low Density polyethylene (LLDPE) polymers was performed. The parameters considered were 1) two different ranges of temperature i.e. lower temperature range (550˚C - 750˚C) and higher temperature range (850˚C - 1050˚C); 2) the carrier gases namely, hydrogen, nitrogen and argon and 3) duration of pyrolysis namely 1, 2 and 3 h. In order to calculate the impact of parameters on the production of CNM, factor effect was also calculated. Details of the methodology for the calculations of Taguchi Optimization technique are discussed elsewhere [6-8].
Different Parameters & Their Levels for L-9 Orthogonal Matrix
As per Taguchi optimization methodology, two tables were constructed from the various combinations of all possible parameters with a minimum of three variables of each parameter. Variable parameters were selected which are orthogonal to each other. These parameters were: pyrolysis temperature, duration, carrier gas and type of polyethylene. Since, Taguchi Optimization technique can use only three levels of a parameter; two separate orthogonal tables were constructed, one orthogonal table utilizing 550˚C - 750˚C and the other table using 850˚C - 1050˚C temperature. Thus, two L9 orthogonal tables were constructed by using the parameters and their levels as mentioned in Tables 1 and 2. Nano powder of iron was used as Catalyst and it was kept same for all experiments.
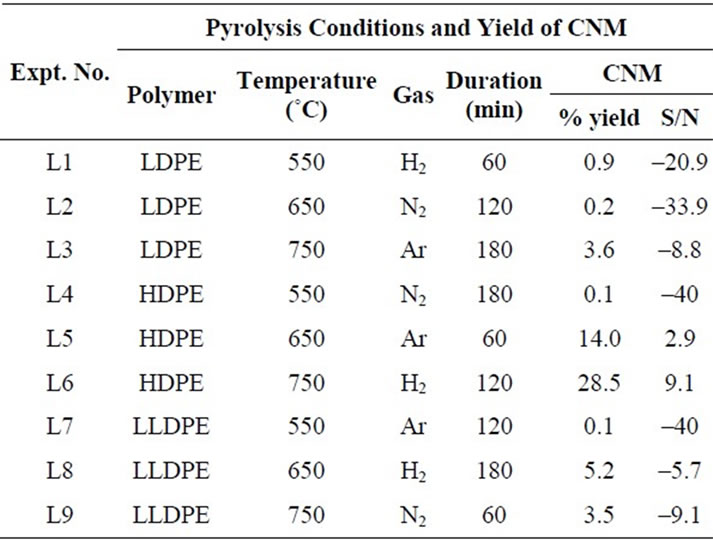
Table 1. The orthogonal array of parameters to be optimized by Taguchi method and their impact on yield of CNM at 550˚C - 750˚C (Table also shows the percentage yield of carbon nanomaterial obtained and calculated values of signal to noise ratio).
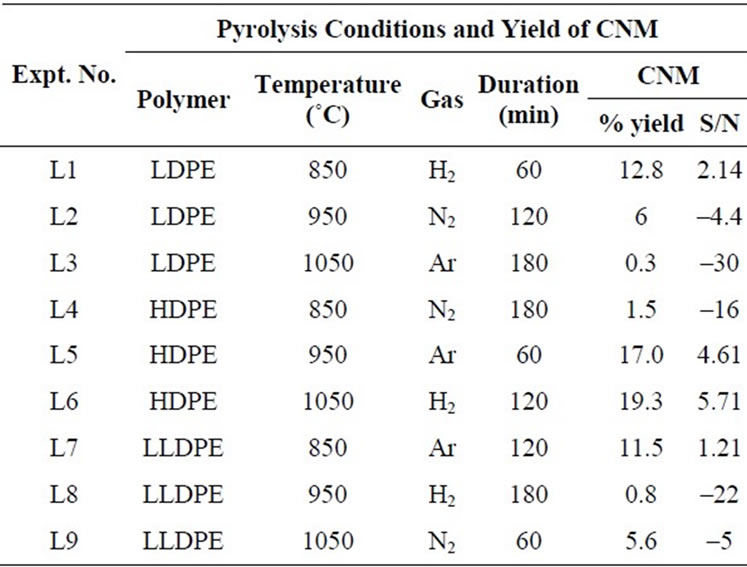
Table 2. The orthogonal array of parameters to be optimized by Taguchi method and their impact on yield of CNM at 850˚C - 1050˚C (Table also shows the percentage yield of carbon nanomaterial obtained and calculated values signal to noise ratio).
Pyrolysis was carried out for each set of condition as mentioned in Tables 1 and 2. Percentage yield of CNM and its S/N ratio were calculated for each experimental result by using Equation 1. The yields of CNM as well as S/N ratio calculated from each set are also given in Tables 1 and 2. CNM was analyzed by SEM, TEM, Micro Raman Spectroscopy, XRD and TGA.
3. Results and Discussions
3.1. Taguchi Optimized Pyrolysis Results of Temperature Range 550˚C - 750˚C
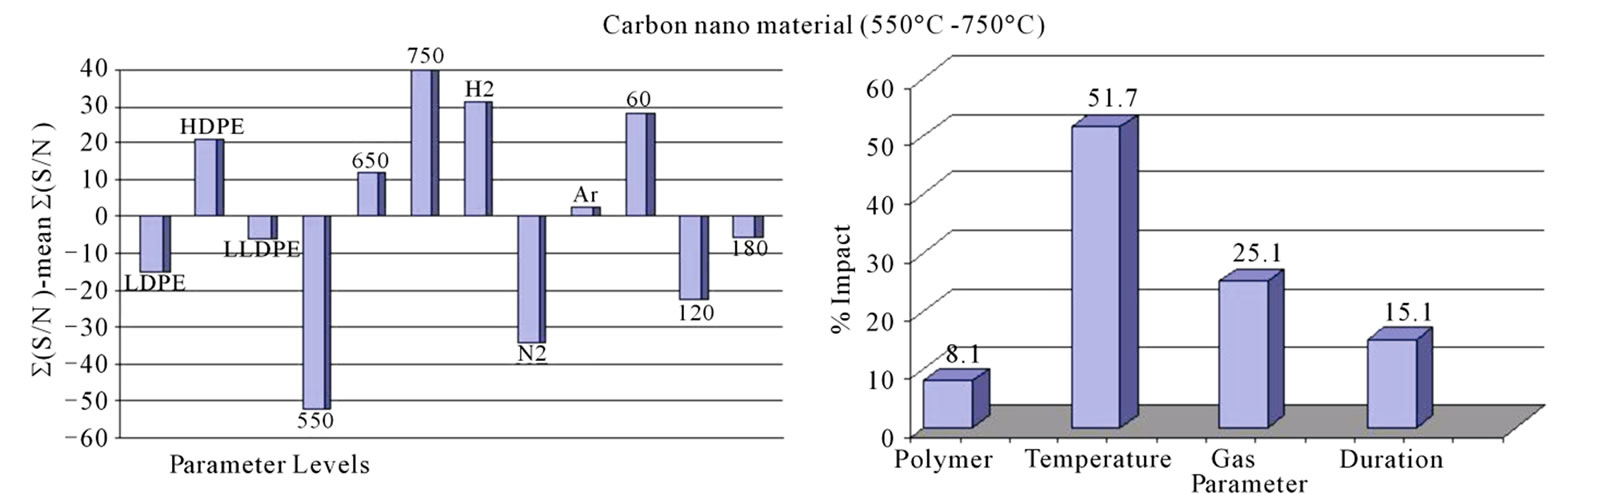
Signal/Noise (S/N) ratio of CNM produced under different conditions is plotted in Figure 1. Since our interest was to find out the condition of pyrolysis which could give the maximum amount of CNM, “Larger the Better” condition was used to calculate the S/N ratio. All those levels of parameters for which S/N ratio was more positive to the mean value of S/N ratio were considered as suitable levels for the production of CNM (Figure 1(a)). Amongst three types of PE polymers, HDPE appeared to give the best yield. The calculation of % impact of each parameter on the production of CNM (Figure 1(b)) suggests that maximum impact was that of the temperature (51.69%) followed by gas (25.12%) and then the duration (15.14%). It was interesting to note that when the pyrolysis was done in the temperature range of 850˚C - 1050˚C duration of pyrolysis had highest impact (84.8%) on production of carbon nano tubes (Figure 2(b)).
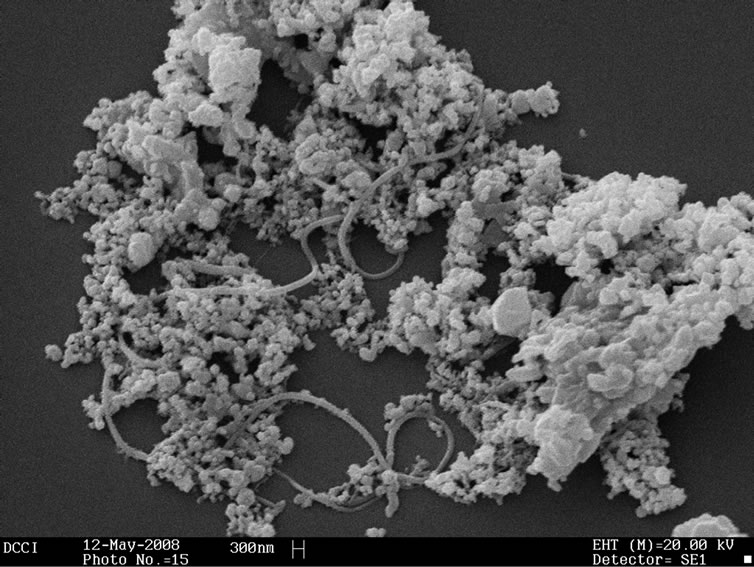
SEM analysis—as it can be seen in Figure 2(a), at 750˚C, pyrolysis under hydrogen atmosphere for 2 h duration yielded a mixture of carbon nano beads with some amount of carbon nano tubes.
TEM micrograph—of CNT confirmed that the CNTs are multi wall carbon nano tubes (Figure 3).
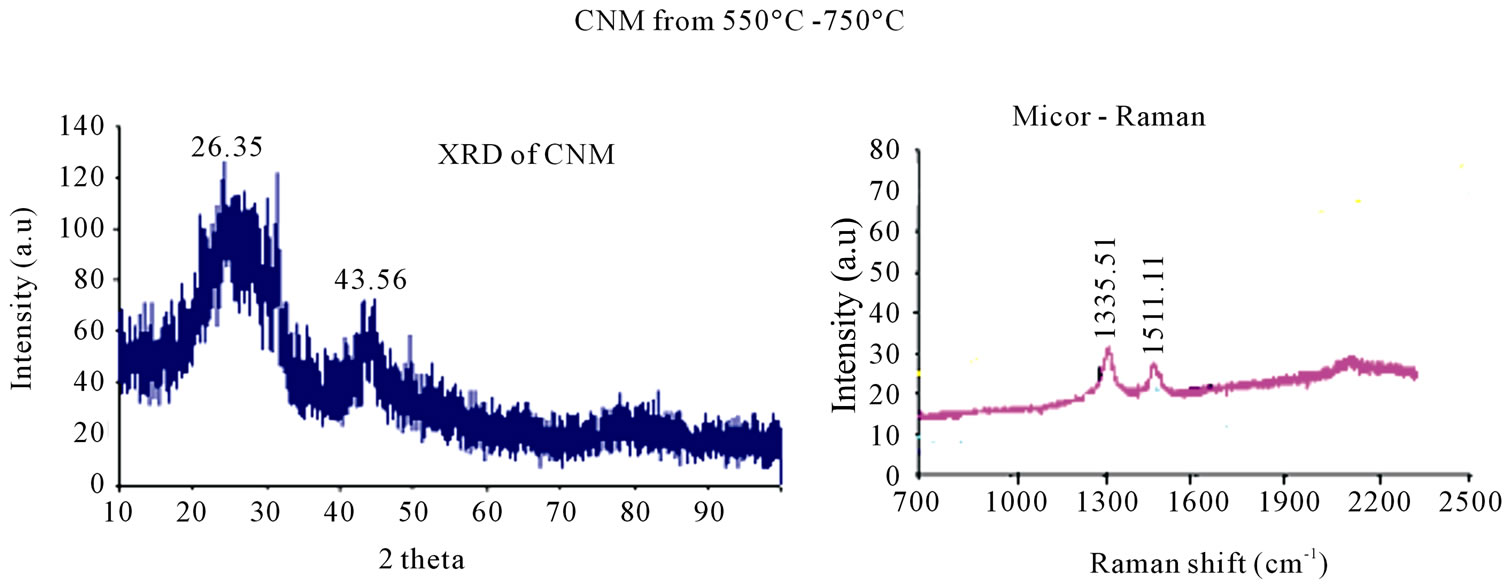
XRD peaks at 26.35 and 43.56 of carbon materials, obtained from pyrolyzing HDPE at 750˚C (Figure 4(a)) suggests CNM to possess graphitic nature along with some amorphous carbon.
Raman spectra (Figure 4(b)) of all the samples showed almost similar results, with D-band around 1335 cm–1 and G-band around 1511.11 cm–1. The intensity of Gband is less than that of D-band suggesting that CNM has more defect sites. The position of peak for G-band is more towards the D-band also supports this conclusion.
3.2. Taguchi Optimized Pyrolysis Results of Temperature Range 850˚C - 1050˚C
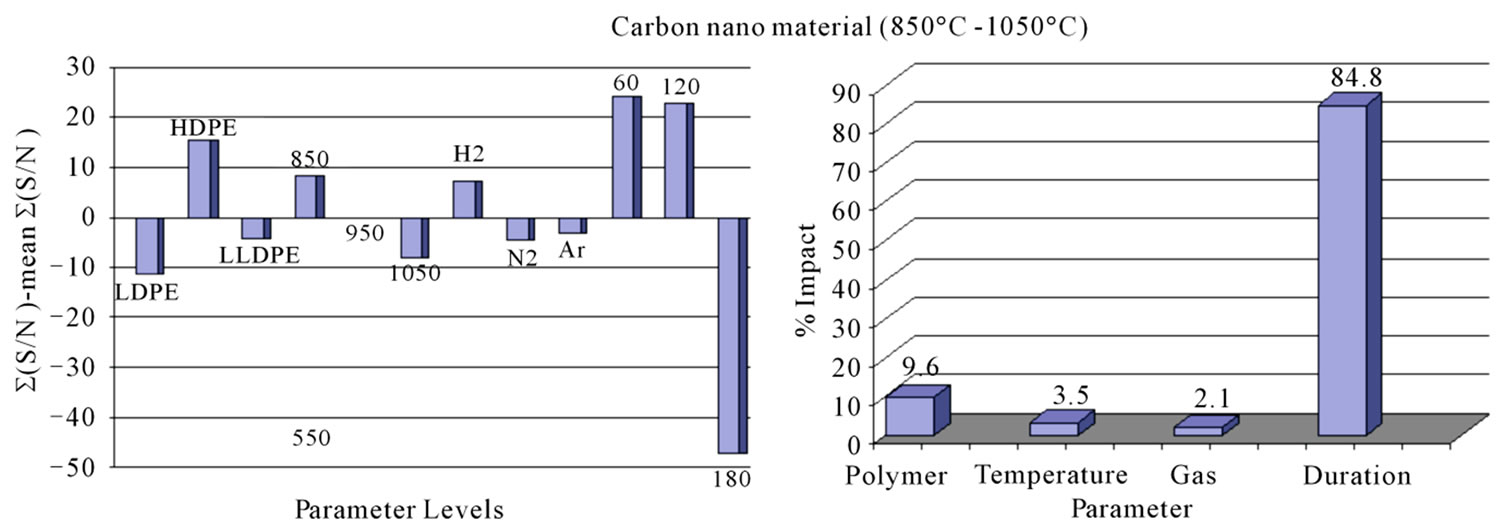
S/N ratio—calculation of CNM obtained by the pyrolysis of HDPE in the temperature range of 850˚C - 1050˚C shows that maximum yield of CNM was obtained at 1050˚C in presence of hydrogen atmosphere for pyrolysis duration of 2 h (Figure 5(a)). It is interesting to note that while for 550˚C - 750˚C; temperature showed the highest % impact on the production of CNM, whereas in the range of 850˚C - 1050˚C, temperature had least impact i.e. only 3.5% and duration of pyrolysis had more impact of 84.78% (Figure 5(b)). Similar results have been observed earlier also while using plant material as precursors [8].
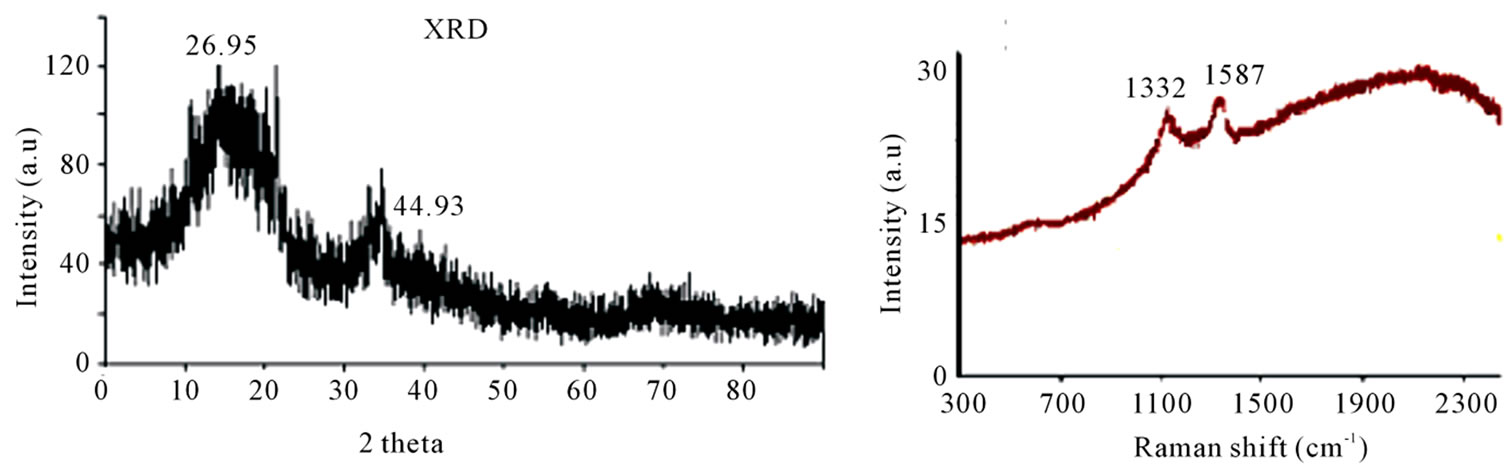
XRD—peaks (Figure 6(a)) of CNM obtained from pyrolyzing HDPE at 850˚C, confirms the CNM to be graphitic carbon (26.3˚ 2θ).
Raman spectra were almost same for CNM produced in the temperature range of 850˚C - 1050˚C. Therefore, a typical Raman spectra obtained from CNT at 850˚C is presented in Figure 6(b), which shows D-band at 1332
 (a) (b)
Figure 1. (a) Graph showing the variation in signal to noise ratio for each level of corresponding parameters. Mean value of signal to noise ratio has been taken as zero and calculation is done with “larger the better”; (b) Shows the % impact of each parameters.
 (a)
(a)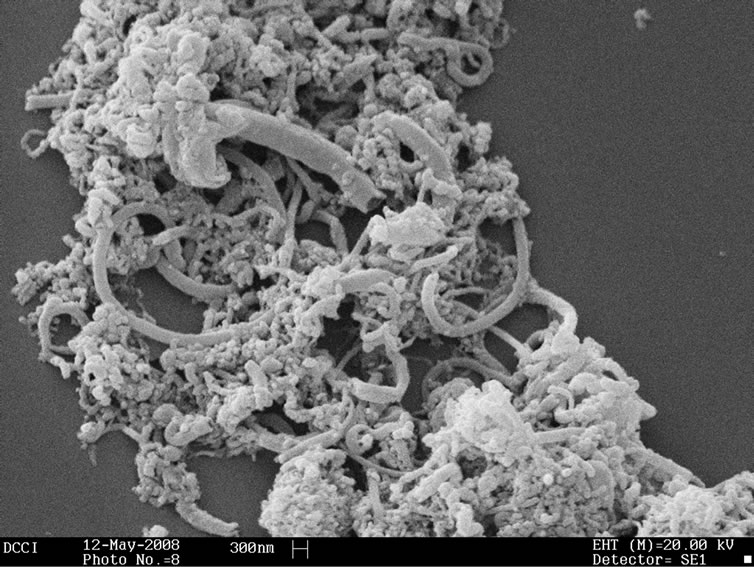 (b)
(b)
Figure 2. SEM micrographs of CNM obtained by pyrolyzing HDPE in hydrogen atmosphere for 2 h at (a) 750˚C showing mixture of carbon nano beads and some carbon nano tubes and (b) 1050˚C showing more carbon nano tubes with some carbon nano beads.
cm–1 indicating defect in graphitic carbon. Further Gband at 1587 cm–1 is the characteristic peak for graphitic carbon. It is interesting to note that D-band obtained with carbon produced either at 750˚C or 850˚C are almost the same (~1332 - 1335 cm–1), which appears at the expected peak of carbon containing defects (1332 cm–1). However, the G-band peaks obtained with carbon produced at 750˚C is at 1511 cm–1 while for carbon produced at 850˚C is 1587 cm–1. This suggests that while the defect present in both forms of these carbons are almost the same type but graphitization has taken place more at higher temperature.
SEM micrographs of CNM obtained at 550˚C - 750˚C, and those obtained in the temperature range of 850˚C - 1050˚C are shown in Tables 3 and 4 along with their TGA spectra. It interesting to observe that CNM obtained at lower temperature range i.e. 550˚C - 750˚C, most of
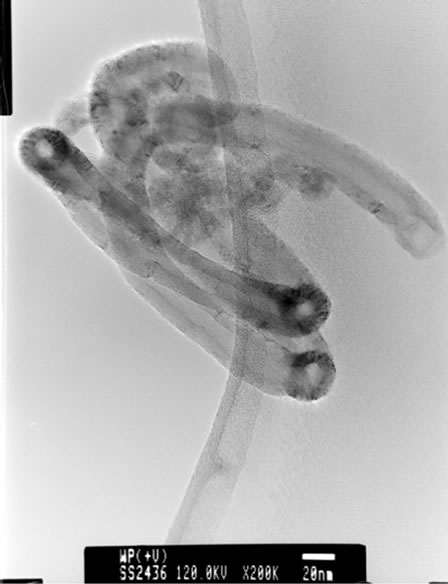
Figure 3. TEM micrographs of CNT (obtained by pyrolyzing HDPE in hydrogen atmosphere for 2 h at 1050˚C showing coiled multi walled carbon nano tubes.
 (a) (b)
Figure 4. (a) XRD of the CNM produced by HDPE at 750˚C shows peak at 26.35 (002) and 43.56 which are characteristic peak of the graphitic material; (b) Micro Raman spectra of CNM obtained in the temperature range 550˚C -750˚C.
 (a) (b)
Figure 5. (a) Graph showing the variation of signal to noise ratio for each level of corresponding parameters. Mean value of signal to noise ratio has been taken as zero and calculation is done with “larger the better” (850˚C - 1050˚C); (b) Showing the % impact of each parameters.
 (a) (b)
Figure 6. (a) XRD analysis of the un-purified CNM from LDPE at 850˚C showing characteristic peaks of the graphitic material; (b) Micro Raman of CNM obtained from 850˚C - 1050˚C showing D-band at 1332 cm–1, indicating defect in graphitic carbon.
them are carbon beads with very small amount of carbon nanotubes. But at higher temperature beads seems to have elongated to CNTs among with some remnant carbon nano beads, hence there is a large percentage of carbon nanotubes and very few carbon nano beads. Taguchi optimization methodology has also suggested that yield of carbon nano tubes is affected more by the temperature (Figure 1(b)) or duration of exposure to temperature (Figure 5(b)) during of pyrolysis; as also noted earlier with other precursors [8]. The SEM micrographs of Figure 2 suggest that carbon nano beads and carbon nano tubes are obtained when HDPE is pyrolyzed at 750˚C and 1050˚C respectively.
TGA Results of the derivatives of TGA also showed that CNM obtained at 550˚C - 750˚C, decomposed in the temperature range of 559˚C - 648˚C which is an indication that these materials are not amorphous carbon (Table 3). Derivatives of TGA of CNM obtained at 850˚C - 1050˚C shows that these materials decomposes at 624˚C - 668˚C; suggesting that CNT synthesized at this temperature range is more crystalline than what was obtained at the 550˚C - 750˚C (Tables 3 and 4). Raman spectra also support this observation.
4. Conclusion
Virgin polymers (LDPE, HDPE and LLDPE) on pyrolysis using CVD system can be converted into MWCNT or CNB depending on the temperature range used. Taguchi Optimization methodology helped in selecting the best suitable parameters for high yield of desired CNM. Hydrogen atmosphere and a duration of 2 h pyrolysis was found to be the best condition for both low (550˚C - 750˚C) temperature range that produced CNB; as well as high (850˚C - 1050˚C) temperature range, which produced more MWCNT. Various characterization data viz. SEM, TEM, Micro RAMAN & TGA; all supported the same findings that CNM synthesized were graphitic, crystalline material having MWCNT or CNB morphology. Temperature higher than 600˚C helped in getting rid of amorphous carbon from the CNM produced.
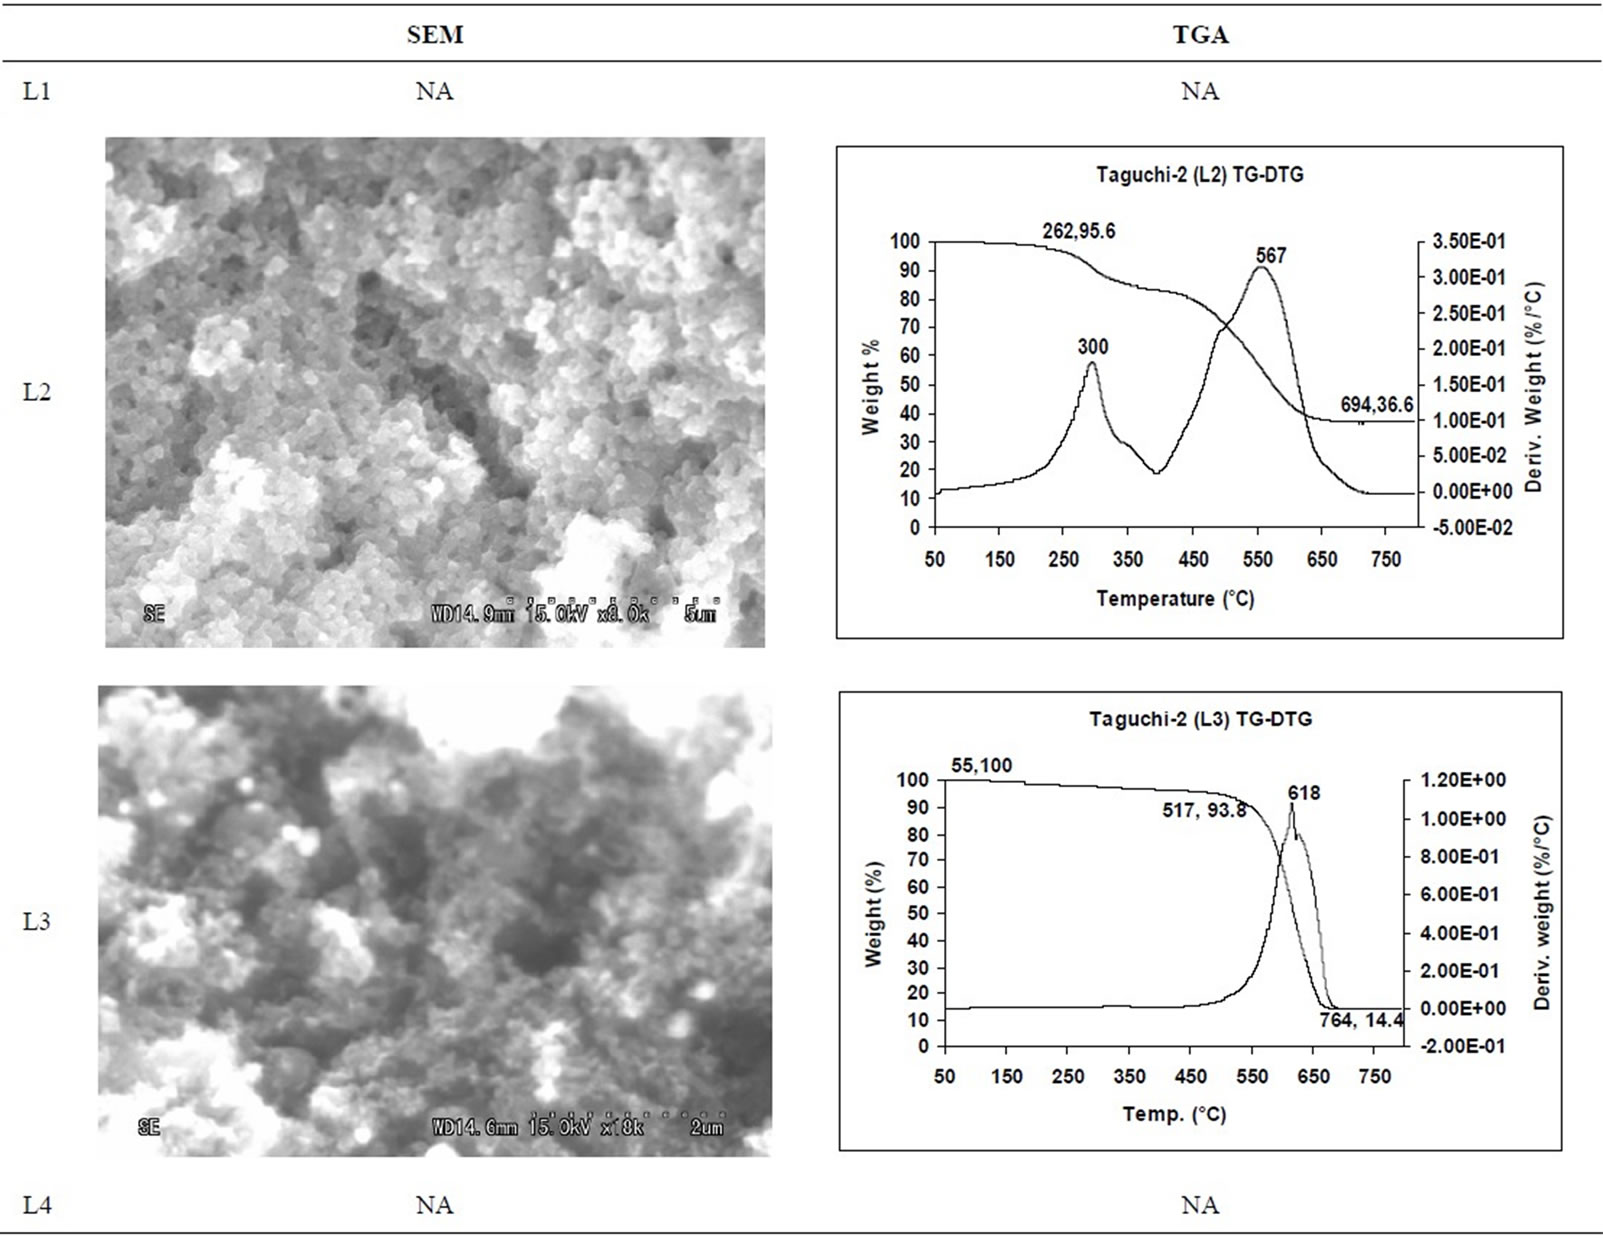
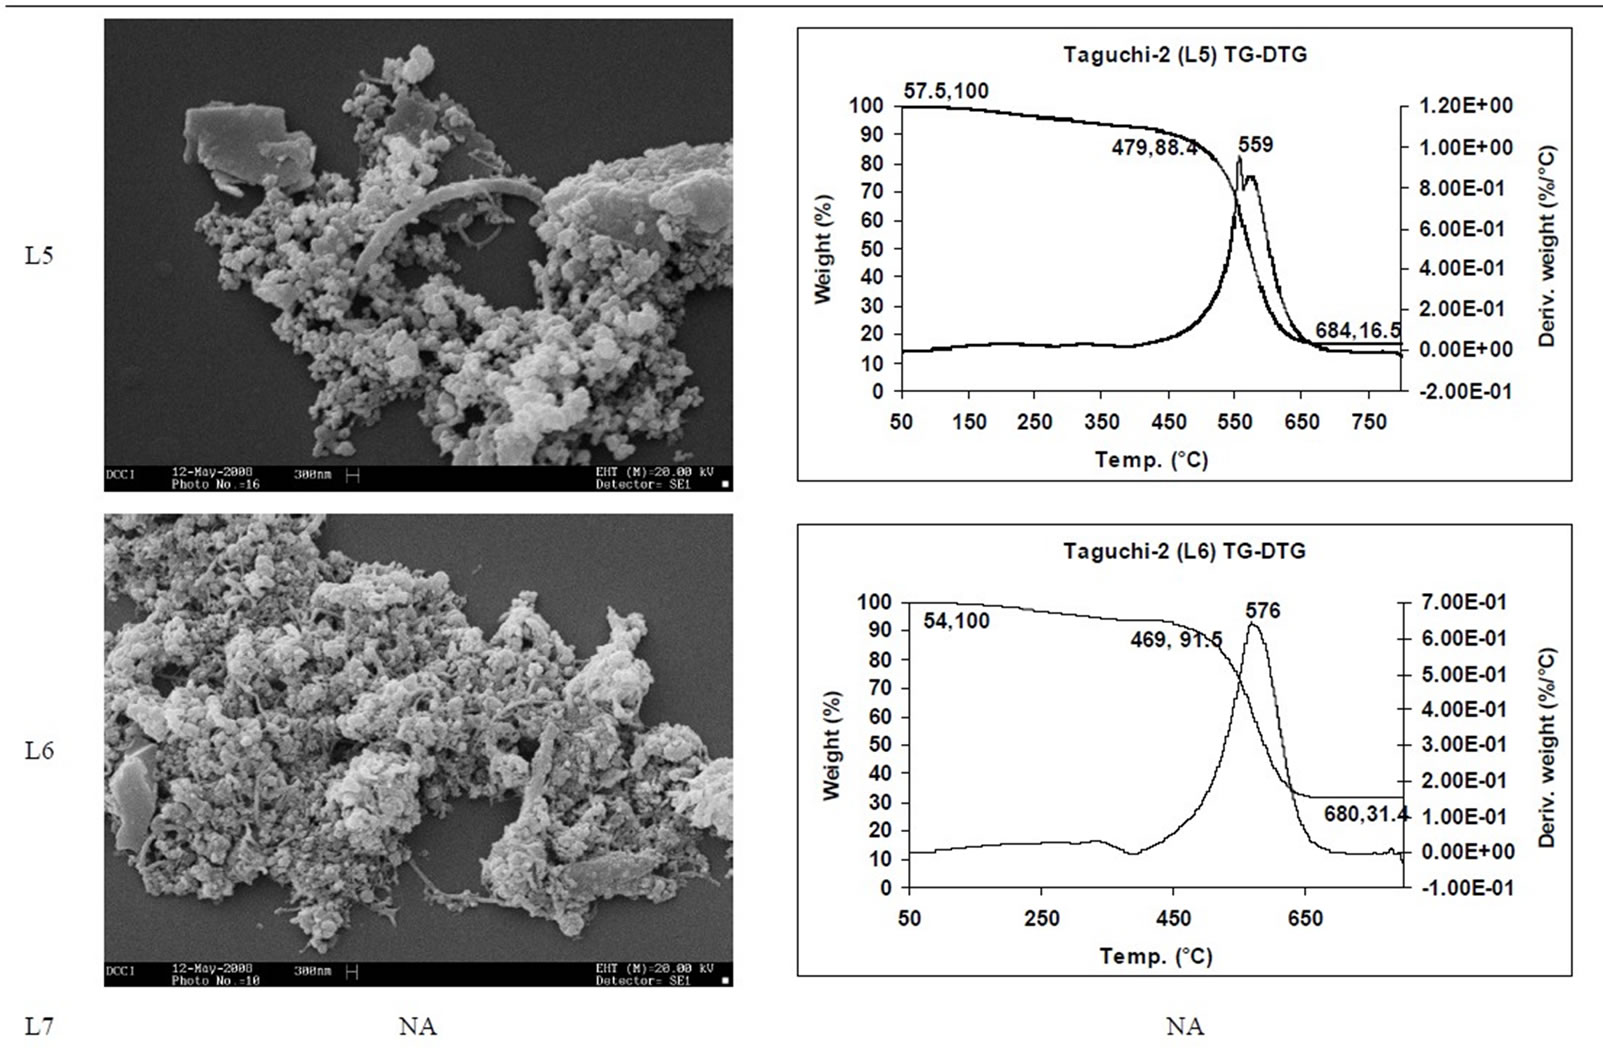
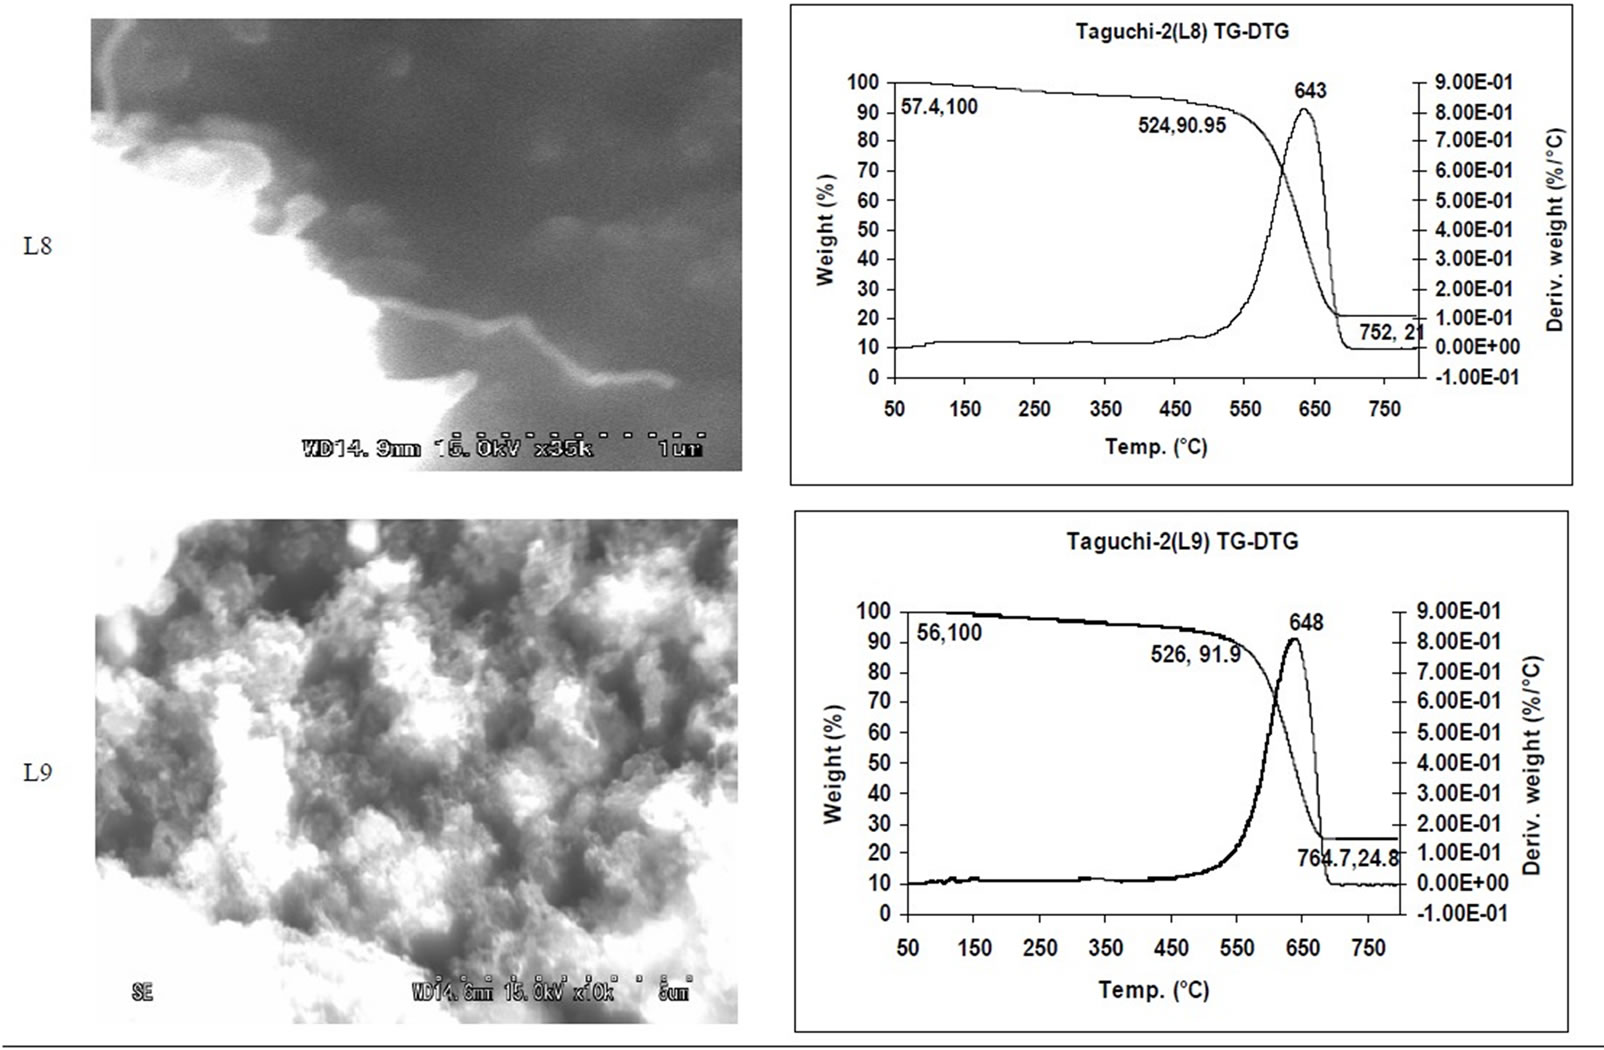
Table 3. CNM Taguchi method (550˚C - 750˚C) analysis by SEM and TGA.
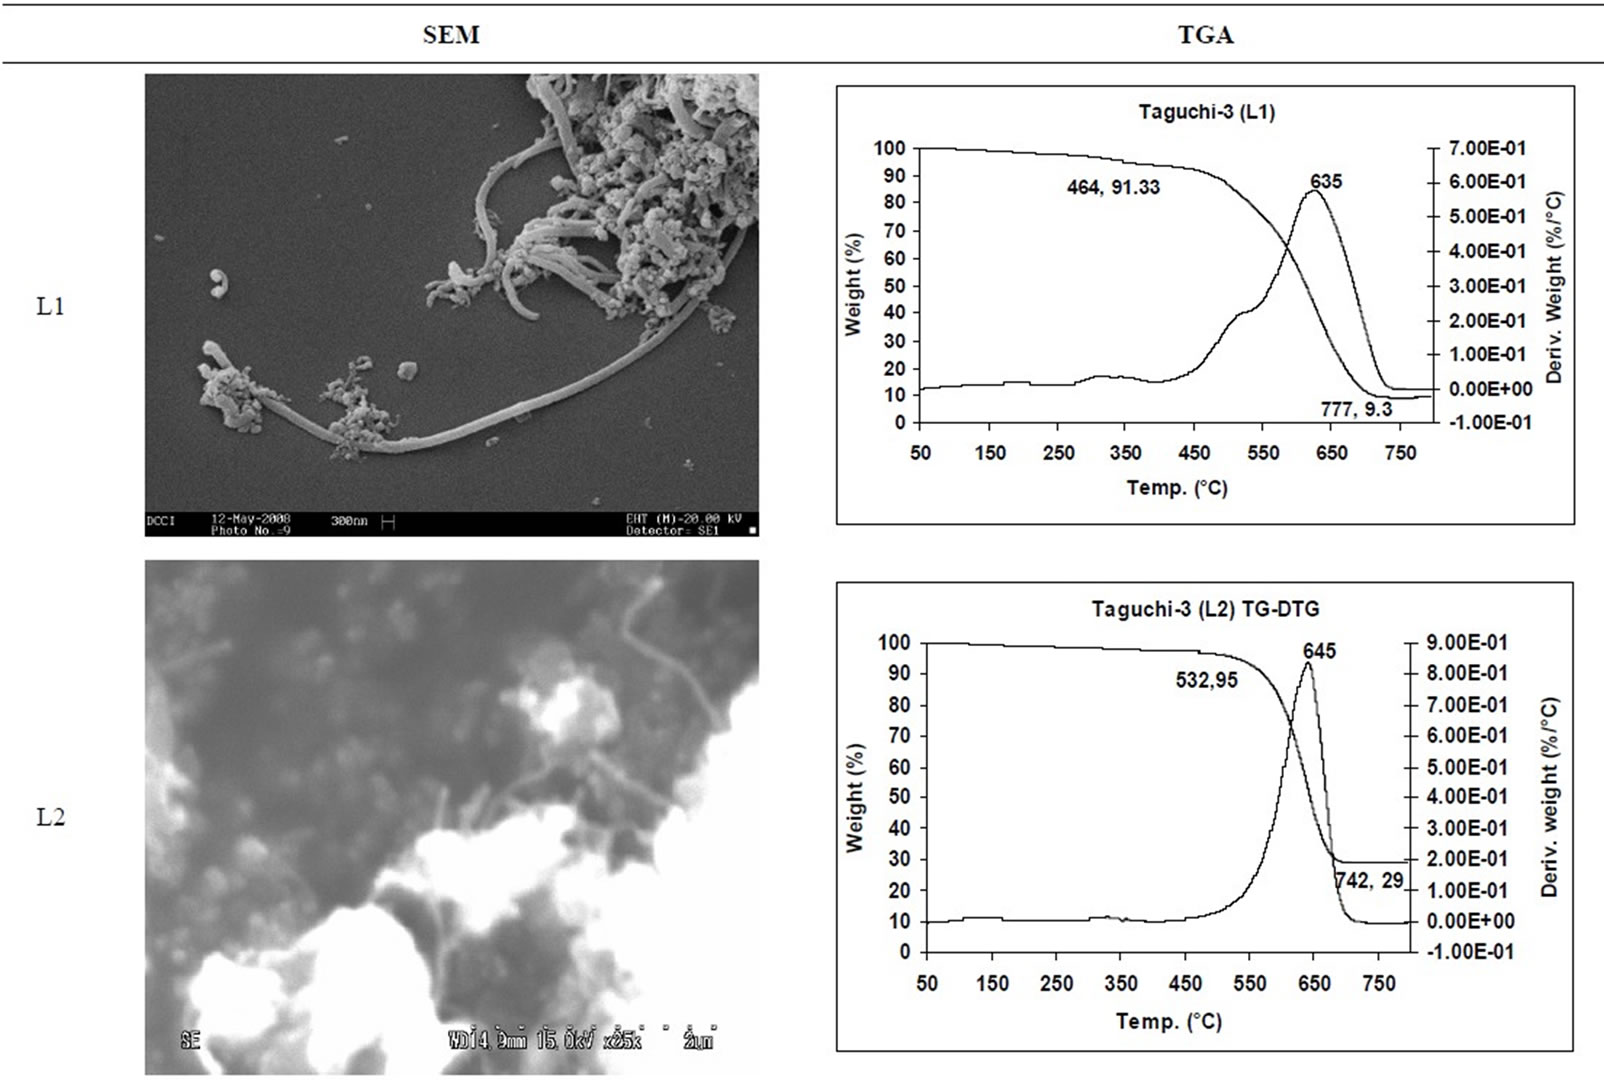
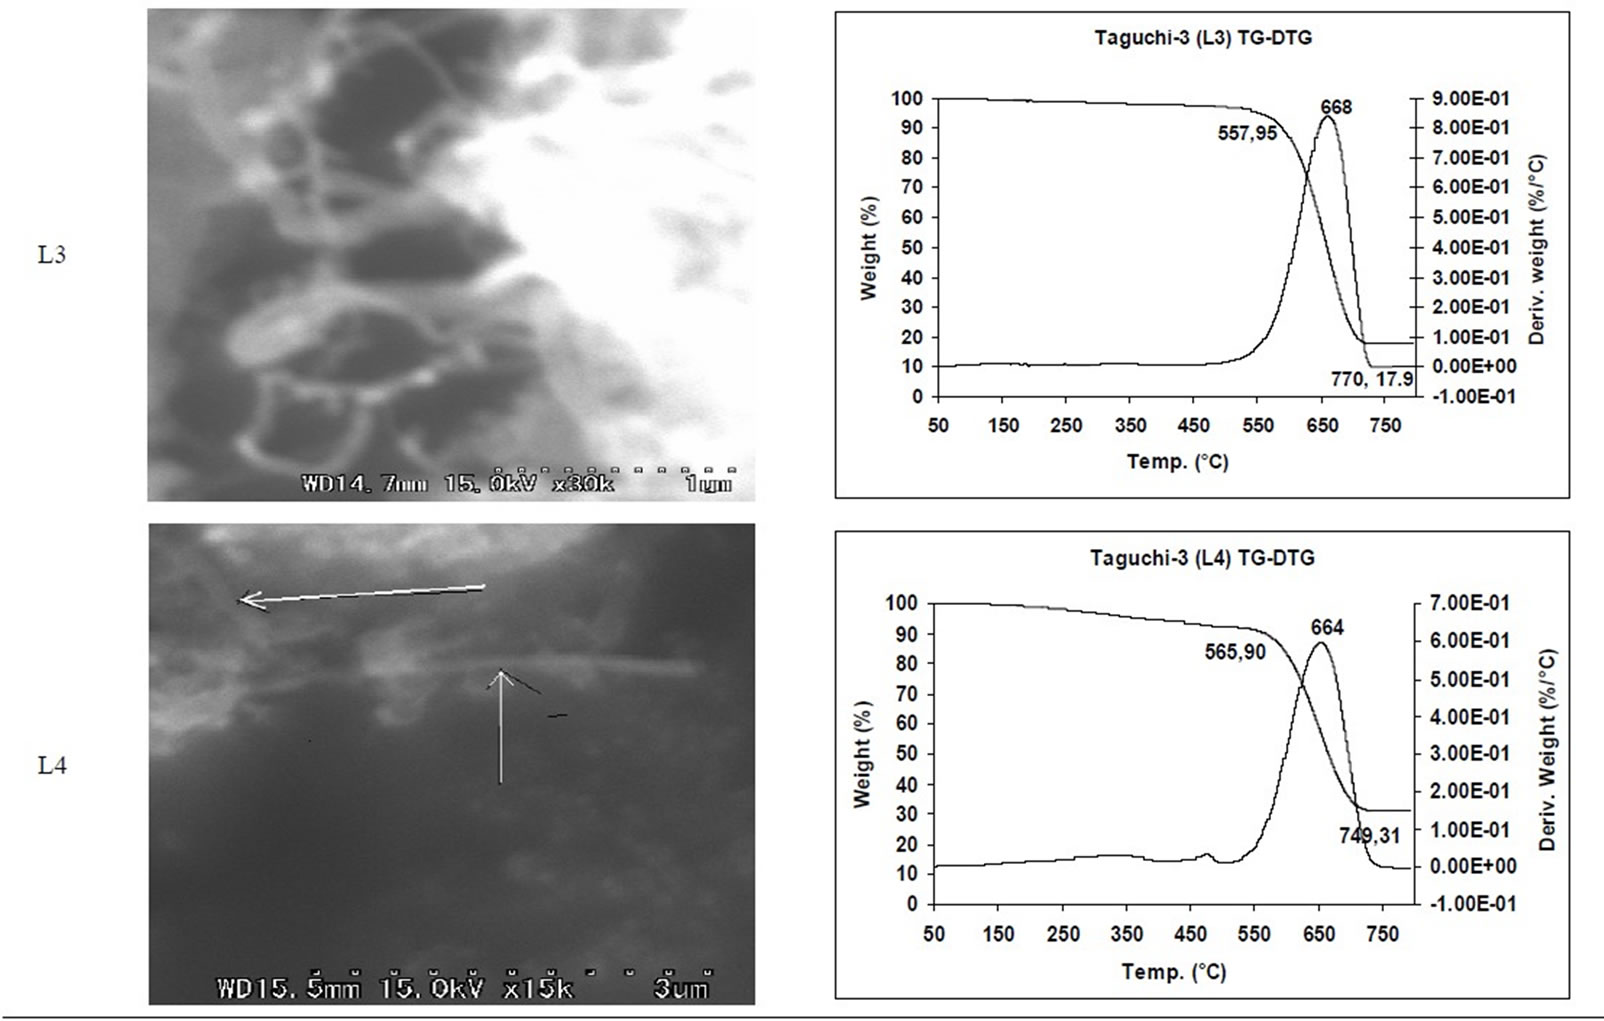
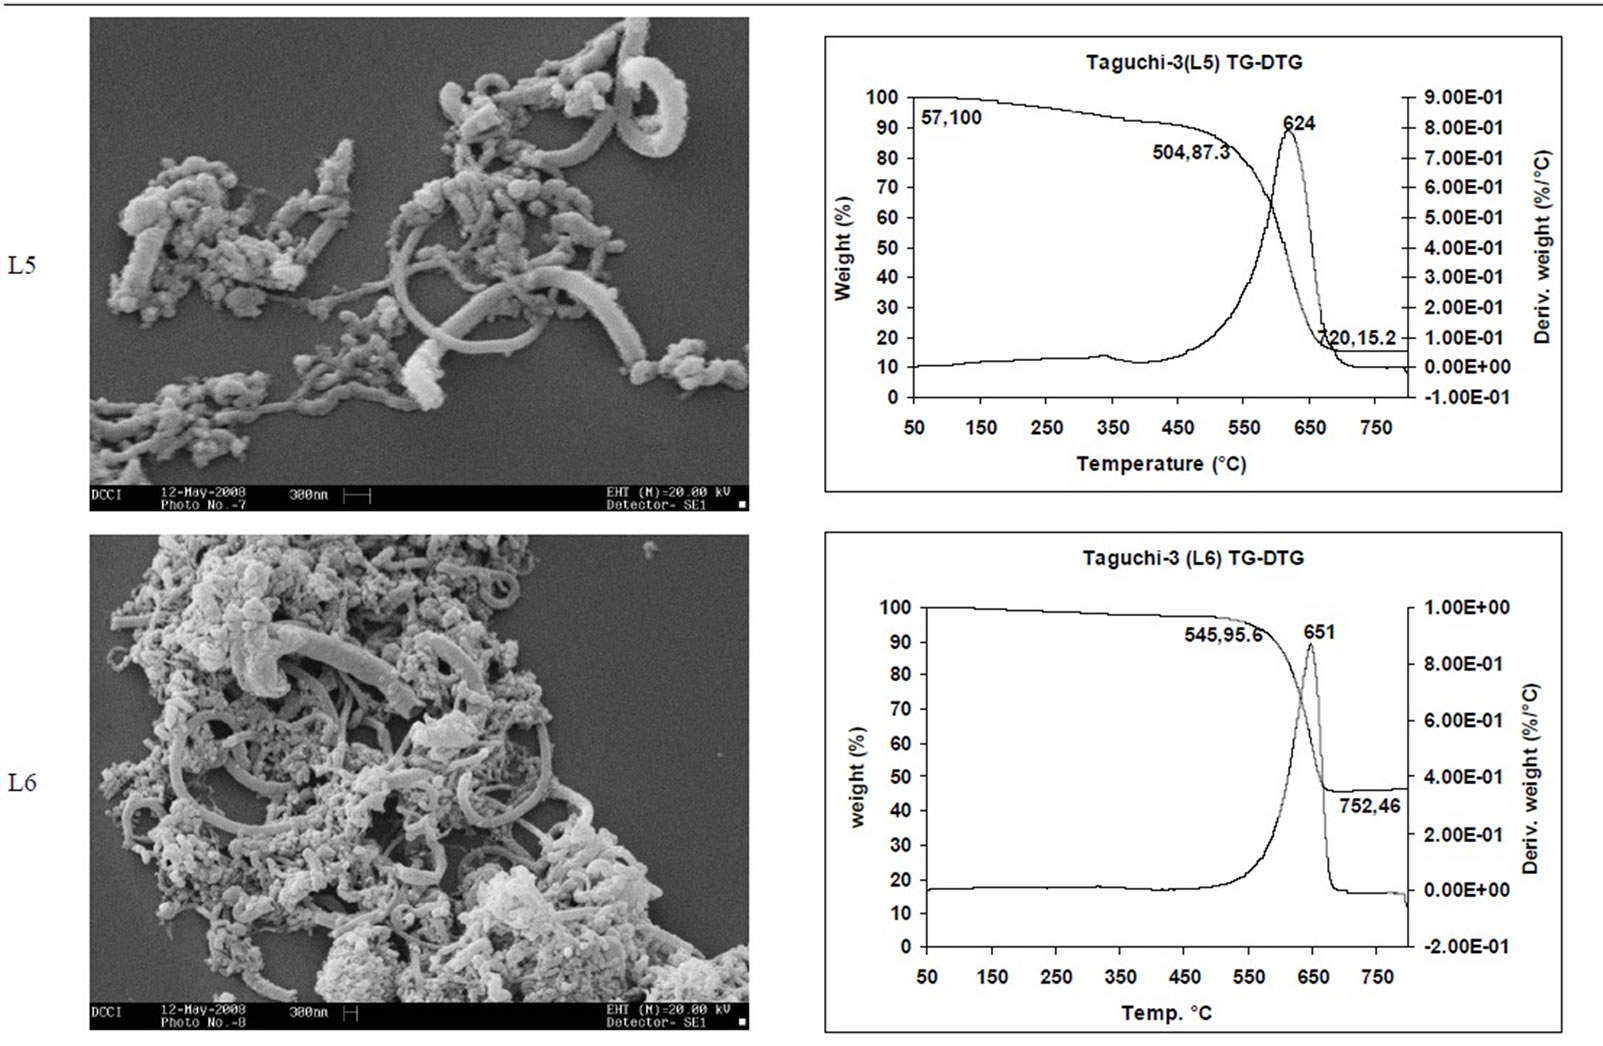
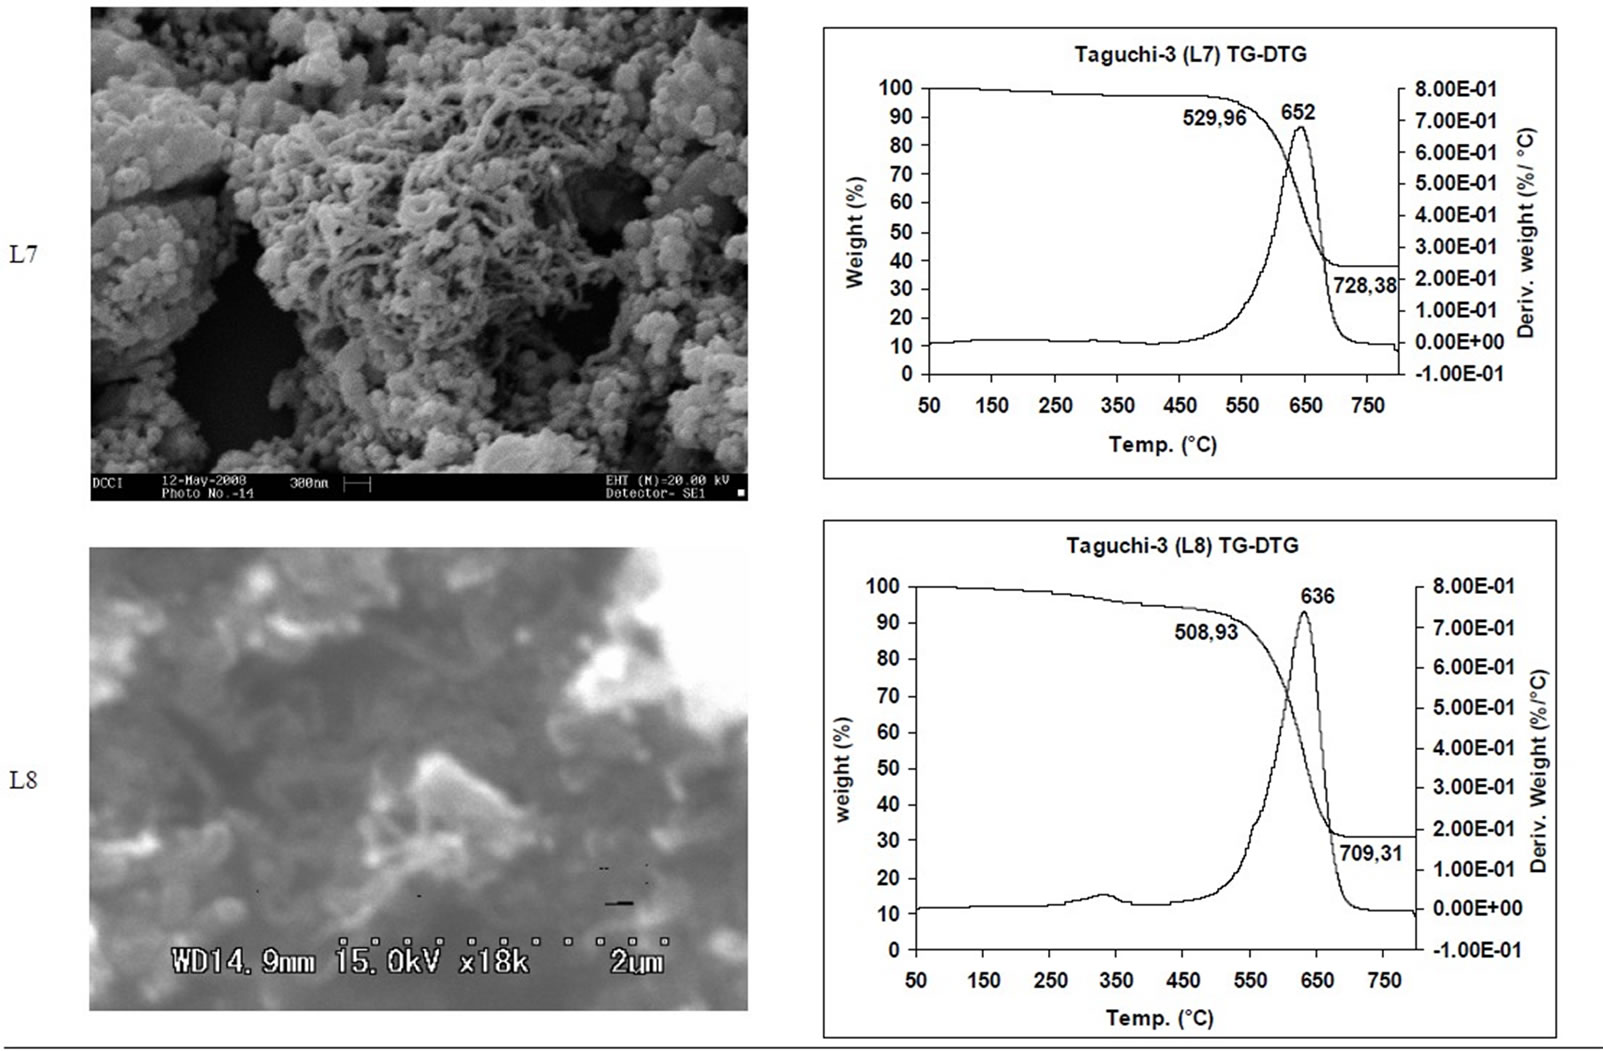
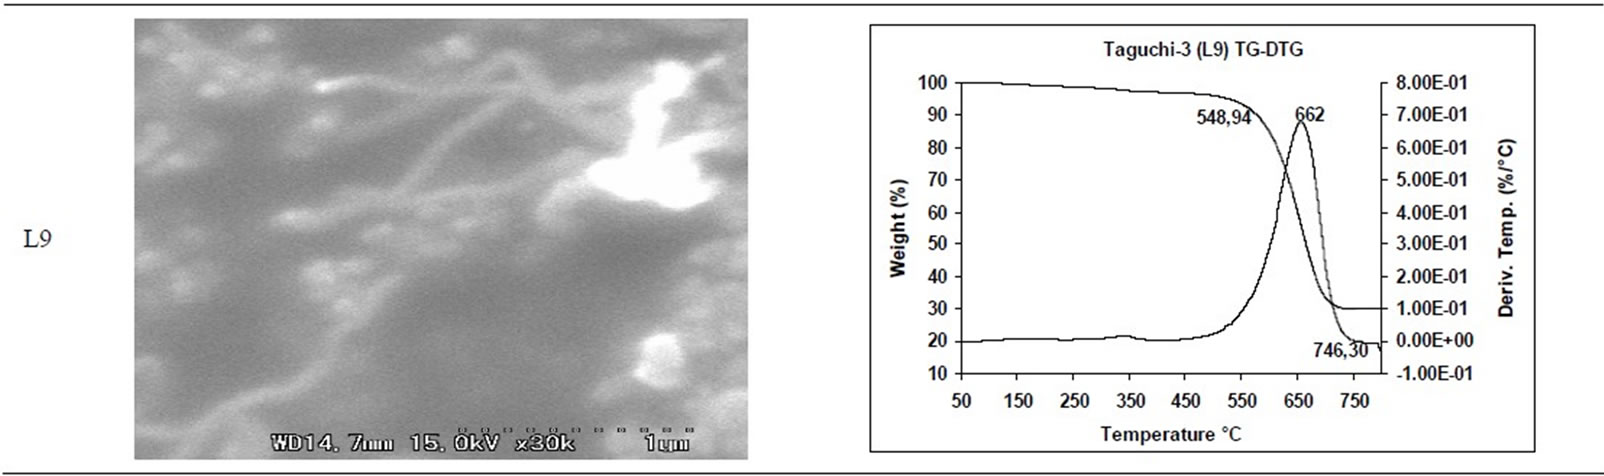
Table 4. CNM Taguchi method (850˚C - 1050˚C) analysis by SEM and TGA.
5. Acknowledgements
Authors acknowledge UGC, New Delhi for financial support to carryout this project.
REFERENCES
- S. Iijima, “Helical Microtubules of Graphitic Carbon,” Nature, Vol. 354, 1991, pp. 56-58. doi:10.1038/354056a0
- M. Sharon, K. Mukhopadhyay and K. M. Krishna, “Fullerenes from Camphor: A Natural Source,” Physical Review Letters, Vol. 72, No. 20, 1994, pp. 3182-3185. doi:10.1103/PhysRevLett.72.3182
- M. Sharon, D. Pradhan, M. Kumar and Y. Ando, “NanoOctopus: A New Form of Branching Carbon Nanofiber,” Journal of Nanoscience and nanotechnology, Vol, 3, No. 3, 2003, pp. 1-3.
- M. Sharon, “Cabon Nanomaterials,” Encyliopedia Nanoscience and Nanotechnology, Vol. 1, 2004, pp. 517-546.
- A. Afre. Rakesh, T. Soga, T. Jimbo, Mukul Kumar, Y. Ando and M. Sharon, “Growth of Vertically Aligned Carbon Nanotubes on Silicon and quartz Substrate by Spray Pyrolysis of a Natural Precursor; Turpentine Oil,” Chemical Physics Letters, Vol. 414, No. 1-3, 2005, pp. 6-10. doi:10.1016/j.cplett.2005.08.040
- M. Sharon, P. R. Apte, S. C. Purandara and R. Zacharia, “Application of the Taguchi Analytical Method for Optimization of Effective Parameters of the Chemical Vapour Deposition Controlling the Production of Nanotube/ Nanobeads,” Journal of Nanoscience and Nanotechnology, Vol. 5, No. 2, 2005, pp. 288-295. doi:10.1166/jnn.2005.035
- N. Bejoy, M. Sharon and D. K. Mishra, “Application of Taguchi Methodology for Optimization of Parameters of CVD Influencing Formation of a Desired Optical Band Gap of Carbon Film,” Carbon Science, Vol. 6, No. 2, 2005, pp. 96-100.
- S. Bhardwaj S, M. Sharon and T. Ishihara, “Taguchi Optimization of the Carbon Anode for Li-ion Battery from Natural Precursors,” Current Applied Physics, Vol. 8, No. 1, 2008, pp. 71-77.
- S. Maghsoodloo, G. Ozdemir, V. Jorden and C. H. Husang, “Strengths and Limitations of Taguchi’s Contributions to Quality, Manufacturing, and Process Engineering,” Journal of Manufacturing System, Vol. 23, No. 2, 2004, pp. 73-126.
- R. H. Lochner, “Designing for Quality: An Introduction to the Best of Taguchi and Western Methods of Statistical Method Design,” Chapman and Hall, London, 1990.
- H. Gitlow, A. Alan Oppenheim and R. Oppenheim, “Tools and Methods for the Improvement of Quality,” Von Hoffman Press Inc., Boston, 1989.
- S. R. Ravella, C. Ganesh, P. R. Shetty and P. J. Hobbs, “The Taguchi Methodology as a Statistical Tool for Biotechnological Applications: A Critical Appraisal,” Biotechnology Journal, Vol. 3, No. 4, 2008, pp. 510-523.
- E. Box, “Statistics for Experiments,” Wiley & Sons, New York, 1978.
NOTES
*Corresponding author.