Journal of Mathematical Finance
Vol. 2 No. 4 (2012) , Article ID: 24460 , 11 pages DOI:10.4236/jmf.2012.24030
Expected Stock Returns and Option-Implied Rate of Return
Department of Finance and Decision Sciences, Hong Kong Baptist University, Hong Kong, China
Email: symzeto@hkbu.edu.hk
Received June 22, 2012; revised July 24, 2012; accepted August 5, 2012
Keywords: implied rate of return; options
ABSTRACT
This paper examines the predictability of implied required rate of return (ROI) of individual stock in the cross-section of stock returns. The required rate of return of each stock is implied using its corresponding stock options and used in estimating the fundamental value of stock. The study finds that stocks with low price to fundamental value have higher future returns. The inferred ROI is compared with other required rate of return derived by CAPM and Fama-French three factor model in return prediction and trading. The findings indicate that the proposed model outperforms the other two models. The forward looking ROI provides a superior estimation of fundamental value than the other two back-looking models and is better able to predict future returns. The empirical results also evidence that the proposed model provides accurate trading signals compared with the other valuation models as well as value benchmarks like price to earnings and dividend yield ratios.
1. Introduction
It has been documented that the implied volatility of stock exhibits predictability of stock returns. Bali and Hovakimian [1] examines if the difference of realized and implied volatility of firms can forecast the crosssection of future stock return. They indicate a significant negative association between volatility spread and expected return. Bali and Hovakimian [1] also identify that the difference of call-put implied volatility can predict the future return. Extensive studies have been made in investigating relation of volatility and future return. Ang et al. [2] show that the idiosyncratic volatility relative to Fama and French [3] model of individual stock is negatively associated with its future return. But the study generally uses the historical stock price volatility to develop expectation of future return. Similarly, Bali and Cakici [4] employ 60 months of stock returns observations to develop one-month ahead future volatility. Bali and Hovakimian [1] further examine the relation between the expected future volatility proxied by implied volatility and cross section of expected return. In contrast to these studies, I contribute to the literature by examining the market expectation of the required rate of return of individual stock and investigate if the rate of return implied by stock options exhibits predictability of the cross section of expected return.
I derive the option implied rate of return, as in Câmara, et al. [5] using reported call and put option prices of component stocks in Dow Jones Industrial Average Index. Câmara, et al. [5] indicate that the option-implied rates are stable and appropriate for capital budgeting. Then, the intrinsic value of each stock is estimated under the framework of fundamental analysis. The ROI is used to discount the future payoff. Previous studies have documented that the option prices reflect the market’s expectations; the ROI implied by the options is thus forward looking and should provide accurate estimation of the fundamental value than those estimates using backward-looking required rate of return computed using historical data.
The three years analysts’ forecasts of the earnings and dividends per share obtained from I/B/E/S for estimating residual incomes are discounted back using the computed ROI to determine the fundamental value. Then, the price to fundamental value ratio (PFV) is computed for each stock. The securities prices diverge from their intrinsic values due to the existence of information asymmetry and market inefficiency. As the overreacted security prices would eventually gravitate back to its intrinsic value according to fundamental analysis, this timing varying PFV can act as a benchmark to determine the individual overpriced and underpriced securities. This paper provides empirical evidence that the PVF estimated using optionimplied rate of return exhibits superior predictive power of future stock return.
Price multiples such as the price-to-earnings ratio and market to book value are widely used by practitioners to form contrarian portfolios for exploiting abnormal returns, as researched by Dissanaike and Lim [6]. There are other researchers who have validated the predictability of these fundamental variables, which include the price to cash flow ratio and the price to dividend ratio by Keppler [7,8] as well as the price to earnings and price to book ratios by Asness, et al. [9]. This paper aims to present a new price to fundamental value that can better capture market expectation to exploit future returns.
Researchers have proposed different models for estimating the required rate of return for stock valuation and capital budgeting. The Capital Asset Pricing Model (CAPM) of Sharpe and the three-factor model of Fama and French [3] are popular methods for estimating the rate of return. Lee, Myers and Swaminathan [10] adopted the CAPM model in estimating the COE as the sum of a time-varying risk-free rate and the corresponding market risk premium. They claim that the conditional discount rate outperforms the unconditional one.
Pastor and Stambaugh [11] also provide a framework for estimating the required return implied by factor-based pricing models in a Bayesian approach. The methodology enables the rate of return to adjust according to the pricing model and the stock’s historical average return. Nekrasov and Shroff [12] derived a framework that incorporates the covariance of return on equity with market factors into the residual income-valuation model. This arrangement enables the required rate of return to capture economic fundamental-based risk adjustment in the valuation. The revised model has been shown to perform better in producing smaller price deviations compared with models based on CAPM and the Fama-French three-factor model. However, the major problem of modes using CAPM or the Fama-French three-factor model is that they rely on historical records and are backward looking.
This paper develops a new price to fundamental value to predict the cross section of future stock return. The intrinsic value of individual stock is estimated using a required rate of return implied by its corresponding stock options. The results indicate that new price to fundamental value ratio gives outstanding performance in return predictability. The forward-looking information incorporated into the ROI helps giving a more reasonable and accurate estimation of the fundamental value of the security.
The paper also provides evidence that a significant positive return by sorting portfolio using the proposed price to fundamental value ratio. A trading strategy is designed using the price to intrinsic value ratio as a variable to rank the stocks into five portfolios. A zero investment of buying the lowest sorted portfolio and selling the highest sorted portfolio is devised. The performance of the proposed PFV ratio is compared with other fundamental variables such as PE, PB and PD ratios.
The paper is organized as follows. Section 2 discusses the data and methodology. Section 3 presents the empirical findings and analyzes the results. Section 4 concludes the paper.
2. Data and Methodology
This paper collects data from three sources. First, the component stocks of the Dow Jones Industrial Average are used by the study. Financial statement data and stock return data are collected on a monthly basis from the dataset of Datastream. This paper examines monthly return from January 1998 to December 2008. Additionally, the factors of the three factor model of Fama/French [3] are obtained from Kenneth French’s data library web site. Second, the analysts’ forecasts of the earnings and dividends per share for the following five years were obtained from I/B/E/S for estimating residual incomes.
Third, to estimate the option-implied ROI, the paper collects the volatility surface of stock options on a monthly basis of the component stocks of DJIA from the OptionMetrics. For each month, the paper collects 7 to 13 call options with different strike prices for each component stock with a maturity of 1 year for the ROI estimation.
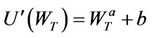
The paper estimates the option implied rate of return by following the methodology of Câmara et al. [5]. Assume that there is a representative agent with the marginal utility function of aggregate wealth WT expressed as:
 (1)
(1)
where WT > 0, a and b preference parameters with a < 0 and b > 0. The pricing kernel is then expressed as
 (2)
(2)
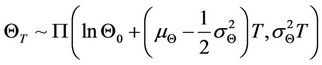
where QT is aggregate wealth and follows a lognormal distribution as
 and there is a representative agent with the marginal utility function expressed as
 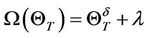 where δ and λ are the preference values. The representative agent is risk averse.
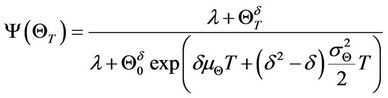
The pricing kernel is positive and has a displaced lognormal distribution with expectation . Stock price in a representative agent economy takes the form of
 (3)
(3)
where  under the actual probability measure Φ. P0 under the equivalent probability measure Λ is expressed as
 (4)
(4)
with the density function in the form of
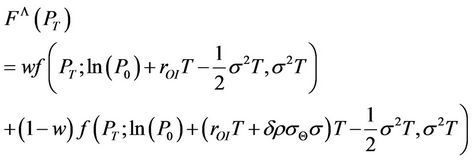 (5)
(5)
The density function varies with the preference parameters. By using the equilibrium relation of
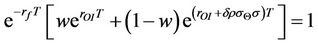 (6)
(6)
The call and put option prices can be expressed as follows:
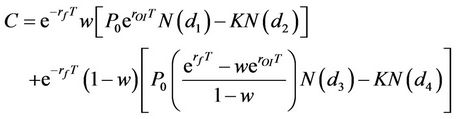 (7)
(7)
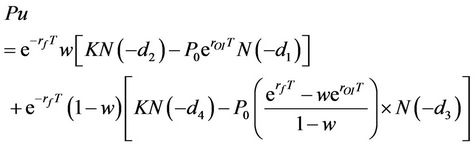 (8)
(8)
where
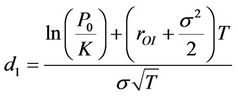 ,
,
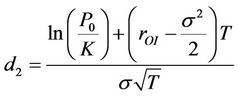 ,
,
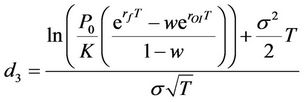 ,
,
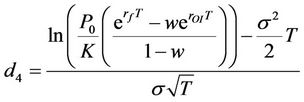
where C and Pu represent the call and put option prices, respectively. P0 is the stock price.  and w are the risk-free rate and the preference function. rOI and σ are the option implied required rate of return and the stock volatility, respectively. N(*) stands for the cumulative distribution function of the standard normal, K is the strike price, T is the maturity date of the options. By using the data of P0
 , K and T, the rate of return, σ and w are solved by minimizing the sum of the square of the differences between the market option prices and the model option prices.
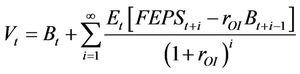
Then, the required rate of return in equation is applied in discounting the future payoff in the residual income valuation model. The fundamental value of the security is expressed as the sum of the current book value and the infinite sum of the present value of expected residual income:
 (9)
(9)
where Bt is the book value of equity at time t, FEPSt+i is the forecasted earnings per share for time t + i. The residual income model for the stock valuation is easy to implement and the required forecasted earnings from analysts are readily available in the market.
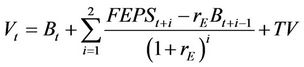
To facilitate the implementation, equation (9) is simplified into a finite series. The equation is reduced to the following form:
 (10)
(10)
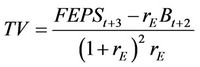
where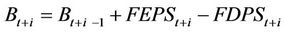 . The FDPSt+i represents the forecasted dividend per share for t + i. TV is calculated by assuming the residual income as a perpetuity after three years and is expressed as
 (11)
(11)
For each month, the parameters are estimated by minimizing the sum of squared differences between the model and market option prices of all of the component stocks at various strike prices with equal times to maturity in the following form:
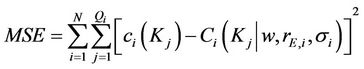 (12)
(12)
where N represents the total number of stocks in the study, and Qi stands for total number of strike prices available for stock i. ci and Ci are the market and model option price of stock i at a strike price of Kj. A total of 30 sets of fundamental values are then computed for each month. The procedure is repeated for the entire sample period.
3. Empirical Results and Analysis
3.1. Descriptive Statistics
Table 1 presents the summary statistics on the average returns of the 30 component stocks of the Dow Jones Industrial Average and the forecasting variables as well as the Pearson correlations of selected variables. The sample comprises firm-month observations from January 1999 to December 2008.
Panel A reports the mean excess returns, standard deviations of portfolio formed by the component stocks. The monthly excess returns are calculated as the average monthly return after deducting the risk free rate for the N-months-ahead return, where N stands for a duration of 1, 3, 6, 9, 12 or 18 months. The average monthly excess return in the sample period is 0.29% for a one month holding period. The median value is 0.35% with a maximum of 27.60% and a minimum of −26.37%. The
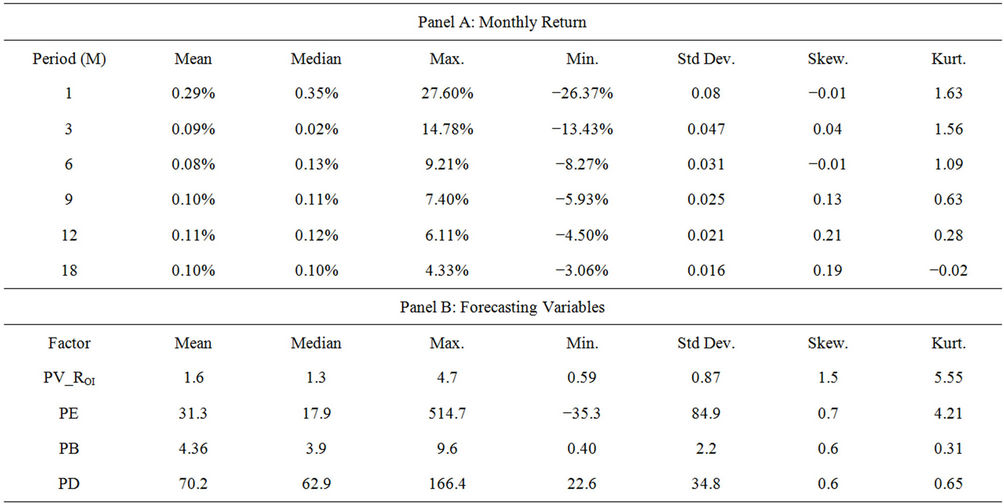
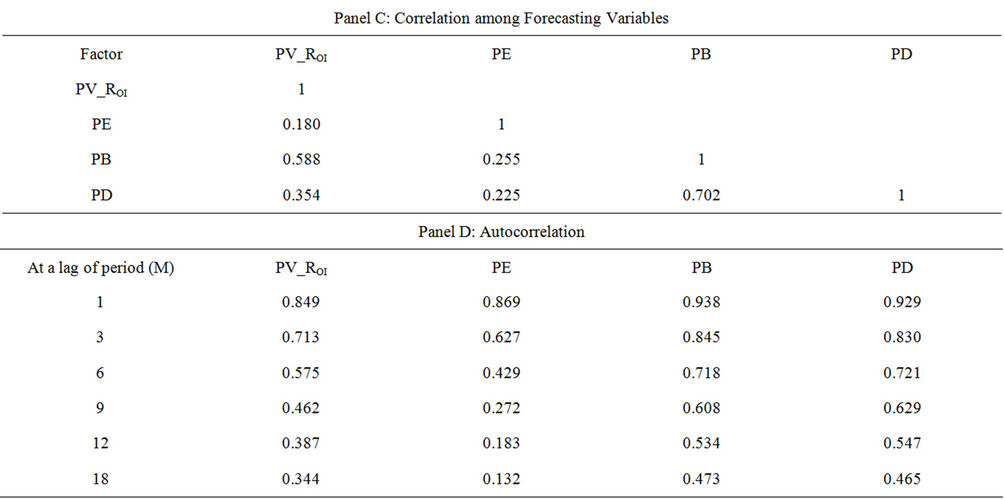
Table 1. Descriptive statistics and pearson correlation for monthly excess returns.
average excess return for one month investment horizon is higher than others, but it also has higher values of standard deviation and kurtosis as expected. Panel B of Table 1 presents the descriptive statistics of the options’ implied rate of return and other price multiples. They are the price to earnings ratio (PE), the price to book value ratio (PB) and the price to dividend ratio (PD). Panel C shows the correlations among these forecasting variables.
Panel D shows that the autocorrelations of the price multiples were relatively high. The level of autocorrelation at a lag of one month for the price multiples ranges from 0.869 (PE) to 0.938 (PB) but was only 0.849 for PV_ROI. These traditional price multiples have a longer mean reversion compared to the PV_ROI, whose intrinsic value is option implied. Except for the PE ratio, I find similar patterns for the autocorrelation values at longer lags. PV_ROI shows faster mean reversion and was more responsive.
3.2. Return Predictability
The predictability of various ratios for future returns is examined in this section. The regression considered is in the form of
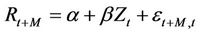 (13)
(13)
where Rt+M stands for the monthly return at time t for M months ahead. The regression is run for different durations: M = 1, 3, 6, 9, 12 and 18. To derive the conclusion of the overall predictability of the forecasting variable, the paper computes the average regression coefficients of the various M proposed by Richardson and Stock [13]. Zt is the assigned forecasting variable. The forecasting variables under study are the PV_ROI, PE, PB and PD ratios.
When the price is less than the fundamental value, the price will eventually revert and lead to positive future return. Therefore, the relationship between the P/V ratios and the future return is expected to be negative. Table 2 shows the results of the predictability of the P/V ratio by conducting univariate regression on different horizons. All the P/V ratios exhibit a negative association with the future returns. The average slope coefficients of PV_ROI are negative and significant at the 1% level. This result indicates the return predictability of PV_ROI.
3.3. Cross Section of Stock Return and P/V Ratios
In this section, the paper designs a trading strategy for capturing cross sectional excess returns based on the forecasting power of the P/V ratios. The component stocks are ranked based on the adjusted P/V ratios for each month. The paper proposes two adjusted P/V ratios. The first ratio is estimated by dividing the P/V ratio at time t by its average P/V ratio over the last 12 months.
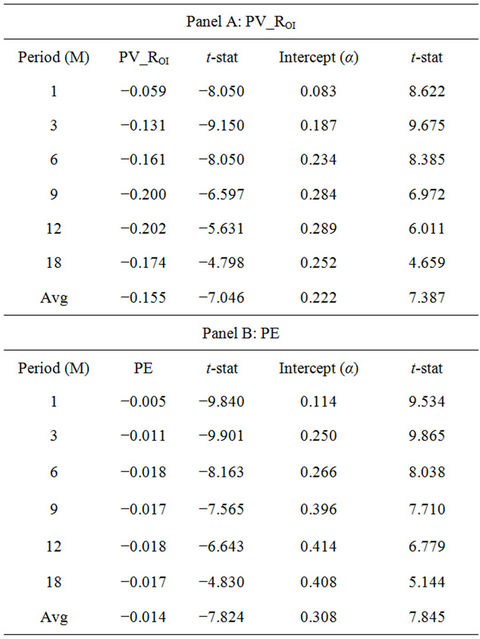
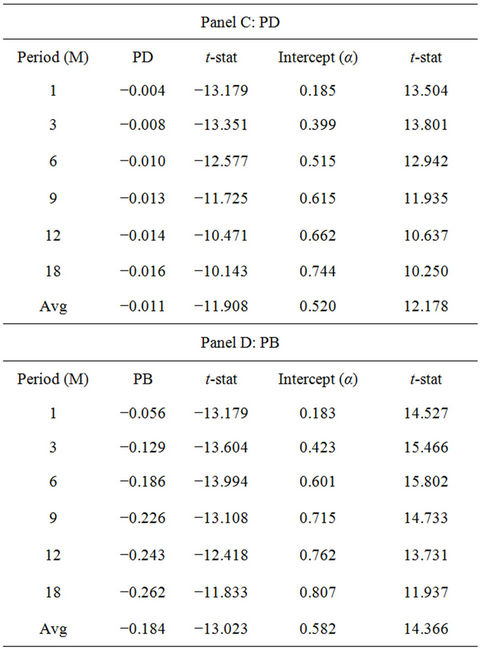
Table 2. Predictability regressions of forecasting variables.
The arrangement normalizes the 30 ratios and facilitates comparison. The second ratio is same as the first one, except I use 24 months for calculating the average value. To facilitate the comparison with the traditional price multiples, I apply the same methods to the PE, PB and PD ratios for ranking the portfolios.
At month t, the stocks are sorted into quintile portfolios by the adjusted ratios. Based on the findings of previous regression, I expect the lowest (highest) ranked portfolio to be underpriced (overpriced). That will lead to higher (lower) future returns. The paper tries to exploit the excess return by buying the portfolio in the lowest quintile and selling the one in the highest quintile. The portfolio will be held for a horizon from 1 month to 18 months.
Tables 3-6 summarize the performance of the trading strategy using various PV ratios. Table 3 presents the monthly profit for portfolios sorted by the 12 month average PV ratios. Panels A, B, C and D of Table 3 present the performance of the PV_ROI, PE, PB and PD ratios. The rows “RROI”, “RRPE” “RRPB” and “RRPD” stand for the arbitrage profits generated by taking a short position in Low 1 portfolio and a long position in High 5 portfolio ranked by PV_ROI, PE, PB and PD ratios. The results in panel A indicate that PV_ROI produces significantly positive arbitrage profits across the six horizons with an average return of 0.60%. In addition, when comparing the trading performance across the horizons, the trading performances using PV_ROI ratio over shorter horizons are generally better. Panel A of Table 3 indicates that arbitrage returns for the 1-month and 18-month investment horizons are from 0.92% and 0.38% respectively, for the 18-month horizon. The findings are significant at the 1% level, suggesting that the PV_ROI exhibits good forecasting power in short holding period return.
I apply the same trading rules on the price multiples, which are used as proxies for indicating the overpricing and underpricing of stocks. Panels B, C and D summarize the performance of the three price multiples. The PE, PB and PD ratios create arbitrage returns of 0.41%, 0.64% and 0.36%. However, when these returns are compared with the performance of PV_ROI, only the trading strategy using PB-sorted portfolios could compete. PV_ROI outperforms the PE and PD ratios in the trading by 0.19% and 0.24%, respectively. These findings are consistent with previous studies, such as that by Fama and French [14], which state that the significance of stock return predictive power of the price to earnings ratio disappears when the market price to book value ratio is considered. This study shows that the price to book ratio is superior to the price earnings ratio in terms of stock return predictability.
Table 4 illustrates the trading performances of the PV ratios when the portfolios are sorted with adjusted ratios that are calculated with an average value of a 24-month horizon. Panel A shows that the portfolio ranked by the PV_ROI adjusted ratio with longer average generates higher excess returns. The average monthly excess return of the six types of horizon is 0.66% for the ratio using the 24-month average compared with the corresponding return of 0.60% for the ratio using the 12-month average.
The results of the PE, PB and PD ratios are summarized in panels B, C and D of Table 4. The general pattern is similar to that in Table 3. PV_ROI still outperforms the PE and PD ratios in the trading strategy by 23% and 30% respectively. The gaps are slightly increased using longer term averaged ratios.
I repeat the methodology to examine the trading performances when sorting excess return which is calculated by subtracting monthly return by the risk free rate. Tables 5 and 6 summarize the trading results. The findings for the P/V ratios are similar to those in Tables 3 and 4. However, the arbitrage profits for the P/V ratio and price multiples are lower. Using the 12-month average, PV_ROI outperforms all the price multiples (with arbitrage returns exceeding the three price multiples by 17% (PE), 2% (PB) and 49% (PD)). In addition, the arbitrage return for one month horizon for PV_ROI sorted portfolios is higher than the other five horizons, suggesting stronger predictive power in shorter horizon. This finding using a 24- month average is similar to that using 12-month average except that the PV_ROI only outperforms PE and PD ratios.
By comparing the performance of the PV_ROI ratio with the traditional price multiples from the study of trading performances in Tables 3-6, one can see that the use of option implied cost of equity capital in the estimation of fundamental value improves the predictability of future returns and generates higher trading profits. The result indicates that, the incorporation of this option-implied COE into the equity valuation further improves the predictability of future returns, in particular the return in short investment horizon.
4. Conclusions
This paper contributes to the literature in two respects. First, a new approach is derived to estimate the fundamental value of stocks using option-implied required rate of return. Traditionally, the cost of equity capital used in the stock valuation is developed based on CAPM. However, this cost of equity capital derived by using historical data is backward looking. As indicated in the existing literature, market stock option prices reflect market expectations and help predict the future volatility of equity. This paper explores the possibility of enhancing the accuracy of valuation using this option implied rate in stock valuation. It is assumed that the superior estimation of
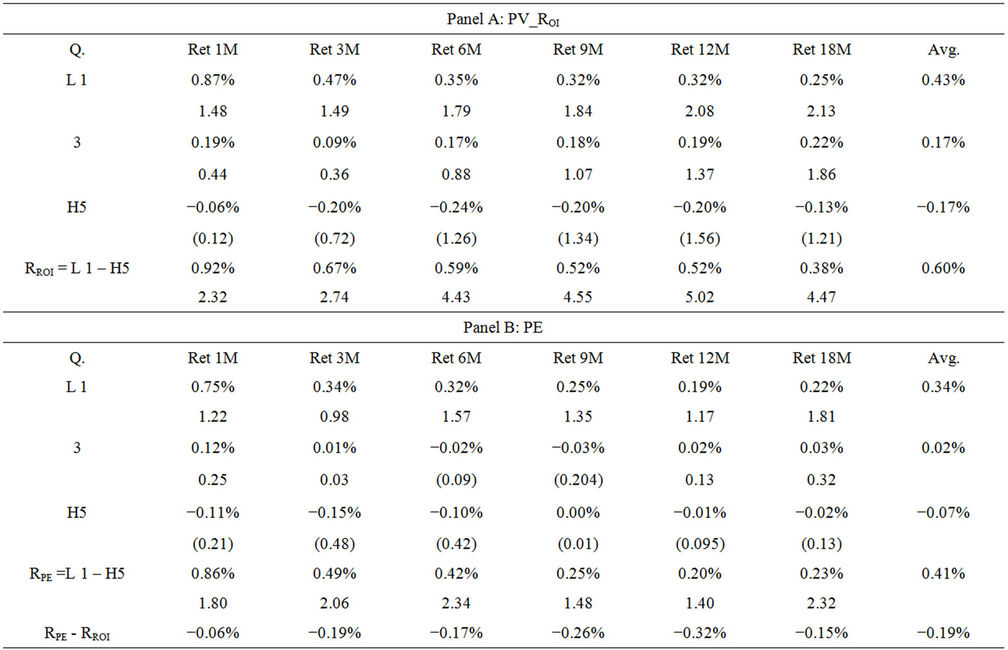
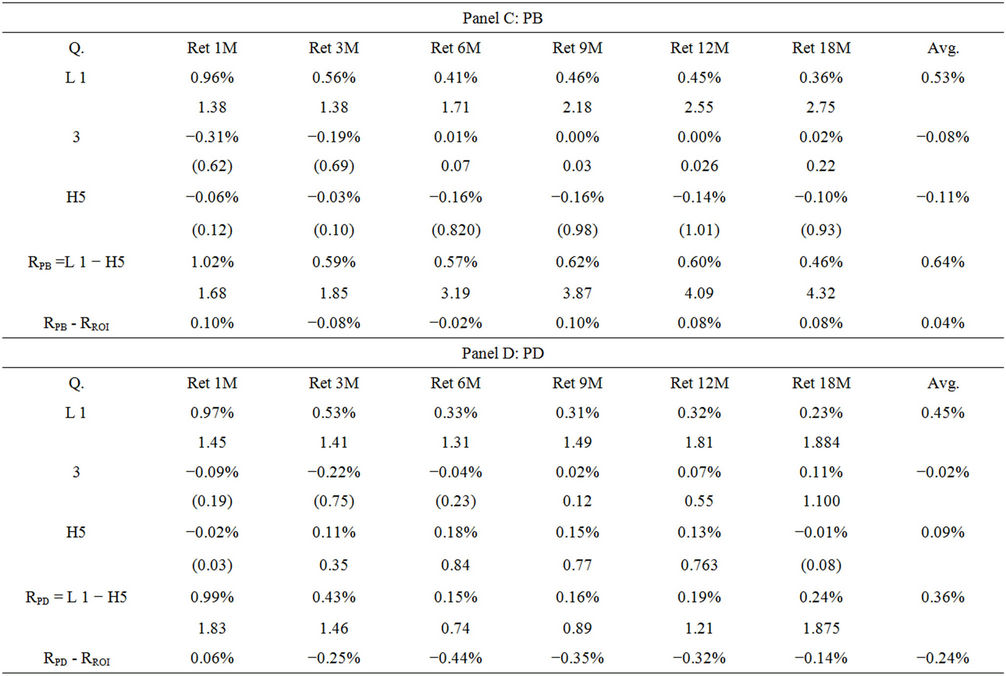
Table 3. Monthly return for portfolio based on PV ratio derived using 12 months average.
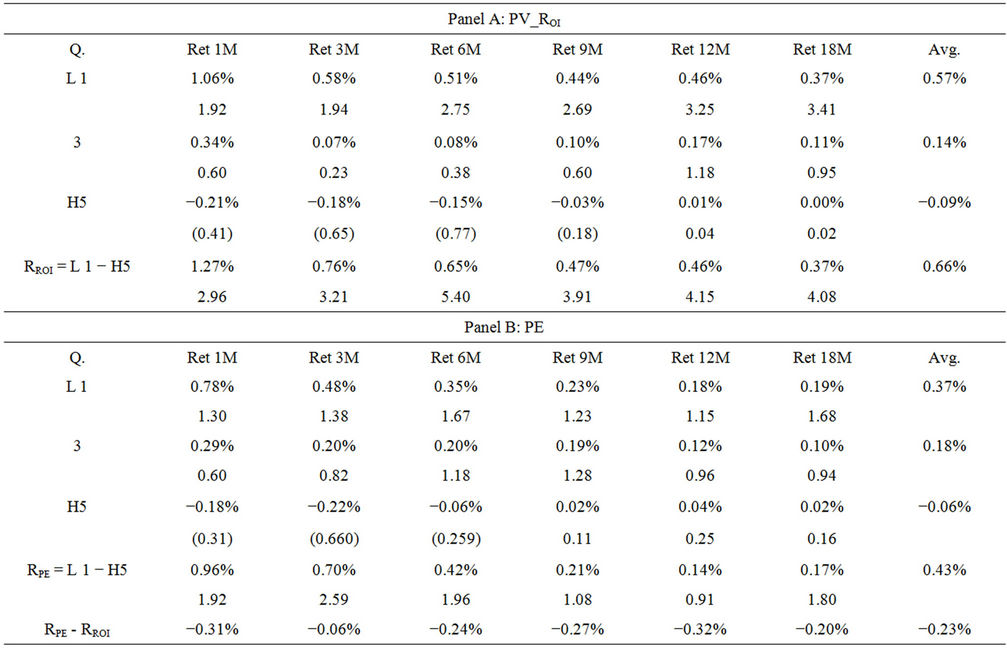
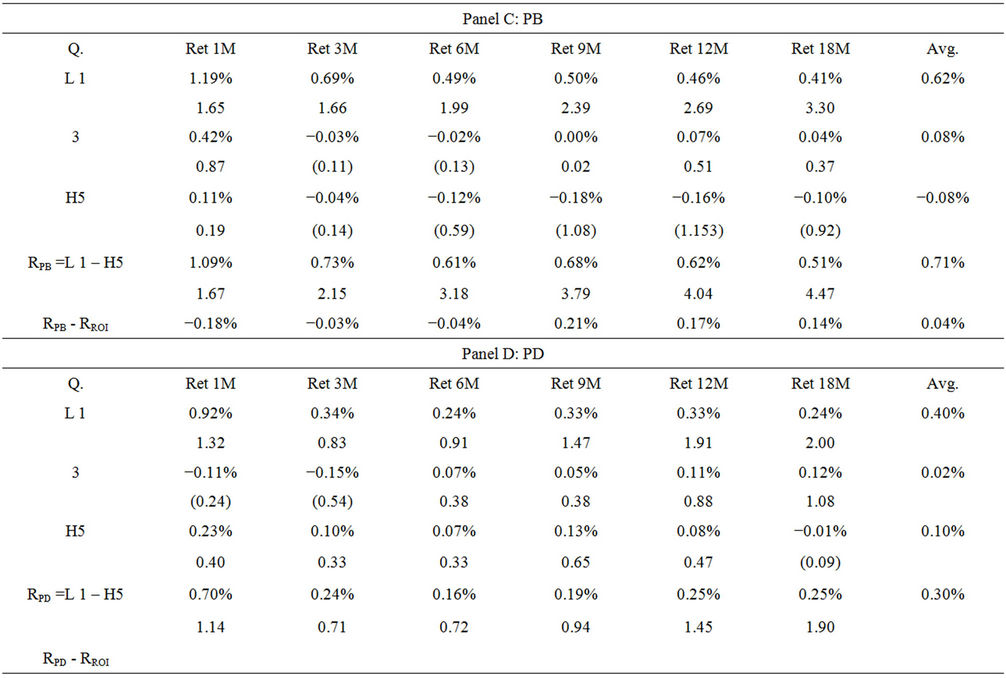
Table 4. Monthly return for portfolio based on PV ratio derived using 24 months Avg.
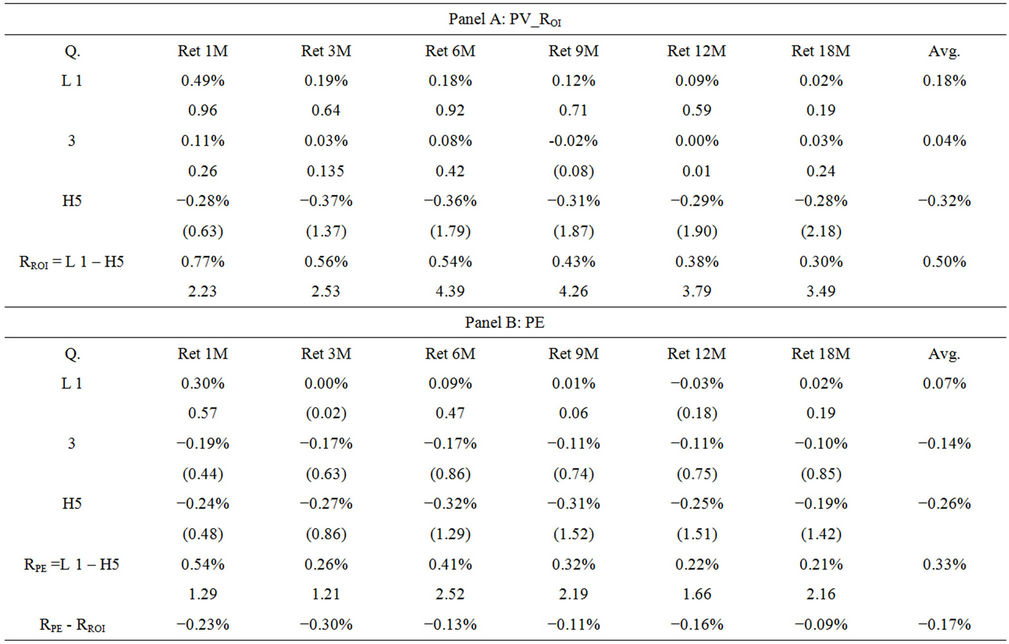
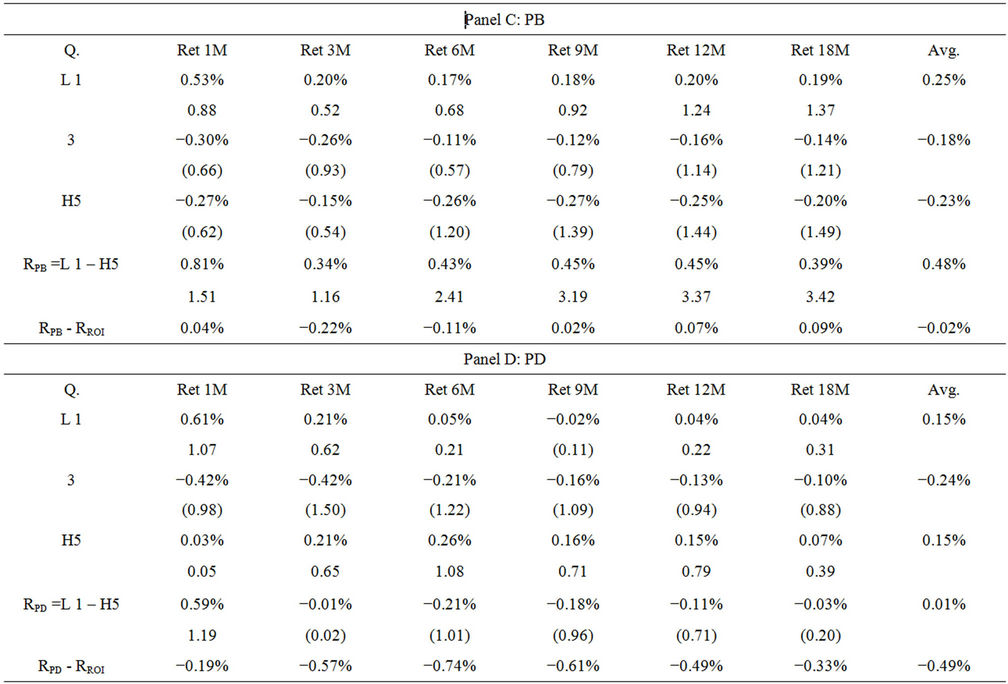
Table 5. Monthly excess return for portfolio based on PV ratio derived using 12 months Avg.
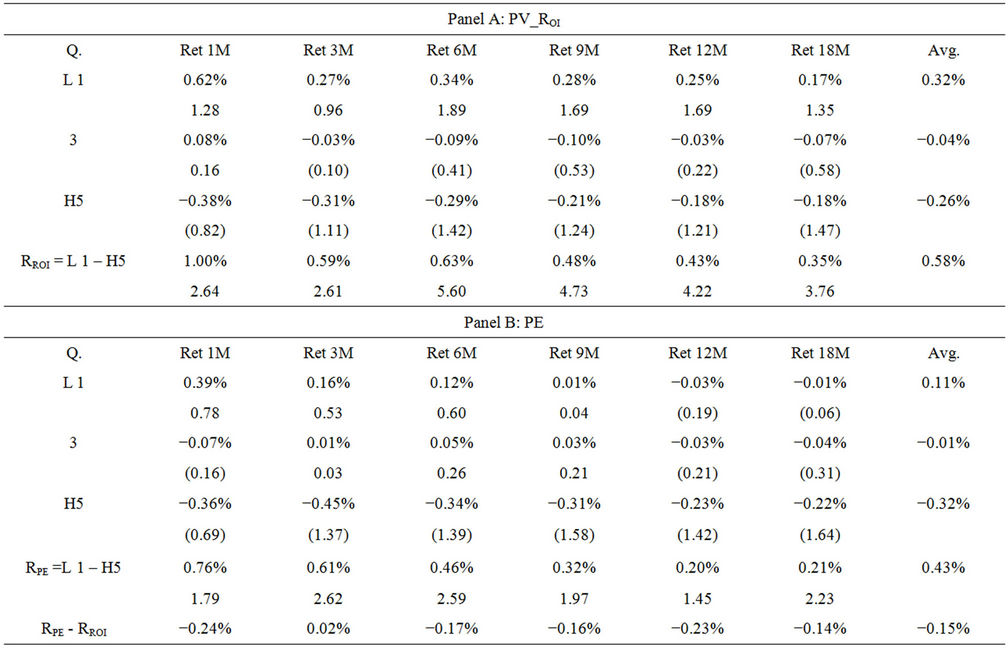
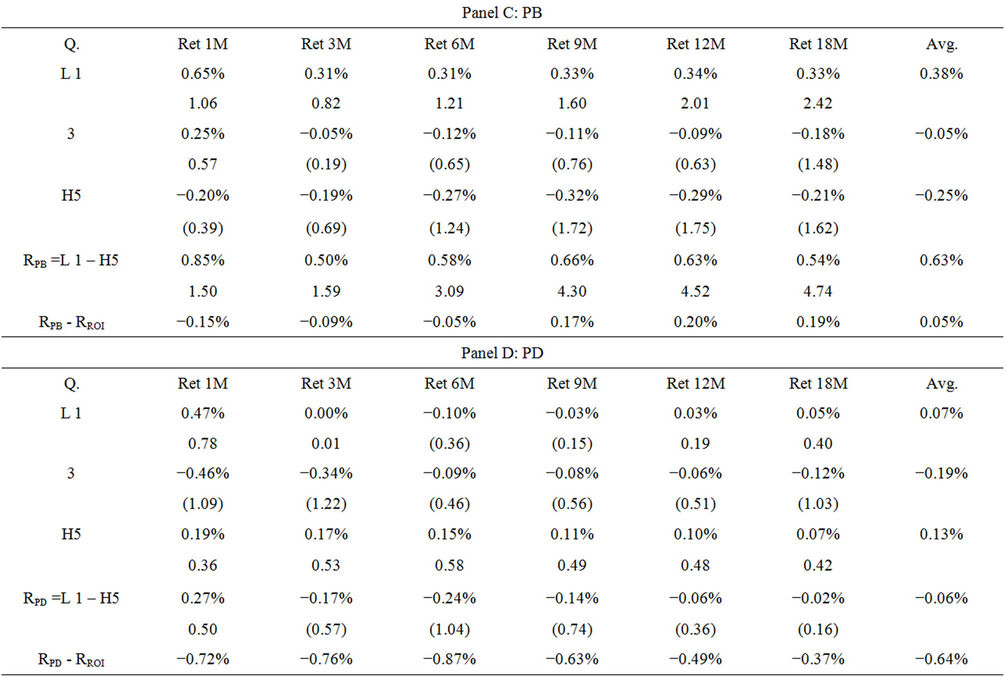
Table 6. Monthly excess return for portfolio based on PV ratio derived using 24 months Avg.
intrinsic value produces P/V ratios that can predict future returns.
Second, the paper develops a trading strategy to assess the profitability of the proposed valuation model. The paper creates two sets of sorting variables. The first one is derived by dividing the current P/V by the average P/V value of the last 12 months. The second one is calculated by dividing the P/V by an average P/V value of the last 24 months. These two adjusted P/V ratios can facilitate direct comparisons between stocks. For each month, the component stocks of the DJIA are ranked into quintiles by the P/V ratio and price multiples. A zero investment is created for each model by buying the lowest sorted portfolio and selling the highest sorted portfolio. The portfolios with the lowest P/V ratios should be underpriced and will generate higher future returns.
The evidence shows that my proposed P/V ratio derived using option-implied rate of return COE outperforms the P/E and P/B ratios in generating higher arbitrage profits in both sorting methods. The PV_ROI ratio consistently generates higher future returns for horizons from 1 month to 18 months. The options-implied rate of return is forward looking and helps produce better arbitrage return.
Because this paper only tests the proposed model on Dow Jones component stocks, which are generally large and popular stocks, future research may explore the predictability and profitability of the model by applying it to small-cap stocks.
REFERENCES
- T. G. Bali and A. Hovakimian, “Volatility Spreads and Expected Stock Returns,” Management Science, Vol. 50, No. 11, 2009, pp. 1797-1812. doi:10.1287/mnsc.1090.1063
- A. Ang, R. J. Hodrick, Y. H. Xing and X. Y. Zhang, “The Cross-Section of Volatility and Expected Returns,” The Journal of Finance, Vol. 61, No. 1, 2006, pp. 259-299. doi:10.1111/j.1540-6261.2006.00836.x
- E. F. Fama and K. R. French, “Common Risk Factors in the Returns on Stocks and Bonds,” Journal of Financial Economic, Vol. 33, No. 1, 1993, pp. 3-56. doi:10.1016/0304-405X(93)90023-5
- T. G. Bali and N. Cakici, “Idiosyncratic Volatility and Cross-Section of Expected Returns,” Journal of Financial and Quantitative Analysis, Vol. 43, No. 1, 2008, pp. 29- 58.
- A. Camara, S. L. Chung and Y. H. Wang, “Option Implied Cost of Equity and Its Properties,” Journal of Futures Markets, Vol. 29, No. 7, 2009, pp. 599-629. doi:10.1002/fut.20372
- G. Dissanaike and K. H. Lim, “The Sophisticated and the Simple: The Profitability of Contrarian Strategies,” European Financial Management, Vol. 16, No. 2, 2010, pp. 229-255. doi:10.1111/j.1468-036X.2008.00466.x
- M. A. Keppler, “Further Evidence on the Predictability of International Equity Returns,” Journal of Portfolio Management, Vol. 18, No. 1, 1991, pp. 48-53. doi:10.3905/jpm.1991.409385
- M. A. Keppler, “The Importance of Dividend Yields in Country Selection,” Journal of Portfolio Management, Vol. 17, No. 2, 1991, pp. 24-29. doi:10.3905/jpm.1991.409327
- C. S. Asness, J. M. Liew and L. S. Ross, “Parallels between the Cross-Sectional Predictability of Stock and Country Returns,” Journal of Portfolio Management, Vol. 23, No. 3, 1997, pp. 79-86. doi:10.3905/jpm.1997.409606
- M. C. Lee, J. Myers and B. Swaminathan, “What Is the Intrinsic Value of the Dow?” Journal of Finance, Vol. 54, No. 5, 1999, pp. 1693-1741. doi:10.1111/0022-1082.00164
- L. Pástor and R. F. Stambaugh, “Comparing Asset Pricing Models: An Investment Perspective,” Journal of Financial Economics, Vol. 56, No. 3, 2000, pp. 335-381.
- A. Nekrasov and P. K. Shroff, “Fundamentals-Based Risk Measurement in Valuation,” The Accounting Review, Vol. 84, No. 6, 2009, pp. 1983-2011. doi:10.2308/accr.2009.84.6.1983
- M. Richardson and J. H. Stock, “Drawing Inferences from Statistics Based on Multi-Year Asset Returns,” Journal of Financial Economics, Vol. 25, No. 2, 1989, pp. 323-348. doi:10.1016/0304-405X(89)90086-X
- E. F. Fama and K. R. French, “The Cross-Section of Expected Stock Returns,” Journal of Finance, Vol. 47, No. 2, 1992, pp. 427-465. doi:10.1111/j.1540-6261.1992.tb04398.x