Open Journal of Safety Science and Technology
Vol.07 No.02(2017), Article ID:76731,9 pages
10.4236/ojsst.2017.72007
Research on HFACS Based on Accident Causality Diagram
Bing Wu, Luyao Kou, Qi Ma
College of Resources and Safety Engineering, China University of Mining and Technology (Beijing), Beijing, China

Copyright © 2017 by authors and Scientific Research Publishing Inc.
This work is licensed under the Creative Commons Attribution International License (CC BY 4.0).
http://creativecommons.org/licenses/by/4.0/


Received: March 15, 2017; Accepted: June 3, 2017; Published: June 6, 2017
ABSTRACT
Accident analysis contributes much to improve the safety management of enterprises. The Human Factors Analysis and Classification System (HFACS) is an accident analysis method popularly used overseas. Based on HFACS analysis method, this paper presents a new accident analysis method combining HFACS with Accident Causality Diagram. On the basis of the clear description of basic events’ causal relationship in the accident, the new approach applies HFACS to evaluate the basic events leading to accident, which overcomes the deficiency of HFACS that the ultimate analysis result is not clear enough to understand due to the lack of the association between basic events and the events at other levels in the accident. The new method is used to analyze the collision accident of two vehicles in mining area. It can be concluded that HFACS based on Accident Causality Diagram is feasible and it helps to find out the main reasons that lead to accident and thus to take proper measures to prevent the occurrence of similar accidents.
Keywords:
Human Factors, Accident Causality Diagram, HFACS, Vehicle Collision, Accident Analysis

1. Introduction
Accident analysis is to learn lessons and formulate corresponding measures to prevent the occurrence of similar accidents. According to Shappell and Wiegmann, the challenge for accident investigators and analysts alike is how to best identify and mitigate the causal sequence of events, in particular, 70 - 80 percentage associated with human errors [1] . So it is of great practical significance to concentrate on more effective human error analysis methods to improve the quality of accident analysis.
There are two aspects of accidents. One is about natural science that accident is a natural phenomenon occurring at a certain time and in a certain place, the conditions and influences of which follow the scientific principle in nature. The other is about social science that accident is the description of a series of events referring to human factors, and usually the event at a heavy cost is defined as the accident. After the analysis for the aspect of social science, the conclusion drawn from natural science analysis can be used to determine accident time line and the importance degree of events on causing accident. Regardless of the purpose of accident investigation, investigation should be focused on a clear understanding of the sequence of events [2] . Accident analysis is divided into two parts: accident process should be clear at first, and then a proper method to analyze and evaluate the accident is adopted, which contributes to find the causes of the accident in human, organization, and other aspects. Whether to adopt graph for describing accident or not is usually the first element to consider, because graph enables the clear description of accident by which the investigators can identify errors and avoid omissions. At the same time, graph facilitates the communication among investigators. Accident Causality Diagram (hereafter, ACD) based on Accident Tree Analysis [3] takes advantage of describing accident by graphs. Based on the accident causality diagram, a variety of accident analysis methods can be used. This paper adopts HFACS that is widely acknowledged in the world. HFACS still has some problems in that it does not specify for unsafe acts it points to, especially when analyzing complicated accidents. Thus, using HFACS merely cannot elaborate the relationship of each event leading to accident. However, a combination of HFACS with ACD eliminates the shortcomings.
Thus, this paper combines Accident Causality Diagram with HFACS and puts forward a new accident analysis method to carry out accident analysis effectively.
2. The Human Factors Analysis and Classification System (HFACS)
The theoretical framework of HFACS is shown in Figure 1 [4] .
Based on “Swiss Cheese” model proposed by James Reason in 1990, American scholars Shappell and Wiegmann came up with HFACS in 2000. Most of the accidents are caused by unsafe behaviors of field personnel. HFACS divides the causes into four levels: unsafe acts, preconditions for unsafe acts, unsafe supervision, and organizational influences. HFACS was first developed for the aviation accident investigation. In the last decade, HFACS was not only successfully applied in the aviation [5] [6] , but also in the mining industry [7] [8] [9] , construction industry [10] and marine accident [11] [12] . Recently, Soner and Asan used HFACS combined with Fuzzy Cognitive Mapping and proposed a HFACS-FCM model to predict and eliminate the root causes behind the frequently repeated deficiencies on board ships [13] .
3. Draw of Accident Causality Diagram
According to the deficiency of the present accident analysis (like HFACS and so
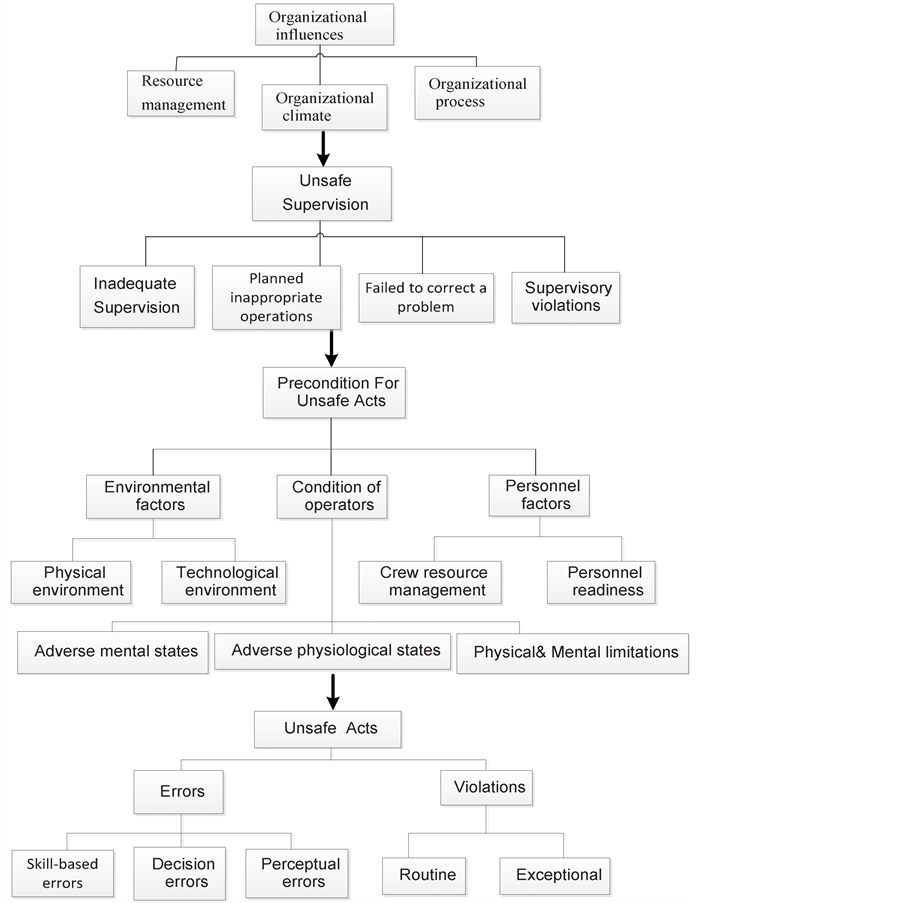
Figure 1. The taxonomies of HFACS.
on), the paper puts forward Accident Causality Diagram. This method, based on Accident Tree Analysis and investigation report, divides the events leading to an accident into top event (an overview of the accident itself), intermediate events, and basic events. And the method uses diagrams to express the causal relationship among events.
The drawing consists of two steps: the first step starts from a rectangular frame, that is, the accident itself is briefly described firstly, and the measures taken before and after the accident as well as the impact of the accident are expounded. For a more complex accident, if the content of the events, the emergency rescue measures or the impact is too much, you can then draw a rectangular box with two-point form of straight-line (Attribute line) to elaborate the subsequent events. The second step leads to the follow-up text box through the intermediate arrow form of straight-line (Causality Arrow). The text box contains events, direct and indirect causes of the accident. Because the accident is generally caused by the coupling of multiple events or causes, the text box is likely more than one. While drawing ACD, we focused on the elaboration of accident and events causing the accident, and we use the diagrams and lines to describe the accident as well as the causes and events before and after the accident, which can make the process and the causality clearer. The contents included in the drawing are shown in Table 1 [14] .
4. Case Study
In this paper, according to the accident investigation report [15] of United States Department of Labor’s Mine Safety and Health Administration, HFACS method based on ACD is used to analyze the accident in Kayenta Mine Peabody Western Coal Company Black Mesa, Navajo County, Arizona, America. The accident scene is shown in Figure 2.
4.1. Understand the Accident Process through Accident Investigation Report
On February 11, 2011, at approximately 2:00 p.m., Black (victim, fuel truck driver), a 55-year-old serviceman with 30 years mining experience, died from a fire resulting from the collision of two vehicles at the J21 Pit, Ramp 38 area of the Kayenta Mine.

Table 1. The contents and meaning of accident causality diagram.
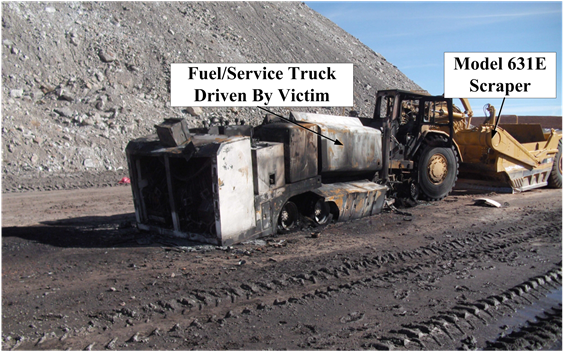
Figure 2. Accident scene.
Several scrapers were operating on the same haul road in a topsoil removal operation. The scrapers ran on the two-way, right-hand road. The accident occurred as Black was driving a combination fuel/service truck on a two-way haul road between ramps 40 and 38 after servicing equipment around the mine site. A scraper was being driven, traveling in the opposite direction on the haul road. Due to a high berm blocking his view of possible intersecting traffic on the right side, scraper operator drove on the left side of the road when entering the haul road. At the same time, the scraper’s bowl control lever was not working properly and contributed to the operator not having full control of the vehicle. Then the scraper operator turned back to look at the bowl to see if it had lowered. When he turned back around, he saw that the fuel truck driver’ head was down and it was too close to avoid the collision. Then the scraper and the fuel truck collided and the service truck caught fire. After the collision, the scrape operator got off the car right away and extinguished the fire with his colleagues. But the fire was not controlled and the fuel truck driver didn’t escape timely. As a result, the fuel truck was burned and the driver died.
4.2. Drawing Accident Causality Diagram as Shown in Figure 3
According to the description of the investigation report, this accident can be defined as “the collision of the scraper and fuel truck led to a fire, and then the fuel truck driver died”. There are two direct causes: A1 “the collision of the scraper and fuel truck led to a fire” (it can be further cut into two events: B1 “the scraper and the fuel truck collided” and B2 “the fuel truck was on fire”); A2 “the fuel truck driver died” (it is caused by three events: B3 “fuel truck driver did not make an escape response in time”, B4 “colleagues chose to put out the fire firstly instead of saving the driver” and B5 “the extinguishing failed”).
The two text boxes drawn are developed around A1“the collision of the scraper and fuel truck led to a fire” and A2 “the fuel truck driver died” respectively. Taking B1 “the collision of the scraper and the fuel truck” as an example, the causes of this event are as follows: C1 “the situation of the crossroad” (D1 “a high berm blocking scraper operator’s view”, D2 “he drove on the left side of the haul road”, and D3 “drivers are not informed of the front situation resulting from inadequate broadcast system”). C2 “the fuel truck driver did not take evasive action while scraper operator had no time to turn” (D4 “the scraper’s bowl control lever was not working properly, so the operator did not look straight ahead”, D5 “the fuel truck driver’ head was down”, D6 “No whistle”). B2 “Leading to a fire” has two causes as well: C3 “impact or electrical appliances shortcut produced fire source”, C4 “the impact strength led to the gas leak”. C3 and C4 events have always been enough small independent events, thus it can be regarded as basic events.
From the analysis above, the top event of the collision of the two vehicles is “the collision of the scraper and fuel truck led to a fire, and then the fuel truck driver died”. The intermediate events are A1 “the collision of the scraper and fuel truck led to a fire and A2 “the fuel truck driver died”. There are 11 basic
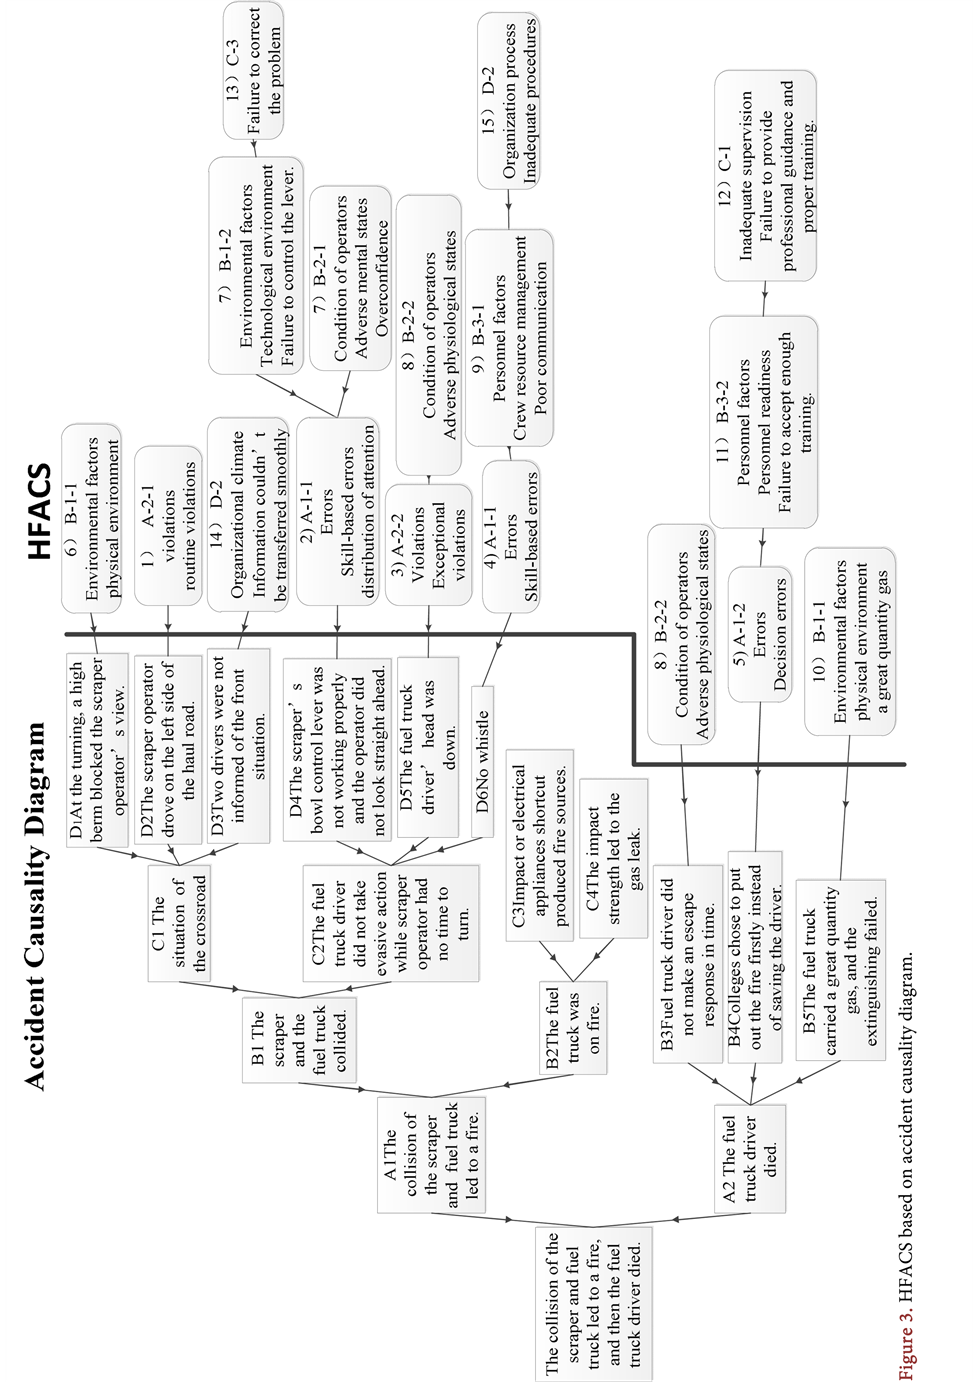
events, including “at the turning, a high berm blocked the scraper operator’s view”, “The scraper operator drove on the left side of the haul road” and so on.
4.3. Analysis of Basic Events Using HFACS as Shown in Figure 3
D1. The berm at the intersection affects the traffic. It is the physical environment of environmental factors.
D2. Due to a high berm blocking his view, scraper operator drove on the left side of the road when entering the haul road, violating the two-way, right-hand traffic rule. It was obvious that the violation was repeated violations, rather than short-term act.
D3. The two vehicles arrived at the crossroad at the same time, but either of the drivers did not realize the front traffic situation. The broadcast signal of the area was not good, so the communication between them was poor, which belongs to the level of organizational climate.
D4. The bowl control lever was not working properly when the scraper was slowing down, and scraper operator turned back instead of looking ahead. Failure to allocate his attention properly is a skill-based error. Scraper operator turned back resulting from his overconfidence for driving, which belongs to adverse mental states. And the failure to operate lever is the technological environment of environmental factors. There were problems with the bowl control lever repeatedly, but the supervisor did not help the scraper operator fix the lever in time,which is the failure to correct the problem.
D5. Fuel truck driver’ head was down, which was abnormal, and it was inferred that it was a sudden act caused by adverse physiological state.
D6. The two drivers did not whistle and did not take evasive action. It is a skill-based error. The drivers did not fully inform their location, and it was personnel factors-crew resource management. At the same time, it exposed that the company did not have the regulation that the staff should remind others when entering an area, and it was organization process.
C3, C4. Impact or electrical appliances shortcut produced fire source, which was the technological environment.
B3. After the collision, the fuel truck driver did not react to the call of the colleagues because of his adverse mental state.
B4. Colleagues chose to put out the fire firstly instead of saving the driver. The workers chose mistakenly when facing with the emergency, and it was decision error, which exposed the problem of inadequate training belonging to personnel readiness of personnel factors. If the company had provided with professional guidance and training for staff, this situation would have not happened, so its supervision was inadequate.
B5. The fuel truck carried a great quantity of gas, causing the extinguishing failed. It is environmental factors of physical environment.
From the analysis, it can be concluded that the key events are D3 “drivers are not informed of the front situation resulting from inadequate broadcast system”, D4 “the scraper’s bowl control lever was not working properly, so the operator did not look straight ahead”, B3 “fuel truck driver did not make an escape response in time” and B4 “Colleges chose to put out the fire firstly instead of saving the driver”. Thus, in order to prevent similar accidents, precautionary measures should focus on supervising workers to correct the problems timely at supervision level, improving the awareness of communication and saving human firstly at organizational level, besides, the company is supposed to strengthen the physical examination for all the staffs and install surveillance cameras at key positions.
5. Conclusions
1) On the theoretical basis, the new method, eliminating the shortcomings of HFACS, makes HFACS point to specific events and the sequence of events and description of causes more clear, and helps to find key factors to prevent the similar accidents.
2) From the analysis process, this method is clear and perspicuous and the step is easy to master, which provides an effective analysis method for accident analysis. From the analysis result, the method not only displays the relationship between the person and organization visually, but also can accurately classify the human factors. And the investigators can formulate corresponding measures to prevent accidents.
3) The analysis is based on the past researches, and Accident Causality Diagram remains to be drawn in more details. Although it has made some achievements, it still needs to be applied to a large quantity of practical accident analysis so as to prove its feasibility.
Cite this paper
Wu, B., Kou, L.Y. and Ma, Q. (2017) Research on HFACS Based on Accident Causality Diagram. Open Journal of Safety Science and Technology, 7, 77-85. https://doi.org/10.4236/ojsst.2017.72007
References
- 1. Shappell, S.A. and Wiegmann, D.A. (2000) The Human Factors Analysis and Classification System—HFACS. The Report of Office of Aviation Medicine Federal Aviation Administration, Washington DC, 20-46.
https://www.researchgate.net/publication/247897525_The_Human_Factors_Analysis_and_Classification_System-HFACS - 2. Zhang, L. and Chen, G.-H. (2009) Review on Accident Investigation and Analysis Methods. China Safety Science Journal, 19, 169-176.
- 3. Bu, Q.-M., Wang, Y.-T. and Wang, D.-G. (2007) Application study on Fault Tree Analysis. Journal of Southwest Petroleum University, 29, 141-144.
- 4. Salmon, P.M., Cornelissen, M. and Trotter, M.J. (2011) Systems-Based Accident Analysis Methods: A Comparison of Accimap, HFACS, and STAMP. Safety Science, 50, 1158-1170.
https://doi.org/10.1016/j.ssci.2011.11.009 - 5. Lv, C.-Y. and Fang, C.-H. (2009) The Human Factors Analysis and Classification System and Accident Analysis. Journal of China Civil Aviation Flight College, 20, 37-40.
- 6. Gan, X.S., Cui, H.L. and Gao, W.M. (2015) Analysis and Suggestion of Collision in Air Based on HFACS. Journal of Safety Science and Technology, 11, 96-102.
- 7. Dong, Z. (2014) Research on Safety Accidents in Coal Mines Based on HFACS. Thesis, Taiyuan University of Science and Technology, Shanxi.
- 8. Chen, Z.-B., Zeng, J.-C. and Dong, Z. (2013) Research on Safety Accidents in Coal Mines Based on HFACS. China Safety Science Journal, 23, 116-121.
- 9. Patterson, J.M. and Shappell, S.A. (2010) Operator Error and System Deficiencies: Analysis of 508 Mining Incidents and Accidents from Queensland, Australia Using HFACS. Accident and Prevention, 42, 1379-1385.
https://doi.org/10.1016/j.aap.2010.02.018 - 10. Wang, P.-P., Deng, X.-P. and Lu, Y. (2010) Research on Construction Accidents Based on Human Factors Analysis and Classification System. Journal of Engineering Management, 24, 60-64.
- 11. Zhang, X.-X., Xuan, S.-Y. and Xi, Y.-T. (2012) Research on the Reason of Marine Accidents Based on HFACS. Journal of Shanghai Maritime University, 33, 15-19.
- 12. Chauvin, C. and Lardjane, S. (2013) Human and Organizational Factors in Maritime Accidents Analysis of Collisions at Sea Using the HFACS. Accident Analysis Prevention, 59, 26-37.
https://doi.org/10.1016/j.aap.2013.05.006 - 13. Soner, O., Asan, U. and Celik, M. (2015) Use of HFACS-FCM in Fire Prevention Modeling on Board Ships. Safety Science, 77, 25-41.
https://doi.org/10.1016/j.ssci.2015.03.007 - 14. Wu, B., Zhao, Y.T. and Kou, L.Y. (2016) The Analysis of Tianjin Port Explosion Based on Accident Causality Diagram. The 4th International Behavioral Safety Management Conference. Xian University of Science and Technology Journal Center, 172-176.
- 15. United States Department of Labor Mine Safety and Health Administration (2011) Coal Mine Safety and Health Report of Investigation Surface Coal Mine Fatal Powered Haulage Accident.