Open Journal of Marine Science
Vol.07 No.04(2017), Article ID:78195,13 pages
10.4236/ojms.2017.74031
The Trend of Changes in Surface Wind in the Indian Ocean, in the Period from 1981 to 2015, Using Reanalysis Data, NCEP/NCAR
Ghazi Mirsaeid Mojgan1*, Mohammad Mehdizadeh Mehdi2, Bannazadeh Mohammad Reza3
1University of Hormozgan, Bandar Abbas, Iran
2Physical Oceanography, University of Hormozgan, Bandar Abbas, Iran
3Erfan University, Pule Khumri, Afghanistan

Copyright © 2017 by authors and Scientific Research Publishing Inc.
This work is licensed under the Creative Commons Attribution International License (CC BY 4.0).
http://creativecommons.org/licenses/by/4.0/


Received: October 15, 2016; Accepted: August 4, 2017; Published: August 7, 2017
ABSTRACT
Knowing the pattern of surface winds on the seas and oceans and how it changes over time is of great importance. In this research, the monthly surface wind fields on the Indian Ocean have been studied and analyzed for a 35-year period (1981-2015), using NCEP/NCAR data reanalysis. The results show that transition from cold to warm pattern happens in May and that the summer monsoon pattern begins in June and continues until August. The wind speed pattern tends to the winter monsoon from November on. The maximum average wind speed in June is 13 m/s and its minimum is 2 m/s in October. Direction of prevailing winds is the southwest in the summer. The highest wind speed happens in the latitude of 10 - 15 degrees. Analysis of the wind distribution shows that the wind speed of 2 - 5 m/s happens in about 60% of the cases. There is probability of blowing 0.5 - 4 m/s wind for all months; but this probability is higher in the autumn (October and November) than that in the summer (July and August). Probability of the monthly over 5 m/s winds shows a definitely opposite distribution; that is, wind speed in July and August is higher than that in October. A long-term survey on the speed of surface water wind and sea surface temperature shows an opposite changing trend in wind speed and sea surface temperature during a 55-year statistical period. Wind speed reduced, while the sea surface temperature was increasing. The wind speed gradient in the upper levels of atmosphere graph has been increasing; this phenomenon confirms the effects of global warming and ocean warming on the monsoon system patterns in the Indian Ocean.
Keywords:
North Indian Ocean, Wind Fields, Climatic Trend, Monthly Probability of Density Function (PDF), Cumulative Distribution Function (CDF)

1. Introduction
Oceans and seas are among the most effective environments on the countries’ economy, security and culture. Iran has a special position, regarding to access to the open waters in the south. The Indian Ocean is the third large ocean in the world and covers 20% of the earth. One of the most crucial effects of the ocean is creation of the rainy winds, which causes seasonal raining and tropical hot water current. About 60% of the world trade and transit are conducted through the Indian Ocean. This ocean has 36 countries in her neighborhood and forms 11 countries’ immediate access to open waters. Entrance of seven seas, four strategic straits (Hormoz, Bab-el-Mandeb, Malacca and Suez) is in this ocean. Wind field as one of the wind characteristics with applications in the study of currents and waves and billows is very important. Wind as the main source of wave production is considered the principle parameter in designing the offshore structures and sediment transport studies. According to studies, wind plays role in determining the water circulation pattern. Since many transits and trades are conducted through the Indian Ocean, and with regard to the extensiveness and special position of the ocean, it is necessary to know the wind patterns. The wind field and circulation in the Indian Ocean is highly complex [1] . Knowing the Oman Sea’s wind field is of great importance, because of the monsoon in the sea [2] [3] [4] . The summer monsoon is one of the basic factors of the earth climate [2] . Changes of the surface sea temperature are affected by the seasonal cycles and changing monsoon winds [5] [6] [7] [8] [9] . The aim of this research is to determine the monthly wind field of the Oman Sea, the Arab Sea, the Indian Ocean as well as study the wind speed changes in a long-term statistical period, in order to specify the effects of the climate changes on these parameters in the studied region, Figure 1. These changes would be also considered relative to the increase of latitude.
2. Data and Method
In this study, the data reanalysis of the National Center for Environment Predication (NCEP) and the National Center for Atmosphere Research (NCAR) have been used [10] . These data covers direction and speed of winds as well as surface

Figure 1. Indian ocean map (studied region).
sea temperature in the range of eastern 40 - 80 degrees along with the longitude and northern 0 - 25 degrees along with the latitude. The 35-year study period was from 1981 to 2015. Methodology was analysis of the mean wind field as follows:
- Determining the monthly surface wind field in the Indian Ocean in a 35-year period (1981-2013).
- Determining the direction of the prevailing wind, using the wind rose graph.
- Determining (PDF) and (CDF).
- Determining changes of the surface wind speed with the increase of latitude in the studied region.
- Determining changes of the wind speed, with the increase of altitude in the studied region.
- Determining the average changes of the surface wind speed from 1981 to 2015 and the effects of the ocean surface temperature on these changes.
3. Results
3.1. North Indian Ocean Seasonal Wind Field
Figure 2 shows the monthly surface wind field from 1981 to 2015; the images begin in the winter and end in the autumn. In December, direction of surface winds is northward on the Oman Sea and northeastward on the Arabian Sea and the Indian Ocean. The maximum wind speed is 8 m/s from Cape Hafum toward north and along with the Somalia coast to the Cape Asir and a little higher toward South Yemen (the region is referred to as CHCA in this paper). Wind speed is not considerable on the Oman Sea. The wind direction is northwestward
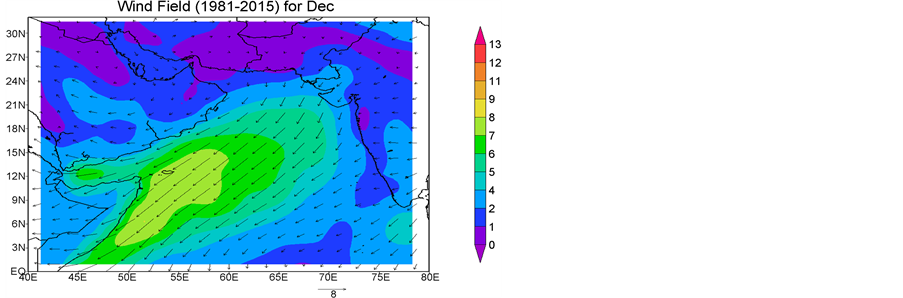
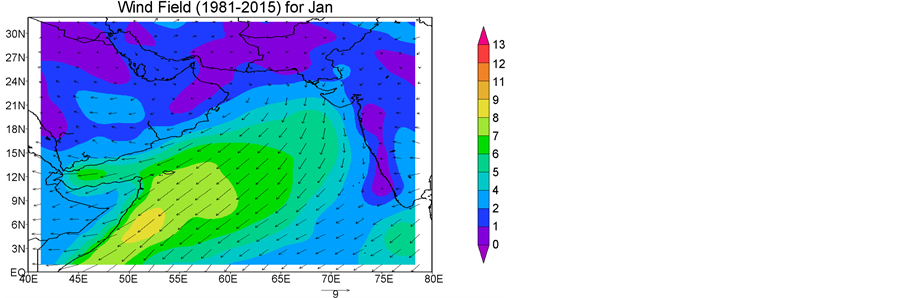
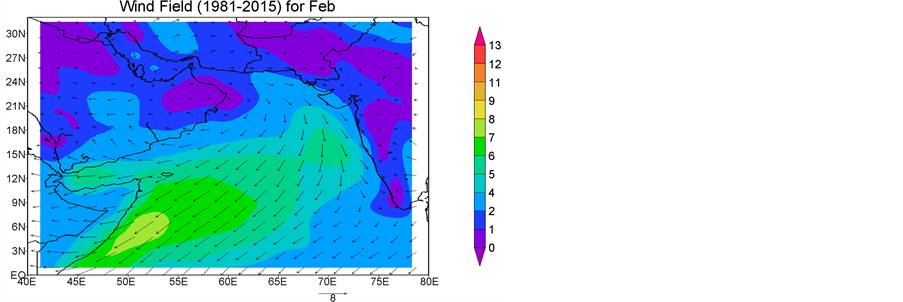
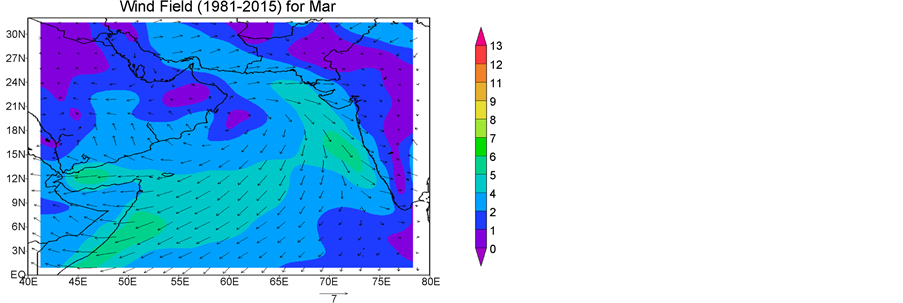
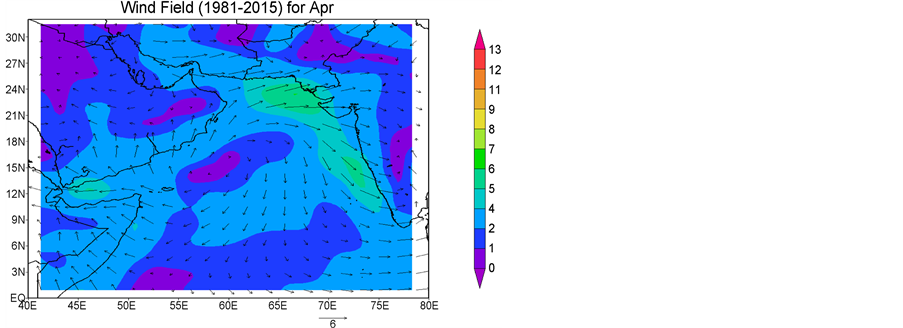
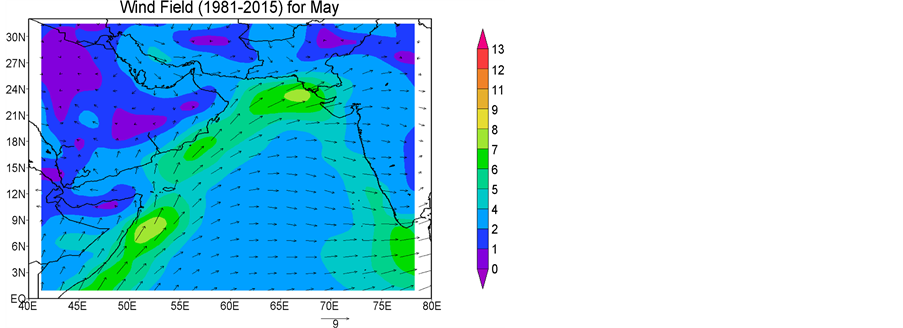
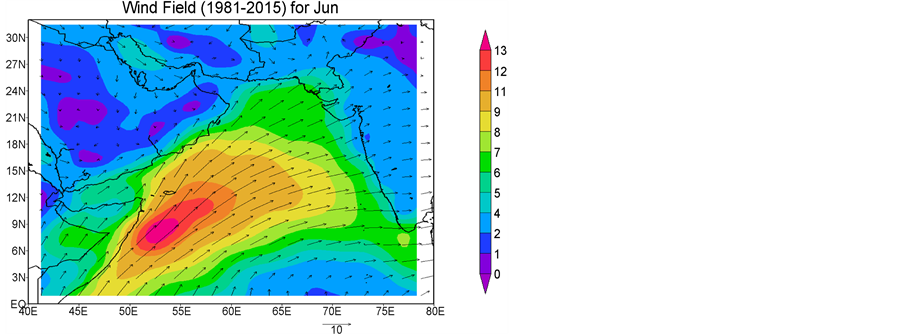
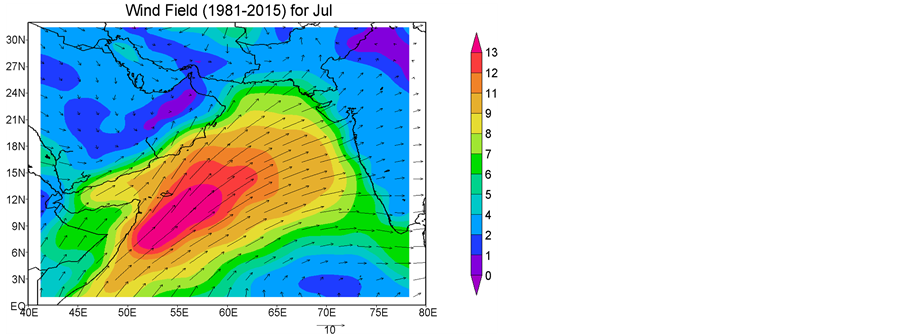
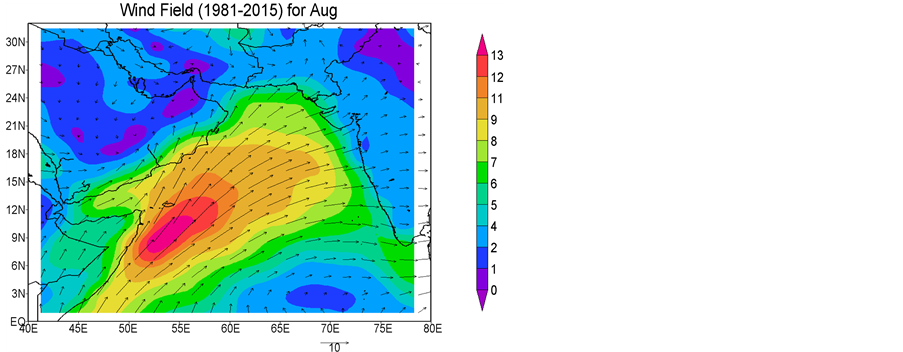
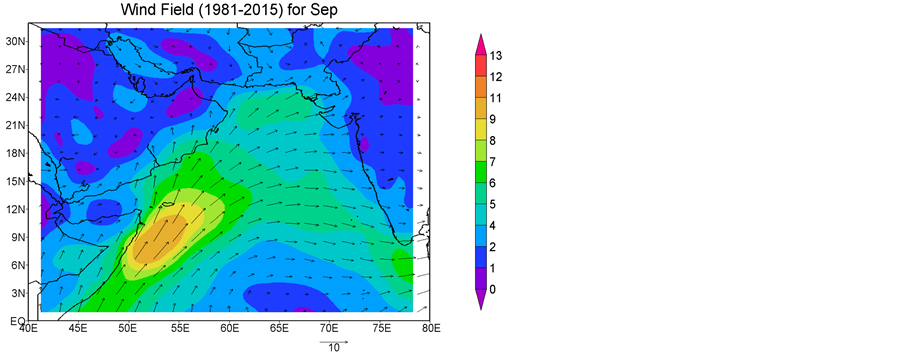
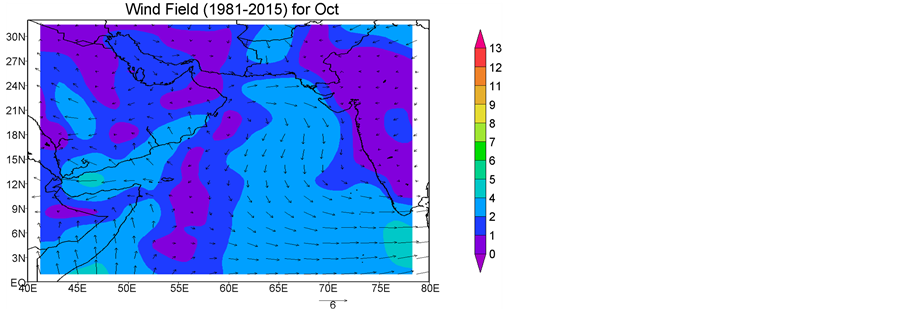
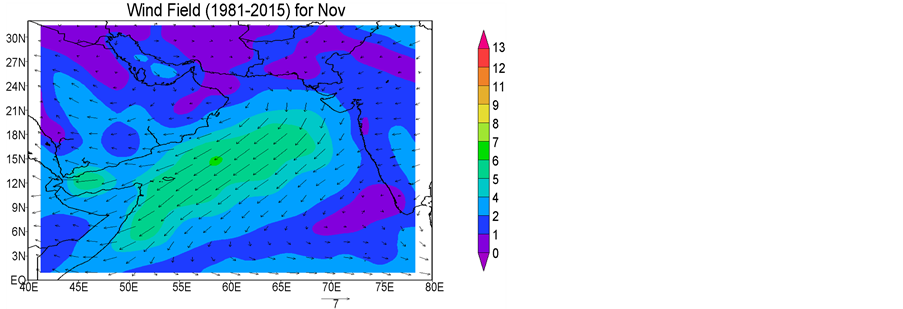
Figure 2. Monthly surface sea wind field from 1981 to 2015.
on the Oman Sea, in January, but it is northeastward on the Indian Ocean. In February, however the wind direction becomes more westward on the Oman Sea, while it is northwestward on the Arabian Sea and northeast on the Indian Ocean.
The wind speed also reduced. In March, the westward winds’ speed increases on the Oman Sea. The wind direction is northeastward on the Indian Ocean, while in April it is westward on the Indian Ocean. The wind field pattern in May changes, entirely. In the west of the Indian Ocean, the wind direction becomes southwest and the direction is westward in the middle. The first month of summer (June) faces southwestward winds in all studied regions; the wind speed increases, considerably with maximum speed of 13 m/s in the CHCA. The same pattern dominates in July, with higher wind speed, of course. The same is true for August. In September and beginning of the autumn, the wind field pattern is the same as that in May. In October, winds become northward and wind speed reduces on the Indian Ocean. In November, winds direction becomes northeastward and tends to the winter pattern.
Figure 3 shows monthly average wind speed in a 35-year period from 1981 to 2015. The maximum wind speed in July is 5.59 m/s and the least wind speed in October is 2.02 m/s. the figure reveals that the highest speed happens in the summer (summer monsoon) and in the winter (winter monsoon). Wind speed reduced considerably in other seasons.
3.2. Prevailing Wind in the North Indian Ocean Basin
Figure 4 shows the monthly wind rose in a 35-year period. In December, the prevailing wind direction is northeastward and the wind speed is 0.5 to 2 m/s. The same pattern is seen in January, February and March. In April the prevailing
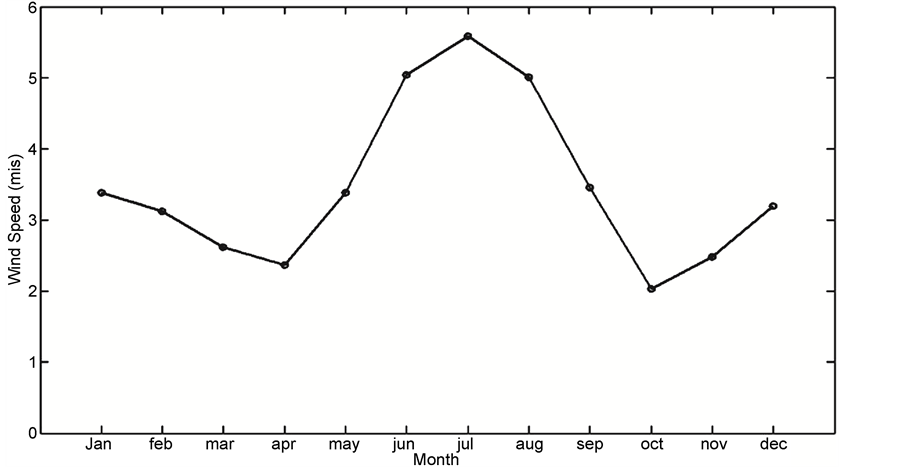
Figure 3. The monthly average wind speed (m/s) in a 35-year period from 1981 to 2015 in the studied region.
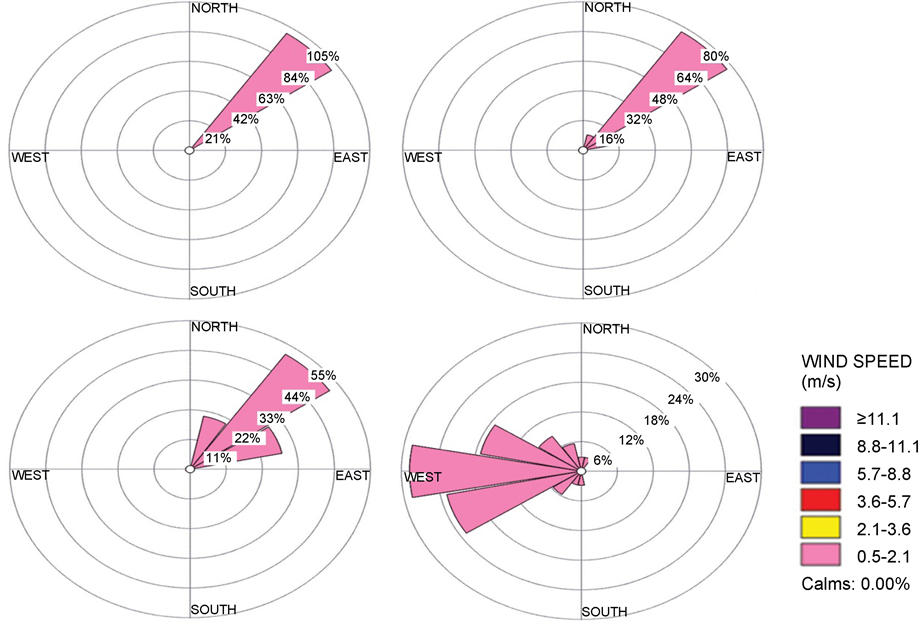
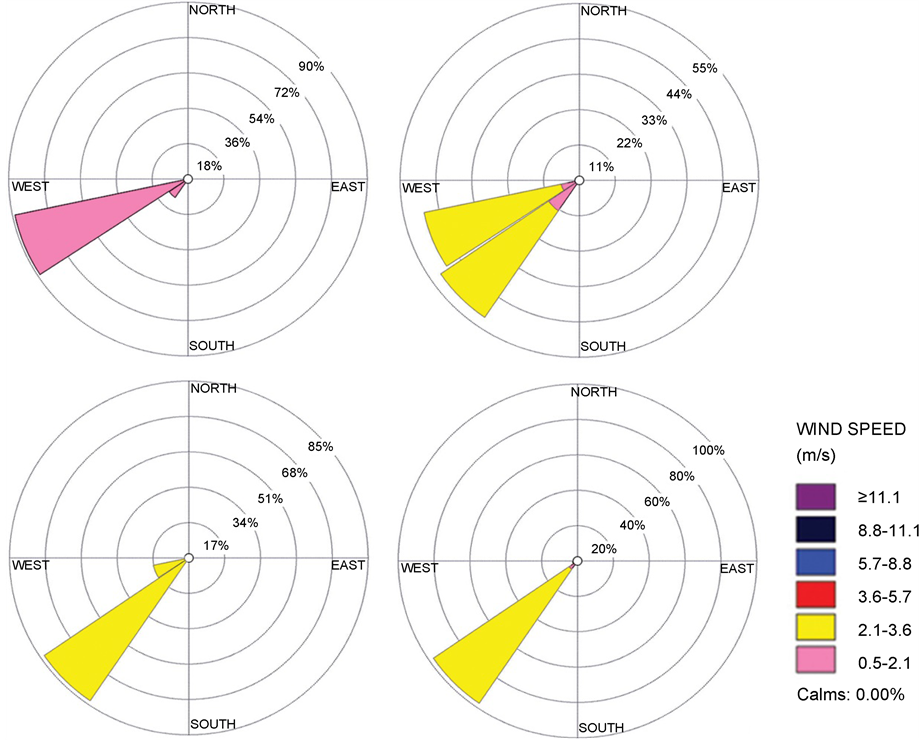
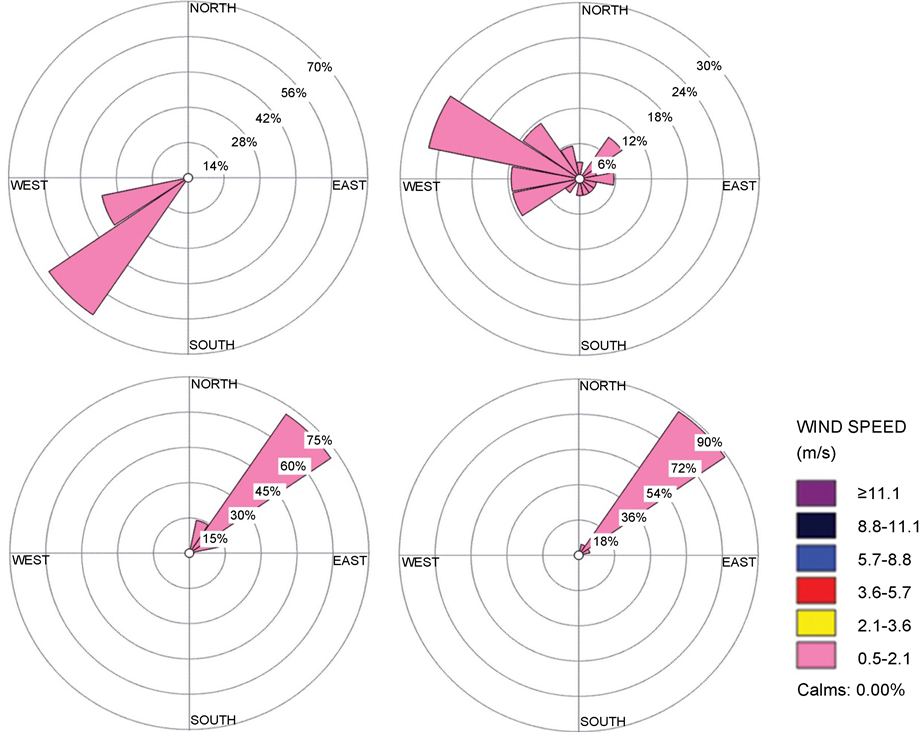
Figure 4. Monthly wind rose from 1981 to 2015.
wind direction changes considerably; so that it is westward at about 30% of the cases. The sub-prevailing wind is southwestward with 25% of all winds, followed by the northwest winds with 23%. The winds speed had no increases and it was 2 m/s. In May, the prevailing and sub-prevailing winds are in southwest direction with the same speed as in the previous month. In June, the wind direction is southwestward. 11% of the winds have the speed of 0.5 to 2 m/s and others’ speed is 2.1 to 3.6 m/s. July is similar to June, but the wind speed varies from 2.1 to 3.6 m/s. August follows the summer pattern, but in September, both prevailing and sub-prevailing wind speed is 0.5 to 2 m/s and southwestward. The wind rose pattern in October, which is the month of transition from cold to warm weather, differs from that in summer months, seriously. The prevailing wind direction is northwestward, which has speed of 0.5 to 2 m/s in 25% of cases. 10% of the west winds, 8% of the northeast winds and 5% of the west winds have the same speed. The pattern in November follows the winter pattern as in December and January.
Figure 5 shows winter, summer and yearly wind roses, respectively. In the winter pattern, the prevailing wind direction is northeast with maximum speed of 2 m/s. In the summer pattern, the prevailing and sub-prevailing wind direction
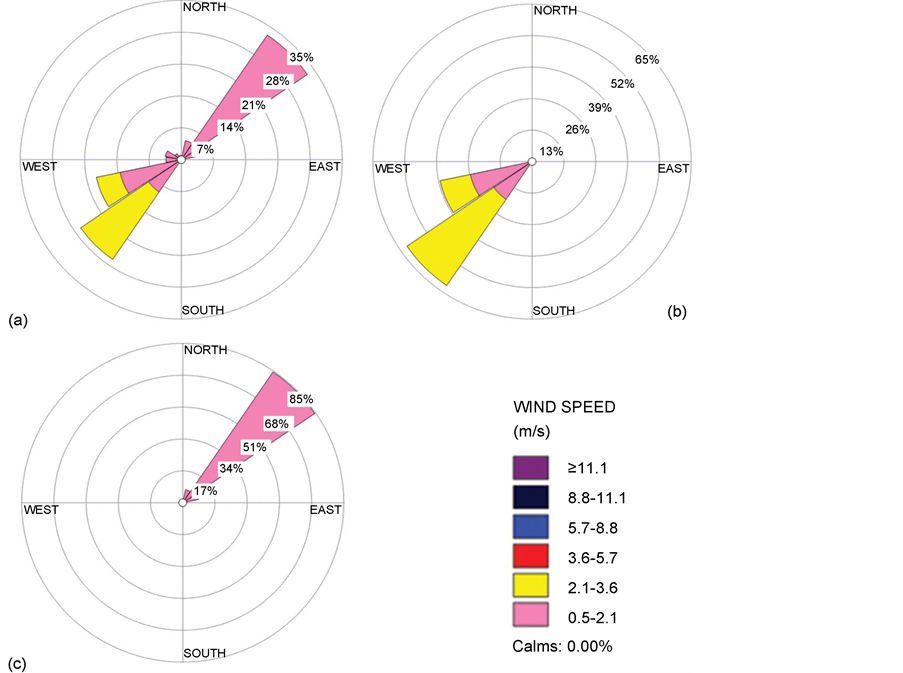
Figure 5. (a) yearly, (b) summer and (c) winter wind rose patterns from 1981 to 2015.
is southwest. The prevailing wind consists of 55% of all winds of which 15% blow with the speed of 2 m/s and other 40% with 2 - 3.6 m/s. The yearly pattern however, provides a Northeast prevailing wind, which forms 35% of all winds with maximum speed of 2 m/s. The sub-prevailing wind blows to southwest direction with the speed of 3.6 m/s.
3.3. Wind Speed Changes Relative to the Latitude
To investigate wind speed changes in various latitudes, a fix longitude (in this research the 60 degrees circuit) has been selected (in order to cover the Iranian coast of the Oman Sea); north latitude 5 to 25 degrees. The average wind speed has been calculated in a 35-year period (Figure 6). The highest wind speed at latitude 10 - 15 degrees is about 6 m/s. It is about 4.5 m/s near the equator. The lowest wind speed blows at latitude 25 degrees, due to proximity to the coasts. This speed is 2.7 m/s. The reason for increase of wind speed in latitudes 10 - 15 degrees is being away from beaches and mitigation of friction effects, due to the terrains; as well as significant amounts of Corilios force at above the quarter.
3.4. Seasonal Probability Analysis
In order to explain systematic distribution of all winds in the studied field, we have used this analysis for a 35-year period. The monthly PDF (Figure 7(a)) and
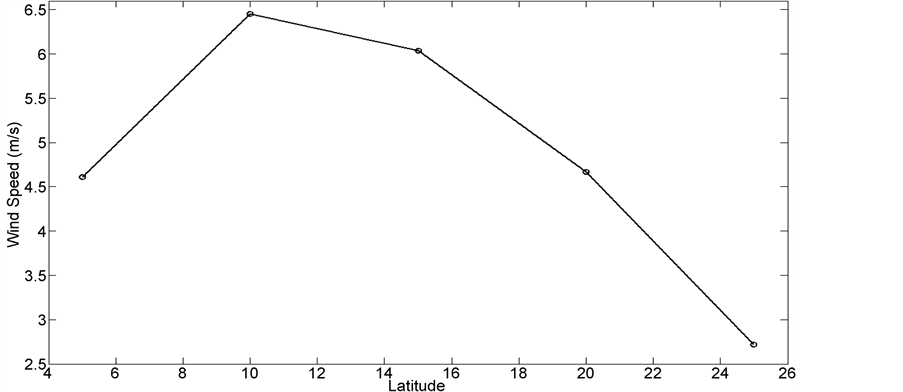
Figure 6. The mean wind speed (m/s) at north longitude 60 degrees and latitudes 5 - 25 degrees in a 35-year (1981-2015) in the studied region.
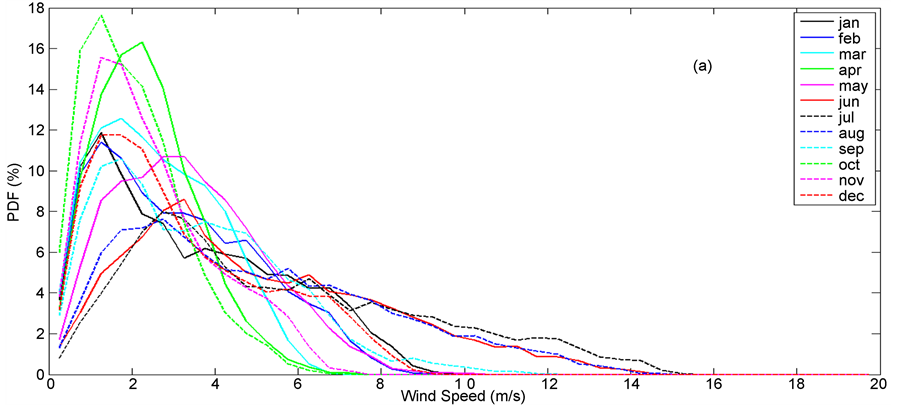
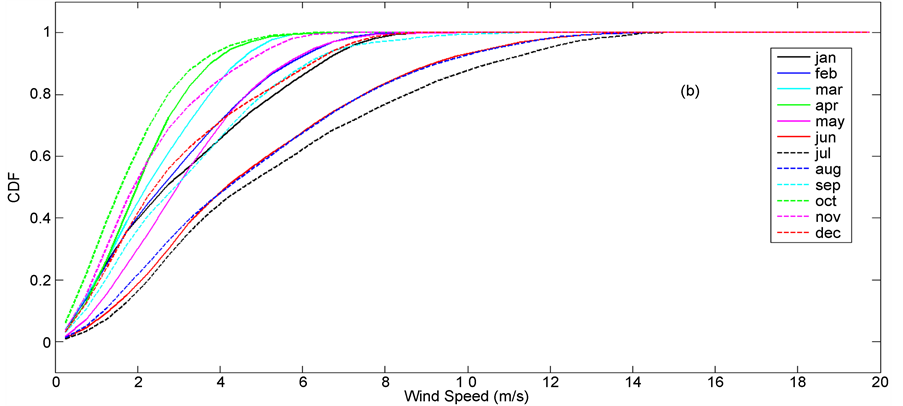
Figure 7. PDF (a) and CDF (b) for the winds in the studied region (the average of each month for a 35-year period from 1981 to 2015 has been calculated).
CDF (Figure 7(b)) of the region reveal that the wind speed of 2 - 5 m/s happens in about 60% of cases (CDF about 80% near to 5 m/s minus CDF of 20% with the speed at about 2 m/s). Probability of speed at about 0.5 - 4 m/s can be observed for all months. However, the probability is higher in the autumn months (October and November) than that in the summer months (July and August) at about 50% (CDF 90% in October minus CDF 40% in July at about 4 m/s). Probability of monthly wind with the speed of over 5 m/s shows a perfectly opposite distribution, i.e. the wind speed in July and August is higher than that it October. For example, the winds blow at the speed of over 5 m/s in June, July and August with frequently of 40% (CDF 100% at the speed of about 12 m/s minus CDF 60% at the speed of about 5 m/s); but about 10% (CDF 100% at the speed of about 7 m/s minus CDF 90% at the speed of about 4 m/s) are observed in April and March. Seasonal changes of PDF and CDF are consistent with the wind speed climatology of the studied region.
3.5. Changes of Wind and Sea Water Temperature in the Indian Ocean Basin
Researches on the changes of wind region in the Indian Ocean are less than those in other ocean, such as the Pacific and Atlantic oceans, while a large crowd live on the edge of this ocean and their lives would be severely affected by the climate changes [11] . Registration of the long-term observation data including wind on the sea and ocean surface is very rare relative to land surface [12] . Figure 8 shows the wind speed changes in the Indian Ocean basin from 1981 to 2015. As the changes line slope in the chart shows, the average wind speed in the 35-year period is downward. It also faces many fluctuations, so that the highest wind speed average in 2015 was 3.63 m/s, and in 2000 it was 3.6 m/s. the chart of seawater temperature changes in this period has been contrary to that of the wind speed in the region (Figure 9). As the line slope reveals, the seawater temperature is upward. SST in 2015 was 28.7˚C, which differs from the least wind speed average in the same year. The least SST related to 1984 and 1985 with 27.6˚C, which is exactly consistent with the maximum average wind speed. In other words, the two variables are completely reverse. This means that SST changes in the Indian Ocean are highly affected by the monsoon currents. The findings of this study are in conformity with those of Swapna et al. (2014) [13] ,
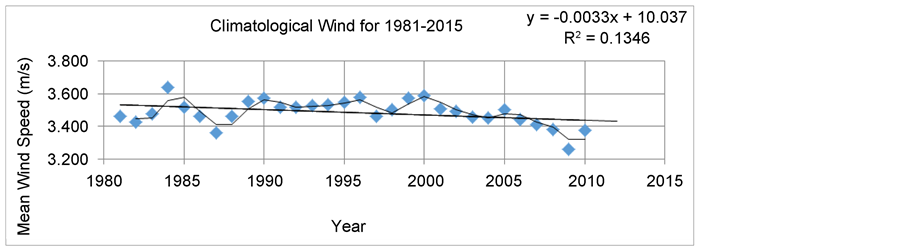
Figure 8. Surface wind on the Northern Indian Ocean from 1981 to 2015.
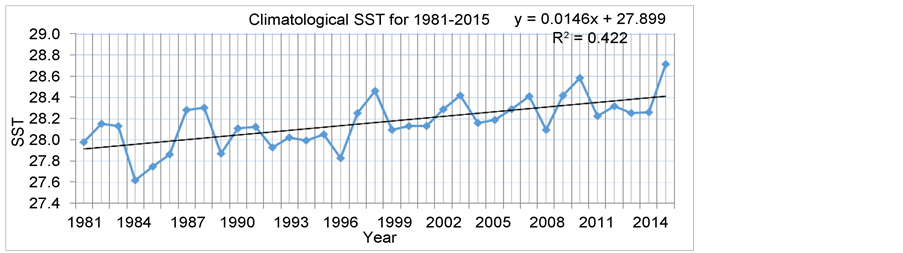
Figure 9. Changes of surface temperature on the Northern Indian Ocean from 1981 to 2015.
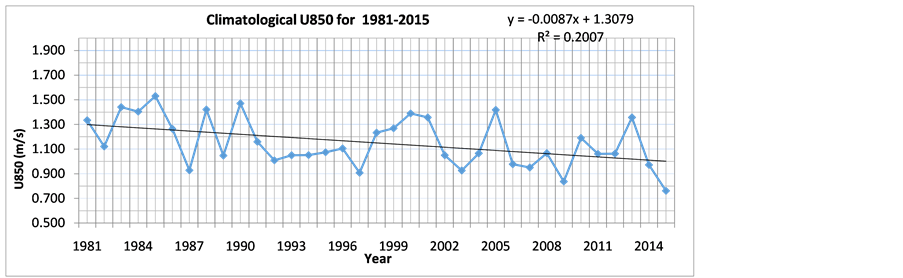
based on the ECMWF data reanalysis in the period 1958-2011. These findings confirm the effect of global warming on the pattern of winds and monsoon currents of the Indian Ocean [14] . For further exploration, we have analyzed the wind speed changes at lower level (850 hPa), middle level (500 hPa) and higher level (200 hPa) of the atmosphere in a 35-year period. The wind speed changes is download relative to time in two levels of 500 and 850 hPa, but the download slope of the wind speed at the 500 hPa level is less than that at the lower level of atmosphere and land surface. At the 200 hPa level, wind speed increased as time passed (Figures 10(a)-(c)). Therefore, dependency of the wind speed change to the lower levels variable and global warming is confirmed.
4. Discussion and Conclusion
General knowing about the different characteristics of seas surrounding Iran would improve efficacy of the macro decisions and ultimately provide the country with sustainable development. Nearly, one third of the southern coast strip of Iran is covered by the Oman Sea coast, which connects to the Indian Ocean and is affected by its pattern changes in long-term. It is an instrument for prediction of the climatic changes. Where there is no/little observation data, the reanalysis data are used in long-term. The surface sea wind climatology for the Oman Sea, Arabian Sea and Indian Ocean was analyzed for the period 1981-2015, using NCEO/NCAR data. The results show the seasonal changes in speed and direction of the wind in the studied regions. Changes in speed and direction of wind happen in May and the summer monsoon pattern begins in June. After the summer monsoon, in October the region faces a change in the wind field pattern. From November this pattern goes toward the winter monsoon. The maximum average of wind speed in the CHCA reaches to 13 m/s in July. In the entire region, the maximum wind speed in July is six m/s and the minimum in October is 0.5 - 2 m/s. The prevailing wind direction in the winter is northeastward and in the summer, and it is westerly and southeasterly. Changes in wind speed relative to latitude shows that the highest wind speed happens in 10 - 15 degrees, where it is far from the equator in the south and far from friction effects in the North. Analysis of the wind distribution probability reveals that wind speed of 2 - 5 m/s happens in 60% of cases. Probability of wind speed of 0.5 - 4 m/s is for all
 (a)
(a)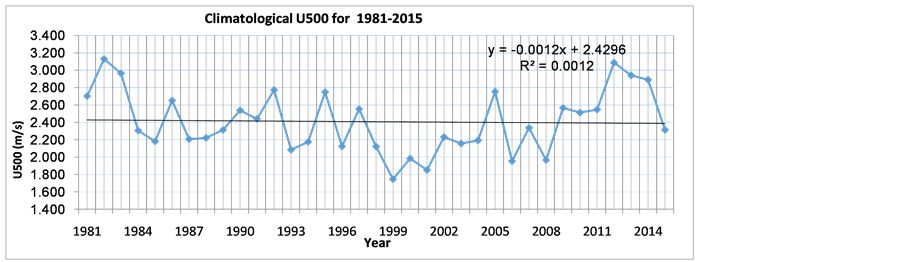 (b)
(b) (c)
(c)
Figure 10. Changes of wind speed (m/s) on the Northern Indian Ocean from 1981 to 2015; (a) at 850 hPa level; (b) at 500 hPa level; (c) at 200 hPa.
months. However, this probability in the autumn months (October and November) is higher than that in the summer month (July and August). The monthly probability of winds with the speed of over 5 m/s shows an opposite distribution; that is, the wind speed in July and August is higher than that in October. The highest and lowest wind speed happened in 1984 and 2015, respectively. The trend of wind speed changes was downward and that for the SST changes was upward during the 35-year period. Again, the wind speed trend increased, due to the global warming phenomenon. Therefore, the monsoon pattern of the Indian Ocean has been severely affected by the climatic changes, which may change the region’s climate cycle.
Cite this paper
Mojgan, G.M., Mehdi, M.M. and Reza, B.M. (2017) The Trend of Changes in Surface Wind in the Indian Ocean, in the Period from 1981 to 2015, Using Reanalysis Data, NCEP/NCAR. Open Journal of Marine Science, 7, 445- 457. https://doi.org/10.4236/ojms.2017.74031
References
- 1. Wyrtki, K. (1973) Physical Oceanography of the Indian Ocean. In: B. Zeitzschel, and Gerlach, S.A., Eds., Ecological Studies: Analysis and Synthesis, Vol. 3, Springer, Berlin, Heidelberg, 18-36. https://doi.org/10.1007/978-3-642-65468-8_3
- 2. Wang, B., Wu, R. and Lau, K.M., (2001) Interannual Variability of the Asian Summer Monsoon: Contrasts between the Indian and the Western North Pacific-East Asian Monsoons. Journal of Climate, 14, 4073-4090. https://doi.org/10.1175/1520-0442(2001)014<4073:IVOTAS>2.0.CO;2
- 3. Shankar, D., Vinayachandran, P.N. and Unnikrishnan, A.S. (2002) The Monsoon Currents in the North Indian Ocean. Progress in Oceanography, 52, 63-120. https://doi.org/10.1016/S0079-6611(02)00024-1
- 4. Song, F. and Zhou, T. (2014) Interannual Variability of East Asian Summer Monsoon Simulated By CMIP3 and CMIP5 AGCMs: Skill Dependence on Indian Ocean- Western Pacific Anticyclone Teleconnection. Journal of Climate, 27, 1679-1697. https://doi.org/10.1175/JCLI-D-13-00248.1
- 5. McCreary, J.P., Kundu, P.K. and Molinari, R.L. (1993) A Numerical Investigation of the Dynamics, Thermodynamics and Mixed Layer Processes in the Indian Ocean. Progress in Oceanography, 31, 181-244. https://doi.org/10.1016/0079-6611(93)90002-U
- 6. Rao, R.R. and Sivakumar, R. (2000) Seasonal Variability of Near-Surface Thermal Structure and Heat Budget of the Mixed Layer of the Tropical Indian Ocean from a New Global Ocean Temperature Climatology. Journal of Geophysical Research, 105, 995-1015. https://doi.org/10.1029/1999JC900220
- 7. Lee, C.M., Jones, B.H., Brink, K.H. and Fischer, A.S. (2000) The Upper Ocean Response to Monsoonal Forcing in the Arabian Sea: Seasonal and Spatial Variability. Deep Sea Research Part II: Topical Studies in Oceanography, 47, 1177-1226. https://doi.org/10.1016/S0967-0645(99)00141-1
- 8. Sengupta, D., Goswami, B.N. and Senan, R. (2001) Coherent Intraseasonal Oscillations of Ocean and Atmosphere during the Asian Summer Monsoon. Geophysical Research Letters, 28, 4127-4130. https://doi.org/10.1029/2001GL013587
- 9. Duncan, B. and Han, W. (2009) Indian Ocean Intraseasonal Sea Surface Temperature Variability during Boreal Summer: Madden-Julian Oscillation versus Submonthly Forcing and Processes. Journal of Geophysical Research, 114, C05002. https://doi.org/10.1029/2008JC004958
- 10. Kalnay, E., Kanamitsu, M., Kistler, R., Collins, W., Deaven, D., Gandin, L. and Zhu, Y. (1996) The NCEP/NCAR 40-Year Reanalysis Project. Bulletin of the American Meteorological Society, 77, 437-471. https://doi.org/10.1175/1520-0477(1996)077<0437:TNYRP>2.0.CO;2
- 11. Han, W., Vialard, J., McPhaden, M.J., Lee, T., Masumoto, Y., Feng, M. and De Ruijter, W.P. (2014) Indian Ocean Decadal Variability: A Review. Bulletin of the American Meteorological Society, 95, 1679-1703. https://doi.org/10.1175/BAMS-D-13-00028.1
- 12. Hurrell, J.W. (1995) Decadal Trends in the North Atlantic Oscillation: Regional Temperatures and Precipitation. Science, 269, 676-679. https://doi.org/10.1126/science.269.5224.676
- 13. Swapna, P., Krishnan, R. and Wallace, J.M. (2014) Indian Ocean and Monsoon Coupled Interactions in a Warming Environment. Climate Dynamics, 42, 2439- 2454. https://doi.org/10.1007/s00382-013-1787-8
- 14. Vialard, J., Jayakumar, A., Gnanaseelan, C., Lengaigne, M., Sengupta, D. and Goswami, B.N. (2011) Processes of 30 - 90 Days Sea Surface Temperature Variability in the Northern Indian Ocean during Boreal Summer. Climate Dynamics, 38, 1901- 1916. https://doi.org/10.1007/s00382-011-1015-3