Open Journal of Marine Science
Vol.3 No.1(2013), Article ID:27160,11 pages DOI:10.4236/ojms.2013.31001
A Process Study of the Wind-Induced Circulation in the Persian Gulf
1Université Pierre et Marie Curie, Paris, France
2Université de Bretagne Occidentale, Brest, France
3Ifremer, Brest, France
Email: xcarton@univ-brest.fr
Received July 13, 2012; revised September 4, 2012; accepted September 21, 2012
Keywords: Persian Gulf; Wind-Induced Circulation; Hydrodynamical Modeling
ABSTRACT
A shallow-water model, coupled with a three dimensional, hydrostatic ocean model, is used to study the wind induced circulation, and the Shatt-al-Arab river plume expansion, in the Persian Gulf. The models are used in an idealized configuration. The following results are obtained: 1) with northwesterly winds, a double gyre is formed: this gyre is cyclonic in the south and anticyclonic in the north. Southeastward currents flow along the Iranian and Arabian coast where the wind stress at the surface dominates the pressure gradient related to the free surface slope, and conversely in the deeper region of the Gulf; 2) in the eastern part of the Gulf, the cyclonic gyre intensifies, as observed and reported in the literature; 3) for northwesterly winds, the plume from Shatt-al-Arab first heads towards the Iranian coast and then spreads southeastward along the Arabian coast; for northerly and northeasterly winds, the plume directly follows the Kuwaiti coast and then the Arabian coast. This sensitivity of the orientation can be related to the double gyre flow structure; 4) a southeasterly wind confines the plume in the northern end of the Gulf as does a pure tidal flow.
1. Introduction
The Persian Gulf is a northwest to southeast oriented basin, with length of about 1000 km, maximum width of 350 km, average depth of 40 m and maximum depth of 120 m at the Straits of Hormuz which open on the Gulf of Oman (see Figure 1(a)). Its surface is about 239,000 km2 and its volume is 8780 km3. It is bounded to the Northwest by flat land (the delta of Iranian and Iraki rivers), to the Northeast by the Zagros mountains, and to the Southwest by the desert of Saudi Arabia. High evaporation over the Persian Gulf leads to the formation of salty waters, called the Persian Gulf Water, which are exported into the Gulf of Oman, and which are compensated by an inflow of fresher Indian Ocean Surface Water. In this paper, we study the wind-driven circulation of the Persian Gulf, assuming initial water mass homogeneity, and we also investigate the evolution of the plumes from its northern rivers.
Winds over the Persian Gulf are dominantly northwesterly with an annual mean of 5 m/s. This dominant wind is called Shamal and it blows regularly in summer, while wind bursts can occur in winter. These bursts are preceded by episodes of southerly winds called Kaus or Suhaili. A northeasterly wind called Nashi can also blow along the Iranian coast for 3 to 5 days during winter. Closer to the Straits of Hormuz, the winds are more influenced by the monsoon cycle (northeasterlies in winter, southwesterlies in summer).
Most rivers which exit in the Persian Gulf are located in its northwestern part. Two groups of rivers can be distinguished:
1) Near the Iraki border, the Shatt-al-Arab is formed by the confluence of rivers Tigris, Euphrates and Karun. Different estimates have been provided by several authors for the yearly averaged transport of this group of rivers: from 160 m3/s to 3150 m3/s [1,2]; a value of 1400 m3/s is usually retained for this average transport. Furthermore, the transport is quite variable with seasons (from 700 m3/s in October to 5700 m3/s in April) [3];
2) Along the Iranian coast, rivers Hendijan, Hilleh and Mand would carry 2034 m3/s as reported by [2]; this should be confirmed and their variability should be determined, so that further studies could take them into account. For the moment, studies on the influence of rivers on the Persian Gulf circulation (like [4]) have considered only the first group of rivers.
The precipitation rate is very weak in the Gulf: it amounts to 7 cm/year for the whole Persian Gulf, which is 4 times smaller than the river discharge [5]. Evaporation is very strong but its estimates are quite variable,
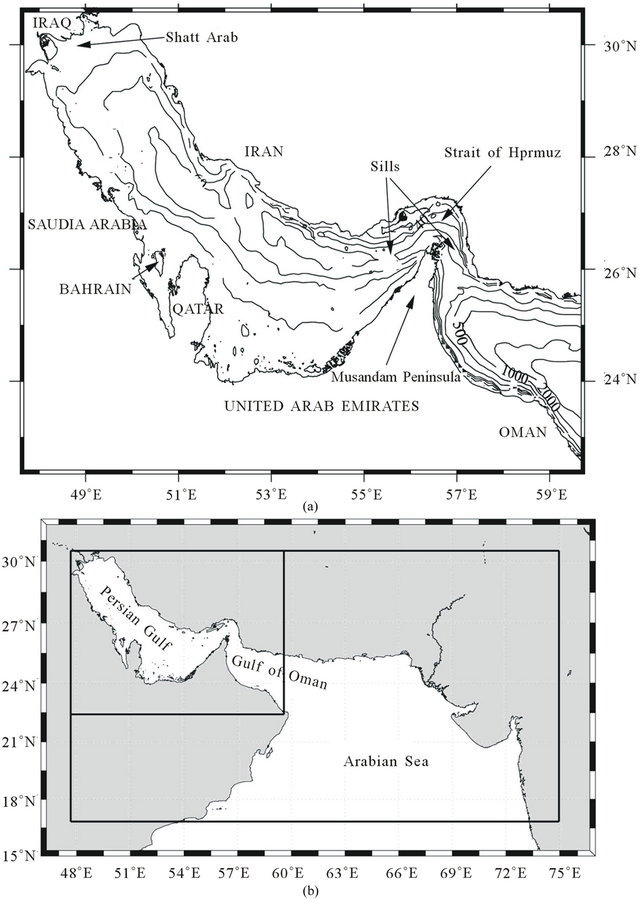
Figure 1. (a) Bathymetry and geography of the region of the Persian Gulf and of the Gulf of Oman. The thin isolines are the isobaths and the numbers on them indicate their depth in meters (20 m, 40 m...); (b) The two boxes show the limits of the 2D model (the largest) and of the 3D model (the smallest).
from 144 to 500 cm/year [6-8]; a value of 200 cm/year has been used in recent work [2]. The deficit in freshwater for the whole Persian Gulf is therefore on the order of 416 km3/year which confers characteristics of an evaporation basin to this gulf.
This paper is organized as follows: Section 2 presents the numerical 2D and 3D models used in this study. In Section 3, the circulation driven by the tide and the wind in a homogeneous gulf is detailed and explained. In Section 4, the evolution of the Shatt-al-Arab plume is calculated for various types of wind forcings. In the same section, the separate effect of tides and winds is shown. Finally, conclusions are drawn.
2. The Model
A two-dimensional shallow-water model in spherical coordinates for a homogeneous ocean was first implemented over a large domain comprising the Northwestern Indian Ocean, the Persian Gulf and the Gulf of Oman
(see Figure 1(b), large frame). The grid mesh was 9 km in each direction. Bathymetric data with a 5’ × 5’ resolution were provided by Proctor for the Persian Gulf (see in particular [9]) and elsewhere, ETOPO bathymetry was used. The model had quadratic bottom friction proportional to gravity, to the modulus of velocity times its vector, and inversely proportional to the squared Strickler number (equal here to 45 m−1/3·s−1) and to the cubic root of ocean depth. The model also had harmonic diffusion of horizontal momentum with a diffusivity coefficient equal to 365 m2·s−1.
When tide was included in the simulations, four semi-diurnal tidal components M2, S2, N2, K2 and three diurnal components K1, O1 and P1 were forced simultaneously on the water height at the southern boundary of this domain. This model was started from a state of rest. The surface height and barotropic velocity derived from the 2D model were then used to force the three dimensional model in the smaller domain (see Figure 1(b), small frame [10]).
A previous study [11] showed that the tidal elevations and currents provided by this model are realistic.
The three-dimensional hydrodynamical model used in this study was MARS-3D [12] based on the Blumberg and Mellor model [13]. The horizontal resolution was 9 km, and 30 sigma levels were used. The sigma level distribution was denser near the surface. Quadratic friction was applied at the ocean bottom. Harmonic dissipation was added to the momentum equations. The dissipation coefficients were calculated according to Smagorinsky [14]. Friction and dissipation coefficient amplitudes were kept to a minimum compatible with the model dynamical and numerical stability. A homogeneous ocean was used as the basic state in this study (before the river plumes were allowed to flow). The temperature was set to 26˚C and the salinity to 40 psu.
Our purpose here is to study the wind-driven circulation and the effect of wind on the spreading of river plumes, in the presence of tides. Therefore, no thermohaline flux was applied at the ocean surface. The study of the wind-driven and thermally forced circulation in the stratified gulf will be the subject of a forthcoming paper.
3. Wind-Driven Circulation
3.1. Circulation Due to a Northwesterly Wind
Firstly, a uniform and steady northwesterly wind, with 5 m/s velocity, was applied over the domain (northwesterly winds are dominant over the Gulf as recalled in the introduction). After 8 days of simulation, the ocean currents became stationary. The tide was also forced in the model, but a Demerliac filter [15] was used to remove the instantaneous tidal currents from the final results. Only the residual tidal currents were left. The results are the following:
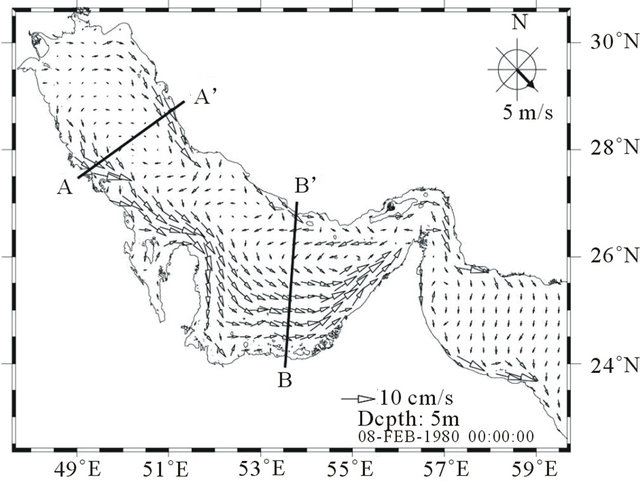
In the western part of the Gulf, the surface current is mostly southeastward in the shallow areas near the coasts and northwestward in the deeper area (see Figure 2(a)). This forms a double gyre system. In the eastern part of the Gulf, the cyclonic gyre becomes dominant. A southeastward current exists along the Iranian coast despite the presence of this cyclonic structure. This circulation is controlled by the wind, by bottom topography and by the shape of the basin. The current is surface-intensified, with maximal amplitudes larger than 10 cm/s, along the coasts and in shallow areas of the southeastern part of the Gulf (where depths are smaller than 30 m).
Bottom currents (see Figure 2(b)) are weaker than their surface counterparts and do not exceed a few cm/s. Close to the coasts and in shallow areas, the bottom currents are southeastward or eastward (like the surface currents), and in the central, deeper, part of the Gulf, the
 (a)
(a)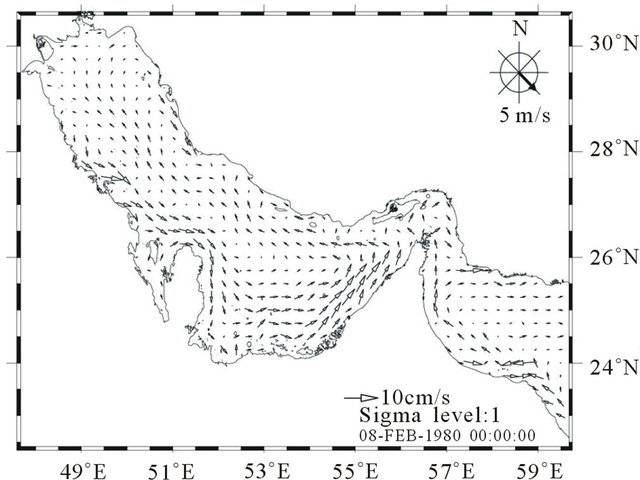 (b)
(b)
Figure 2. Maps of the surface currents (a) and of the bottom currents (b), after 8 days of simulation with northwesterly winds. (a) shows the location of the two vertical sections (AA’, BB’) presented in Figure 3" target="_self"> Figure 3.
bottom current heads northwestward against the wind. The current is then very weak (1 or 2 cm/s).
The vertical structure of the currents shows few differences between the eastern and western parts of the gulf. Figure 3 presents two cross-sections, respectively in the western (section AA’) and eastern (section BB’) parts of the Gulf. The southeastward coastal currents, and the return flow in the deeper, central region, can clearly be seen on both sections. The only noticeable difference between the two sections lies in the center of the eastern section: the surface flow has a cyclonic signature there, which is absent from the western section.
3.2. Sensitivity of the Circulation to the Wind Direction
Figure 4 presents the surface and bottom currents obtained for other directions of the wind, which have also been observed over the Gulf. In all cases, the wind velocity is uniform and equal to 5 m/s.
The circulation resulting from a northerly wind is similar to that generated by northwesterlies. The velocity amplitudes are nevertheless slightly weaker over the whole water column.
The circulation induced by a northeasterly wind is different from that created by northwesterlies. Far fewer patterns are observed in the current structure, except for a deep anticyclonic circulation in the eastern basin.
Finally, southeasterly winds induce a circulation opposite to that created by northwesterlies, both at the surface and at the bottom. This result illustrates the constraint imposed by the basin shape and by the bottom topography on the circulation.
The same characteristics are retrieved in the vertically averaged currents, for the same wind directions (figure not shown).
3.3. Relation to Former Studies and Interpretation
The current structure that we have shown in Figure 2 is very similar to that described by Csanady [16]; his idealized simulations (without Coriolis force nor bottom
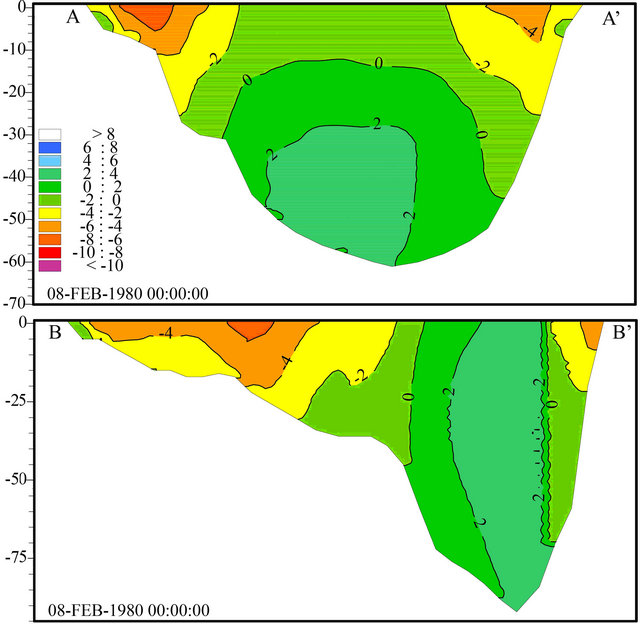
Figure 3. Cross-section of perpendicular velocity (to the section axis), in the western (section AA’) and eastern (section BB’) parts of the Gulf. Velocity amplitudes are given in cm/s after 8 days of simulation with a northwesterly wind. Positive velocities point northwestward. Section locations are shown on Figure 2(a).
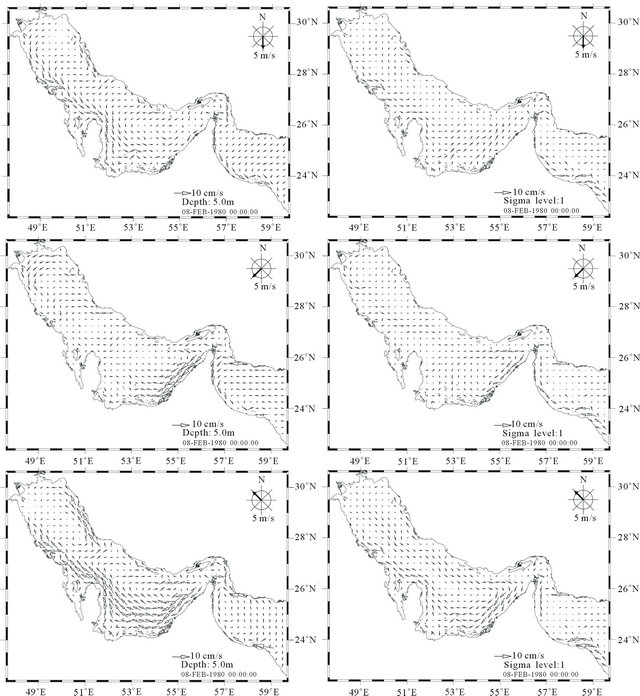
Figure 4. Surface (left) and bottom (right) currents after 8 days of simulation with northerly winds (top), northeasterly winds (middle), southeasterly winds (bottom).
friction) were achieved in long and narrow basins, comprising adjacent shallow and deeper areas, and forced by a wind blowing along the basin axis.
More recently, Bowyer [17] described a similar circulation in Lake Lough Mask, and compared in situ measurements with Csanady’s theoretical results.
To explain this situation where the current flows along the wind in shallow areas and opposite to it in deeper areas, Csanady developed the theory of a double gyre circulation, seen in the shape of the streamlines. This circulation balances the pressure force due to the free surface (−g ∂yζ) with the friction force by unit mass due to the wind (τ/(ρh)). This latter is stronger in shallow areas, where it dominates the former, and generates a downwind current. In the center of the basin (the deeper area), the free-surface effect dominates and leads to a return flow (upwind current).
Including the Coriolis force in this schematic experiment, does not substantially modify this circulation as was shown by [18] for Lake Ontario; in fact, Lake Ontario has geographical characteristics similar to those of the Gulf.
To illustrate this result, Figure 5 shows the transport due to a constant northwesterly wind for wind-forced only dynamics. The double gyre circulation is sketched. This circulation is close to that described by Csanady [16]. Bottom topography controls the location of the two gyres. The eastern cell is less marked due to the morphology of the Iranian coast. The shallow area is indeed quite narrow along this coast; this damps the intensity of the southeastward currents there, contrary to the situation along the southern coast of the Gulf.
4. River Plumes in the 3D Model
Schematic model simulations were performed to determine the interactions between the wind and the plume from Shatt-al-Arab in the northwestern part of the Gulf. The Shatt-al-Arab was represented by an inflow of freshwater (with null salinity) in the mesh corresponding to the position of the river outlet, northwest of the Gulf. The river transport was assumed constant and equal to 1400 m3/s. A uniform steady northwesterly wind with velocity 5 m/s was applied over the whole domain. The initial density field was uniform. The tidal forcing was taken into account in these simulations (except when stated).
4.1. Joint Effect of the Wind and of Tides
The resulting salinity and flow fields after 18 months of simulation are shown on Figures 6(a) and (b). A Demerliac filter removed the instantaneous variations due to the tides.
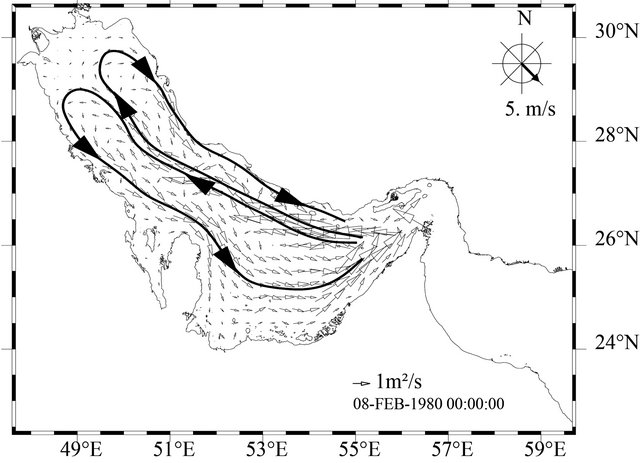
Figure 5. Mean flux (vertically averaged current) due to a northwesterly wind in the Gulf; the double gyre pattern is superimposed on the flux arrows.
At the surface, the Shatt-al-Arab plume expands downwind and tends to follow the Saudi Arabian coast (see Figure 6(a)). Only near the river outlet (in shallow areas), does the plume slightly head toward the Iranian coast. The currents are the fastest there, with velocities larger than 10 cm/s. Then, in regions deeper than 30 m, it veers towards the Arabian coast. After 18 months of simulation, waters with a −0.5 psu salinity anomaly have flown all along the Gulf ; this corresponds to a mean advection velocity of 2.4 cm/s. A −2 psu salinity anomaly is observed within 150 km from the river outlet.
At the bottom, the plume hugs the southern coast (see Figure 6(b)). The southward extent of this fresh plume is identical to that at the surface. But the very fresh waters (with −2 psu anomaly) remain localized in the northwestern end of the Gulf within 50 km from the outlet. The stratification is therefore strong in this narrow region and becomes weaker farther away from the outlet. There, the Richardson number decreases below a critical value, leading to an abrupt increase of vertical mixing which homogenizes the water column.
Under the influence of the wind, the fresh waters are advected along the coast towards the Straits of Hormuz. The bottom current velocities are of a few cm/s only and are stronger along the coasts.
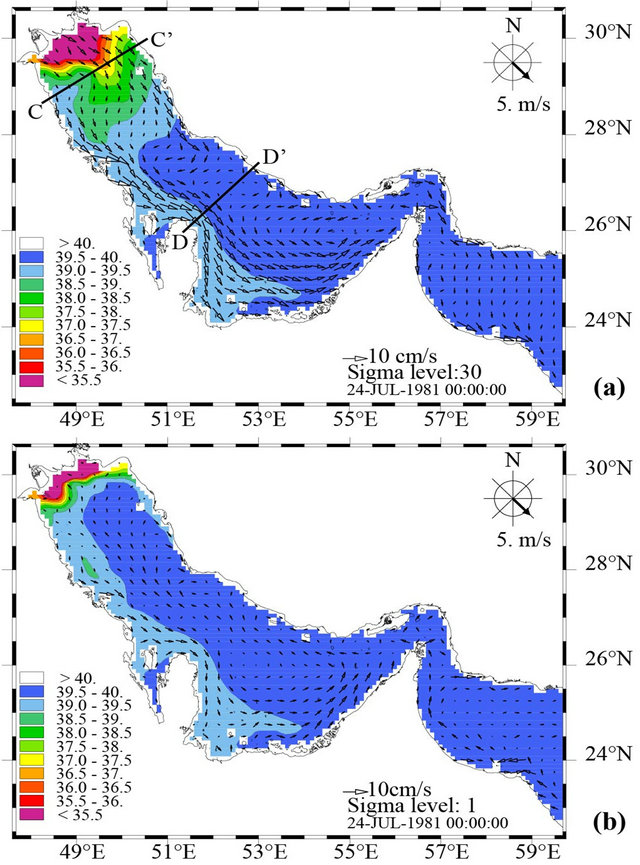
Figure 6. (a) Surface currents and salinity after 18 months of simulation forced by a uniform northwesterly wind; (b) Bottom currents and salinity under the same conditions. Instantaneous tidal currents was filtered out.
Figures 7(a) and (b) present the salinity on, and velocity of the current perpendicular to, sections CC’and DD’ across the Gulf. Section CC’ is located about 100 km away from the Shatt-al-Arab outlet. The salinity section shows a strong stratification in the upper 12 m of the water column, and across nearly the whole width of the Gulf (Figure 7(a)). On the southern coast, near Kuwait, the water is vertically homogeneous. The velocity section shows a two-layer structure with an upper flow to the southeast, intensified near the Iranian coast, and a northwestward deeper flow.
Section DD’ is located near the Qatar peninsula. The salinity section shows the presence of the plume near the southern coast, with a thickness of about 25 m, and southeastward currents reaching 8 cm/s (Figure 7(b)). Elsewhere, the salinity anomaly and currents are much weaker.
4.2. Separate Influence of the Wind and of Tides
Figure 8(a) presents the salinity and velocity fields for the plume forced only at the outlet, without wind nor tidal forcing, after 18 months of simulation. The plume spreads out in the northwestern end of the basin. Then, under the influence of the Coriolis force, it flows southward along the Arabian coast and spreads beyond Qatar. At the surface, the velocity reaches several cm/s while near the bottom a weak counter-current exists. Stratification is strong in the northern end of the Gulf while the flow along the southern coast has a more uniform vertical structure.
Figure 8(b) shows the evolution of the plume when the Gulf is forced by the tide only. The main difference with the previous simulation is the much shorter southward extent of the plume in this new simulation. Tide reduces the plume extent by mixing waters.
Figure 8(c) shows the evolution of the plume when the Gulf is forced by a northwesterly wind only. The plume takes a very different direction from the beginning of the flow: the plume first flows along the Iranian coast, then bifurcates southward to join the Arabian coast, and finally flows southeastward along that coast. At the bottom, the plume remains confined in the northwestern end of the Gulf. Therefore, stratification is very intense in this part. At the surface, the current is downwind in the shallow areas and is deflected to the right in the deeper areas. Near the bottom, an upwind current is again observed in the deepest parts of the Gulf.
4.3. Influence of Various Types of Winds
Finally, Figures 9(a)-(c) show the salinity and velocity fields at the surface and at the bottom for northerly, northeasterly and southeasterly winds.
All wind configurations with a northerly component lead to a stronger confinement of the plume along the Arabian coast. These situations also create a less stratified flow along this coast, under the action of the downwelling due to the wind. The plume along this coast is much fresher than for a northwesterly wind. On the con trary, a southeasterly wind confines the fresh water in the northwestern end of the Gulf, both at the surface and
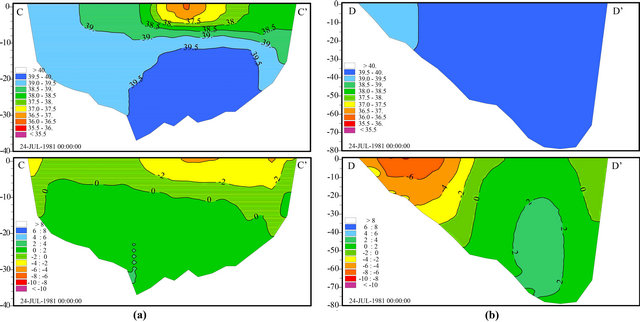
Figure 7. Section CC’, at the Northwestern end of the Gulf (a) and section DD’, near the Qatar peninsula (b), showing salinity (top) and perpendicular velocity (bottom, in cm/s) after 18 months of simulation forced by a northwesterly wind. Section locations are shown on Figure 6(a).
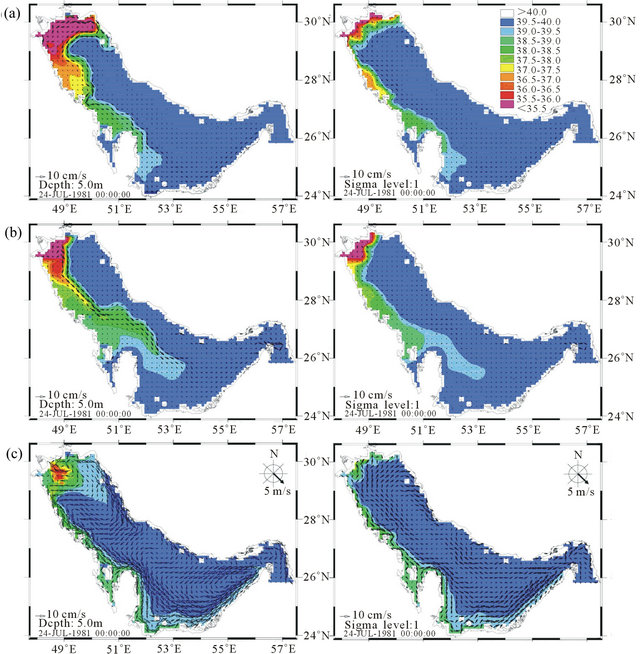
Figure 8. Salinity and flow field at the surface (left) and at the bottom (right) for (a) no wind nor tide; (b) no wind, tide only and (c) no tide, northwesterly wind only.
at the bottom.
5. Discussion and Conclusions
A 2D shallow-water model coupled with a 3D hydrostatic model was used to study the wind-driven circulation of the Persian Gulf in an idealized configuration (no initial density gradient, no thermohaline forcing at the surface) which excludes the reverse estuarine flow with the Gulf of Oman. In several cases, the tidal forcing was added, but the instantaneous tidal currents were filtered out. The evolution of the plume from the Shatt-al-Arab was also studied for various configurations of the forcing.
This schematic approach has yielded the following results:
- The wind-driven circulation for a northerly or a northwesterly wind is composed of two gyres, according to Csanady’s theory, a cyclonic one along the Arabian coast, and an anticyclonic one along the Iranian coast; the cyclonic gyre is the stronger of both; it should be noted that this circulation pattern is also that deduced from synoptic measurements in the Gulf by Reynolds [2]; these synoptic measurements included the trajectories of Lagrangian floats seeded in winter 1992 in the northwestern part of the Gulf;
- The density current generated by the fresh water inflow is much weaker than the wind-driven circulation; this wind-driven circulation is also stronger than
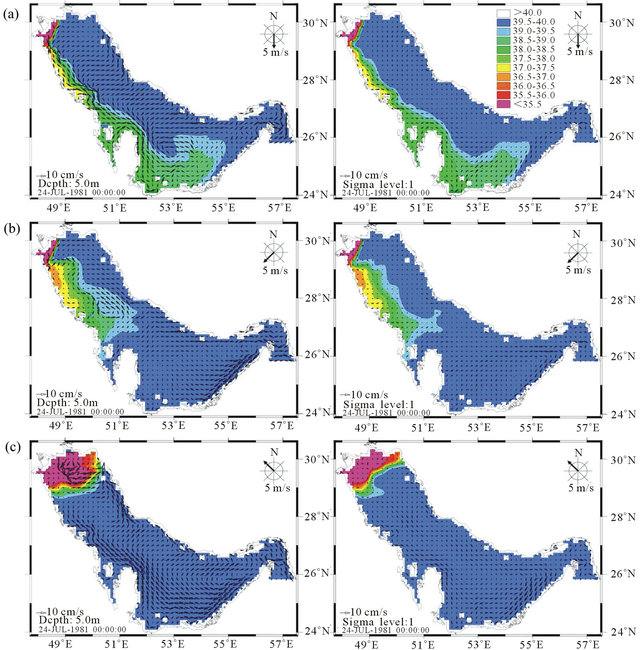
Figure 9. Salinity and flow field at the surface (left) and at the bottom (right) for northerly wind (a), northeasterly wind (b) and southeasterly wind (c).
the residual tidal currents;
- The shape of the basin and bottom topography play an important role in the control of the wind-driven circulation; due to the roughly rectangular shape of the basin, a double gyre exists for both northwesterly and southeasterly winds, in agreement with Csanady’s theory. The asymmetry in bottom topography can explain in part the asymmetry between the cyclonic and anticyclonic gyres of this circulation.
- For various directions of the wind (northerly and northeasterly), the Shatt-al-Arab plume propagates southeastward along the Arabian coast. But a northwesterly wind first advects the plume towards the Iranian coast, before it heads towards the Arabian coast.
- This change of direction can be explained by the existence of two southward currents in the northern end of the Gulf, one along the Iranian coast and one along the Kuwaiti and Arabian coasts. These currents influence the initial orientation of the plume.
- Descriptions of the plume in the literature [19,20] indicate that it flows along the Kuwaiti and the Arabian coasts, which is not observed for a northwesterly wind in our model. But experiments varying slightly the direction of the wind have shown a strong sensitivity of the initial orientation of the plume to the wind direction (e.g. for a north-northwesterly wind, the plume orientation is similar to that with a northerly wind but it is different from that with a northwesterly wind).
- Though the tidal currents are weak compared with the wind-driven currents, they have a dissipative influence on the plume and strongly limit its southward extent. The Shatt-al-Arab plume can also be severely reduced in extent when southeasterly winds blow.
The 3D circulation in the Gulf in the presence of thermohaline stratification and of forcing at the surface was also studied with the same numerical model [20]. The circulation pattern that we have obtained here for a constant northerly or a northwesterly wind, is also present when wind variability and ocean stratification are included in the model (see also [21,22]). This is all the more clear in spring when strong winds blow. Obviously, differences appear when density gradients and wind fluctuations are included. In particular, the cyclonic gyre is strengthened and amplified in the eastern part of the Gulf, by a density gradient between waters flowing in and out of the Straits of Hormuz. Wind and density variations in space and time can also lead to the generation of smaller-scale features which are then superimposed on this general circulation pattern. The details of our complete 3D study will be presented in a forthcoming paper.
6. Acknowledgements
The authors were funded by SHOM (French Navy Hydrographic and Oceanographic Service), by IFREMER (French Institute for Marine Research and Development), by the MNHN (Museum National d’Histoire Naturelle) and by UBO (Universite de Bretagne Occidentale). XC thanks DGA (Defence Research Agency) for support under REI program COMINO.
REFERENCES
- K. Grasshoff, “Review of Hydrographical and Productivity Conditions in the Gulf Region,” UNESCO Technical Papers in Marine Science, Paris, 1976.
- R. M. Reynolds, “Physical Oceanography of the Gulf, Strait of Hormuz and the Gulf of Oman—Results from the Mt Mitchell Expedition,” Marine Pollution Bulletin, Vol. 27, 1993, pp. 35-59. doi:10.1016/0025-326X(93)90007-7
- G. Schott, “Ozeanographie und Klimatologie des Persischen Golfes und des Golf Von Oman” Annalen der Hydrographic und Maritimen Meteorologie, Vol. 46, 1918, pp. 1-46.
- P. G. Brewer, A. P. Fleer, S. Kadar, D. K. Shafer and C. L. Smith, “Chemical Oceanography Data from the Persian Gulf and the Gulf of Oman,” Woods Hole Oceanographic Institution, Woods Hole, 1978.
- K. Al Hajri, “The Circulation of the Arabian (Persian) Gulf: A Model Study of Its Dynamics,” The Catholic University of America. Washington DC, 1990.
- D. W. Privett, “Monthly Charts of Evaporation from the North Indian Ocean, Including the Red Sea and the Persian Gulf,” Quarterly Journal of the Royal Meteorological Society, Vol. 85, No. 366, 1959, pp. 424-428. doi:10.1002/qj.49708536614
- A. M. Meshal and H. M. Hassan, “Evaporation from the Coastal Waters of the Central Part of the Gulf,” Arab Gulf Journal of Scientific Research, Vol. 4, 1986, pp. 649-655.
- F. Ahmad and S. A. R. Sultan, “Annual Mean Surface Heat Fluxes in the Arabian Gulf and the Net Heat Transport through the Strait of Hormuz,” Atmosphere Ocean, Vol. 29, No. 1, 1990, pp. 54-61. doi:10.1080/07055900.1991.9649392
- R. Proctor, R. A. Flather and A. J. Elliott, “Modeling Tides and Surface Drift in the Arabian Gulf: Application to the Gulf Oil Spill,” Continental Shelf Research, Vol. 14, No. 5, 1994, pp. 531-545.
- P. Lazure and J. C. Salomon, “Coupled 2D and 3D Hydrodynamics,” Oceanologica Acta, Vol. 14, No. 2, 1991, pp. 175-180.
- S. Pous, X. Carton and P. Lazure, “A Process Study of the Tidal Circulation in the Persian Gulf,” Open Journal of Marine Science, Vol. 2, No. 4, 2012, pp. 131-140.
- P. Lazure and F. Dumas, “An External-Internal Mode Coupling for a 3D Hydrodynamical Model for Applications at Regional Scale (MARS),” Advances in Water Resources, Vol. 31, No. 2, pp. 233-250. doi:10.1016/j.advwatres.2007.06.010
- A. F. Blumberg and G. L. Mellor, “A Description of a Three Dimensional Ocean Circulation Model,” In: N. S. Heaps, Ed., Three Dimensional Coastal Ocean Models, Coastal and Estuarine Sciences, Washington DC, 1987, pp. 1-16.
- J. Smagorinsky, “General Circulation Experiments with the Primitive Equations—I. The Basic Experiments,” Monthly Weather Review, Vol. 91, No. 3, pp. 99-165. doi:10.1175/1520-0493(1963)091<0099:GCEWTP>2.3.CO;2
- A. Demerliac, “Le Niveau de la Mer: Calcul des Niveaux Moyens Journaliers,” Annales Hydrographiques, Vol. 741, 1974, pp. 49-57.
- G. T. Csanady, “Circulation in the Coastal Ocean. (Section 4.1.1),” D. Reidel Publishing Company, Boston, 1982.
- P. A. Bowyer, “Topographically Controlled Circulation and Mixing in a Lake,” Journal of Geophysical Research Oceans, Vol. 106, No. C4, 2001, pp. 7065-7080.
- D. B. Rao and T. S. Murty, “Calculation of the SteadyState Wind-Driven Circulation in Lake Ontario,” Archiv für Meteorologie, Geophysik und Bioklimatologie, Vol. 19, No. 2, 1970, pp. 195-210. doi:10.1007/BF02249005
- W. E. Johns, G. A. Jacobs, J. C. Kindle, S. P. Murray and M. Carron, “Arabian Marginal Seas and Gulfs,” University of Miami, Miami, 2000.
- S. Pous, “Dynamique Océanique dans les Golfes Persiques et d’Oman,” PhD Thesis, Université de Bretagne Occidentale, Brest, 2005.
- J. Kämpf and M. Sadrinasab, “The Circulation of the Persian Gulf: A Numerical Study,” Ocean Science, Vol. 2, 2006, pp. 27-41. doi:10.5194/os-2-27-2006
- F. Yao and W. E. Johns, “A HYCOM Modeling Study of the Persian Gulf,” Journal of Geophysical Research, Vol. 115, No. C11, 2010. doi:10.1029/2009JC005781