Open Journal of Marine Science
Vol.2 No.2(2012), Article ID:18902,8 pages DOI:10.4236/ojms.2012.22006
Variations in Swells along Eastern Arabian Sea during the Summer Monsoon
Ocean Engineering, National Institute of Oceanography (Council of Scientific & Industrial Research), Dona Paula, India
Email: sanil@nio.org
Received November 26, 2011; revised January 20, 2012; accepted January 28, 2012
Keywords: Seas; Swells; Wind Waves; Arabian Sea; Mixed Sea State; Wave Spectrum
ABSTRACT
A study was carried out to find the variation in wave characteristics along the eastern Arabian Sea and the influence of swells in the nearshore waves at 3 locations during summer monsoon in 2010. Percentage of swells in the measured waves was 75% to 79% at the locations with higher percentage of swells in the northern portion of Arabian Sea compared to that at the southern side. The significant wave height up to 4.7 m and maximum wave height up to 7.4 m was observed. The wave height was increasing from south to north with the average significant wave height at the northern location 20% more than that at the southern location due to the increase in the swell height. Waves having spectral peak period less than 6 s were not present during the summer monsoon period. There was no change in the average value of wave statistical parameters for data collected at 1/2, 3, 6, 12 and 24 h interval.
1. Introduction
Information on swells is required for navigation and operation of marine facilities. The data collected during the severe weather conditions form the design parameters for marine facilities. The presence of local wind sea and swell components propagating from distant storms can be identified by studying wave energy spectra. When seas and swells are present the wave energy spectrum will be multi-peaked with peaks corresponding to seas and swells. Along the Indian coast, about 60% of the wave spectra observed was multi-peaked and they were mainly single peaked when the significant wave height (Hm0) was more than 2 m [1]. The multi-peaked spectra observed were mainly swell dominated with average value of the ratio of the two spectral peaks around 0.6 and the average value of the difference between peak frequencies around 0.09 Hz. Waves in shallow water location off the west coast of India during the onset of summer monsoon [2] and in shallow water location in the north Indian Ocean during the summer monsoon [3] were mainly swells arriving from south and south-west direction.
The waves in the north Indian Ocean will be high during summer monsoon period (June to August) and the highest measured Hm0 was 6 m [4]. Information on variations in nearshore wave parameters along the west coast of India is not known and most of the earlier studies were based on the waves measured at a single location at a specified time. Hence a study was carried out to find out the variations in wave parameters along the eastern Arabian Sea covering a distance of 850 km and the influence of swells in nearshore waves by measuring waves simultaneously at 3 locations during June to August 2010 covering the summer monsoon period.
2. Study Area
Three locations Honnavar, Ratnagiri and Muldwarka situated in the eastern Arabian Sea were selected for the study. The southernmost measurement location is off Honnavar and the northern most point is Muldwarka (Figure 1). The distance between Honnavar and Ratnagiri is around 350 km and the distance between Ratnagiri and Muldwarka is around 500 km. The depth contours of 20, 50, 100 and 200 m occurs at 10, 30, 75 and 100 km off Honnavar. The coastline at Honnavar is inclined 17˚ to the west from the true north and at Ratnagiri, the average coastal inclination is 15˚ to the west. Off Ratnagiri, depth contours of 20, 50, 100 and 200 m occurs at 6, 25, 105 and 125 km. Along the study area, the coast is exposed to seasonally reversing monsoon winds, with winds from the southwest direction during the southwest (summer) monsoon period (June to September) and from the northeast during the northeast (winter)
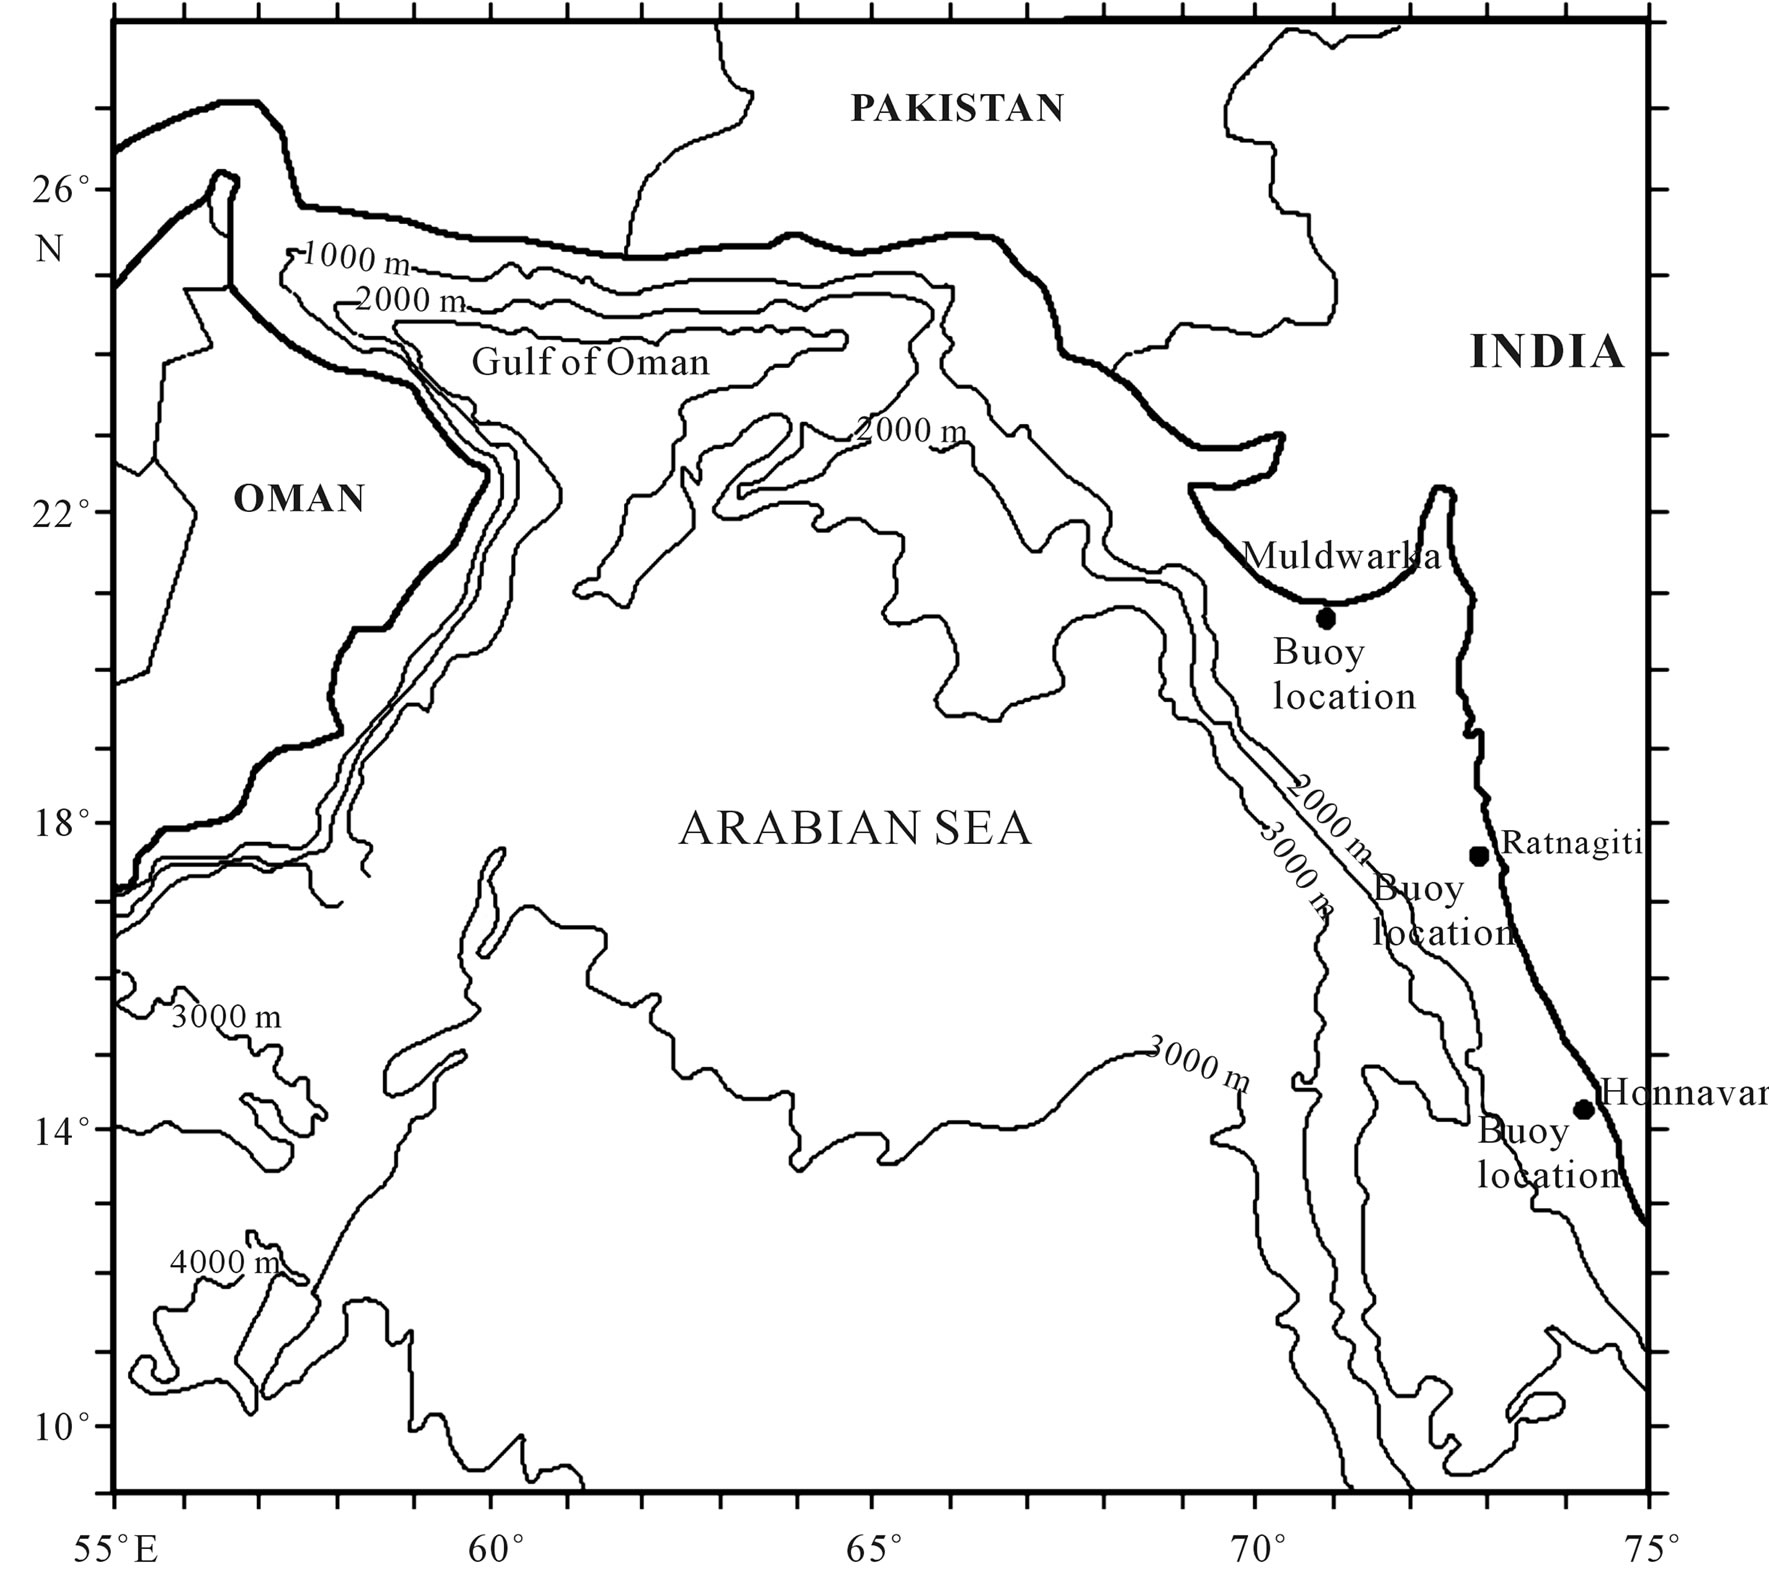
Figure 1. Study area with locations where the wave data was collected.
monsoon period (October to January). The southwest monsoon winds are strong and the annual rainfall in the southern part is around 3 m. Tides in the region are mixed and are predominantly semidiurnal and the average tidal range at Karwar which is 70 km north of Honnavar is 1.58 m during spring tide and 0.72 m during neap tide. The average tidal range at Veeraval which is 37 km west of Muldwarka is 1.61 m during spring tide and 0.73 m during neap tide. The tidal conditions at Honnavar and Muldwarka are similar. At Ratnagiri the average spring tidal range is about 1.8 m and the neap tidal range is 0.9 m.
3. Materials and Methods
The waves at 3 locations (Table 1) along the west coast of India in the eastern Arabian Sea were measured using the Datawell directional waverider buoy [5]. The measurements were carried out during 1 June to 31 August 2010 during the summer monsoon period. The data were recorded for 30 minutes duration at a frequency of 1.28 Hz at every half an hour during the measurement period. A total of 4416 data records were made during the measurement period at each location. The wave spectrum was obtained through Fast Fourier transform (FFT). FFT of 6 series, each consisting of 256 measured vertical elevations of the buoy data, were added to obtain the spectra. The high frequency cut off was at 0.58 Hz and the resolution was 0.005 Hz. The significant wave height (Hm0) and the mean wave period (Tm02) were obtained from the spectral analysis (Equations (1) and (2)). The period corresponding to the maximum spectral energy density is referred as spectral peak period (Tp) and is estimated from the wave spectrum. Other parameters obtained were spectral narrowness parameter (n) [6] and the maximum spectral energy. Zero-crossing analysis of the surface elevation time series was used to estimate maximum wave height (Hmax). Mean wave direction (Dp) is estimated based on circular moments [7].
Significant wave height (Hm0) =  (1)
(1)
Mean wave period (Tm02) =  (2)
(2)
where mn is the nth order spectral moment and is given by 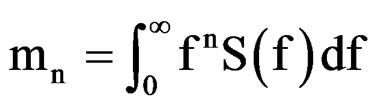 n = 0 and 2. S(f) is the spectral energy density at frequency f.
The wind seas and swells from the measured wave data were separated through the proposed a 1-D separation algorithm [8], on the basis of the assumption that, the energy at the peak frequency of a swell system cannot be higher than the value of a PM spectrum with the same peak frequency. It calculates the ratio (γ*) between the peak energy of a wave system and the energy of a PM spectrum at the same frequency. If γ* is above a threshold value of 1, the system is considered to represent wind sea, else it is taken to be swell. Wind sea and the swell parameters were computed by integrating over the respective spectral parts.
4. Results and Discussions
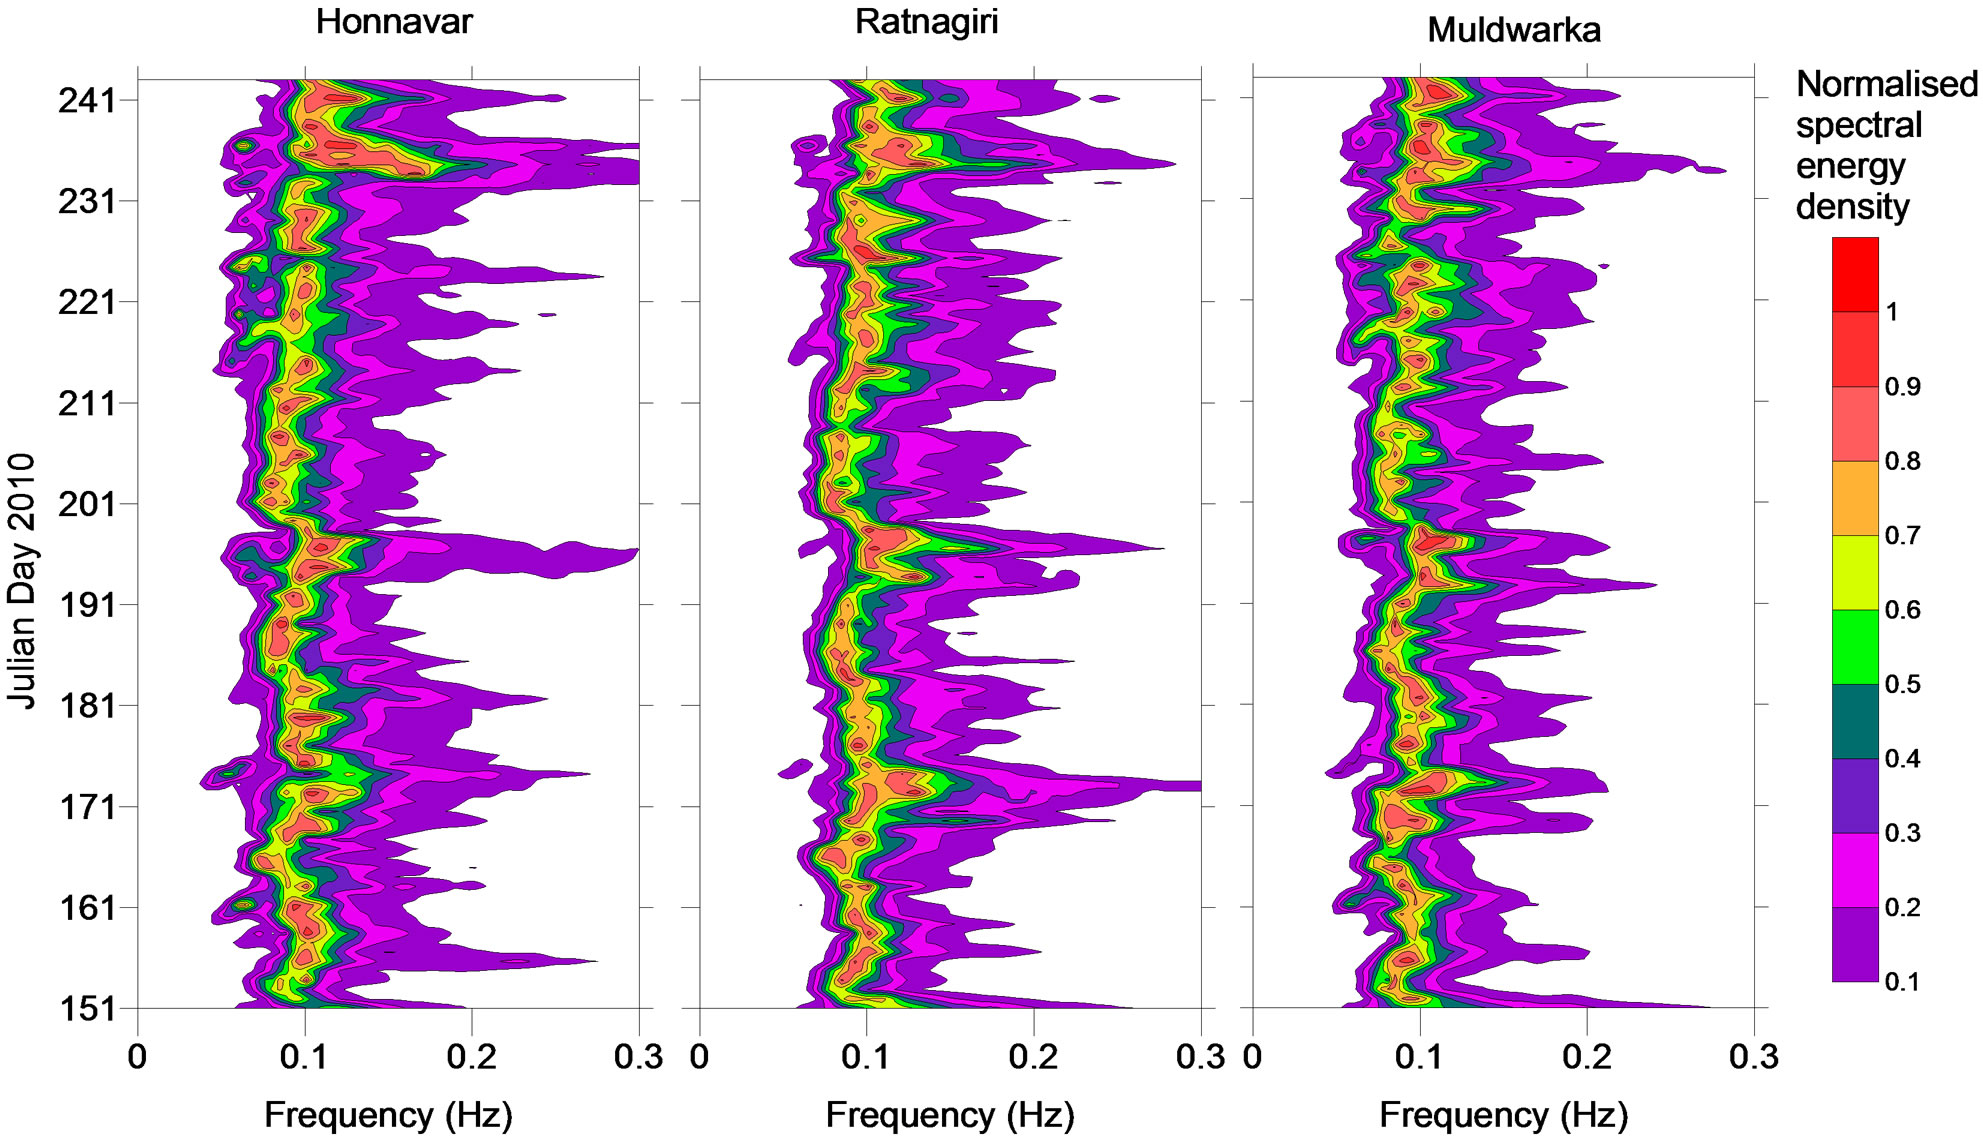
The plot of spectral energy density with frequency will indicate the contribution of individual waves having different wave periods. Since during the summer monsoon, the wave spectral energy density varied from 0.8 to 40.1 m2/Hz, the contour plots of normalized wave spectral energy density is presented. Contour plots of the normalized wave spectral energy density at the measurement locations (Figure 2) show the predominance of swells. The spectral peak was around 0.08 to 0.1 Hz (12 to 10 s) during 72% of the time at all the locations. Since the wave spectra were multi peaked consisting of swells and locally generated waves (wind seas), the swell components and the seas were separated and the wave parameters of sea and swell are presented in Table 2. Waves were high during July compared to June and August. Average Hm0 due to swell at 3 locations was 1.6 to 2.1 m and that due to wind sea was 0.9 to 1.1 m. Hm0 up to 4.7 m and Hmax up to 7.4 m was recorded during the measurement period. Hm0 was more than 2 m during 40, 50 and 66% of time at Honnavar, Ratnagiri and Muldwarka. Percentage of swell energy in the total wave energy was 75% to 79% at the locations with higher percentage of swells in the northern side compared to that at the southern side. Increase in average Hm0 was 10% from Honnavar to Ratnagiri and was 10% from Ratnagiri to Muldwarka. The wave height was increasing from south to north with the average Hm0 at the northern location 20% more than that at the southern location and the increase was mainly due to the increase in the swell height. The study shows that the wave field along the eastern Arabian Sea are influenced by waves generated elsewhere. A noteworthy feature in the present study is the dominance of swells (~75% to 79%) during the monsoon season. During this season, dominance of seas is expected along the west coast of India due to the prevailing high winds. The reason for dominance of swells is due to the fact that
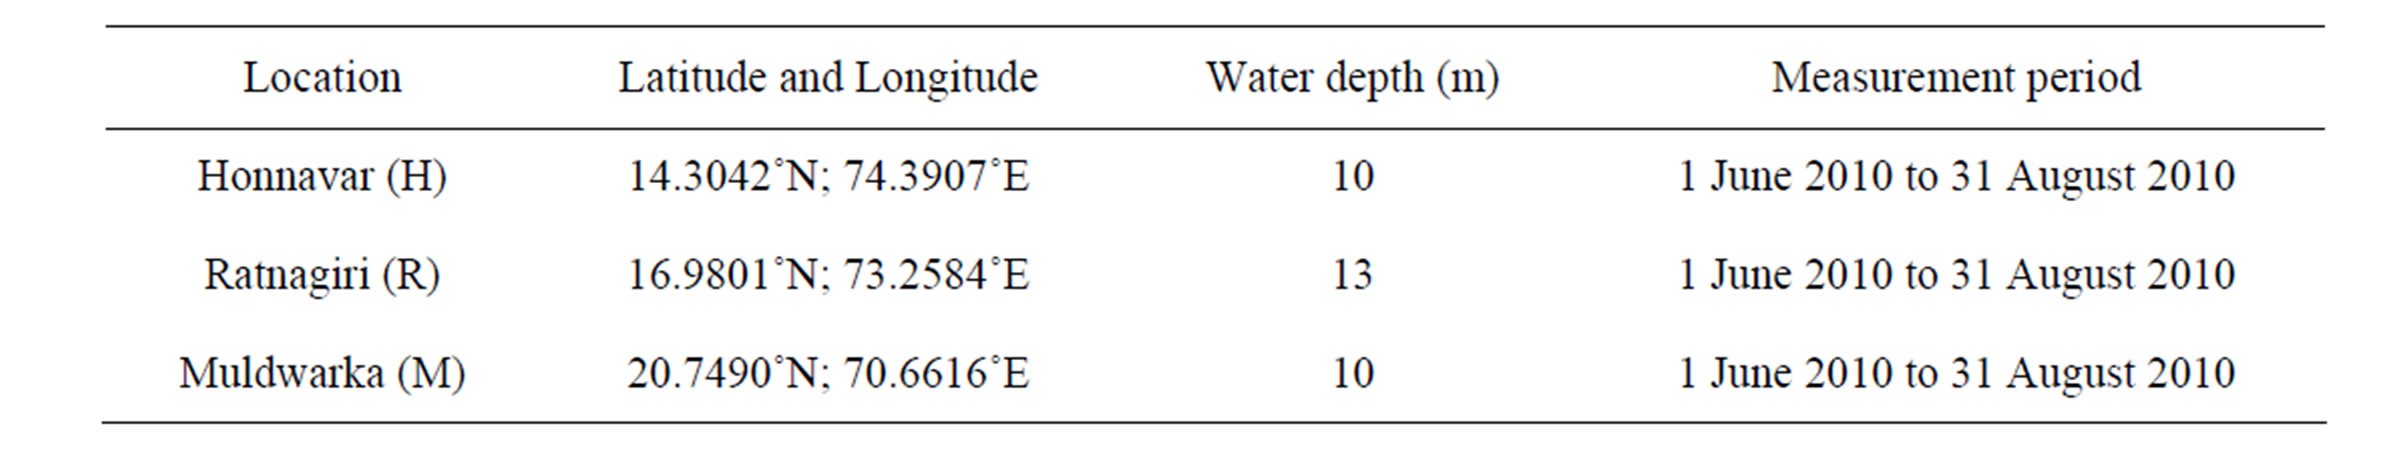
Table 1. Measurement locations and the water depth.
 (a) (b) (c)
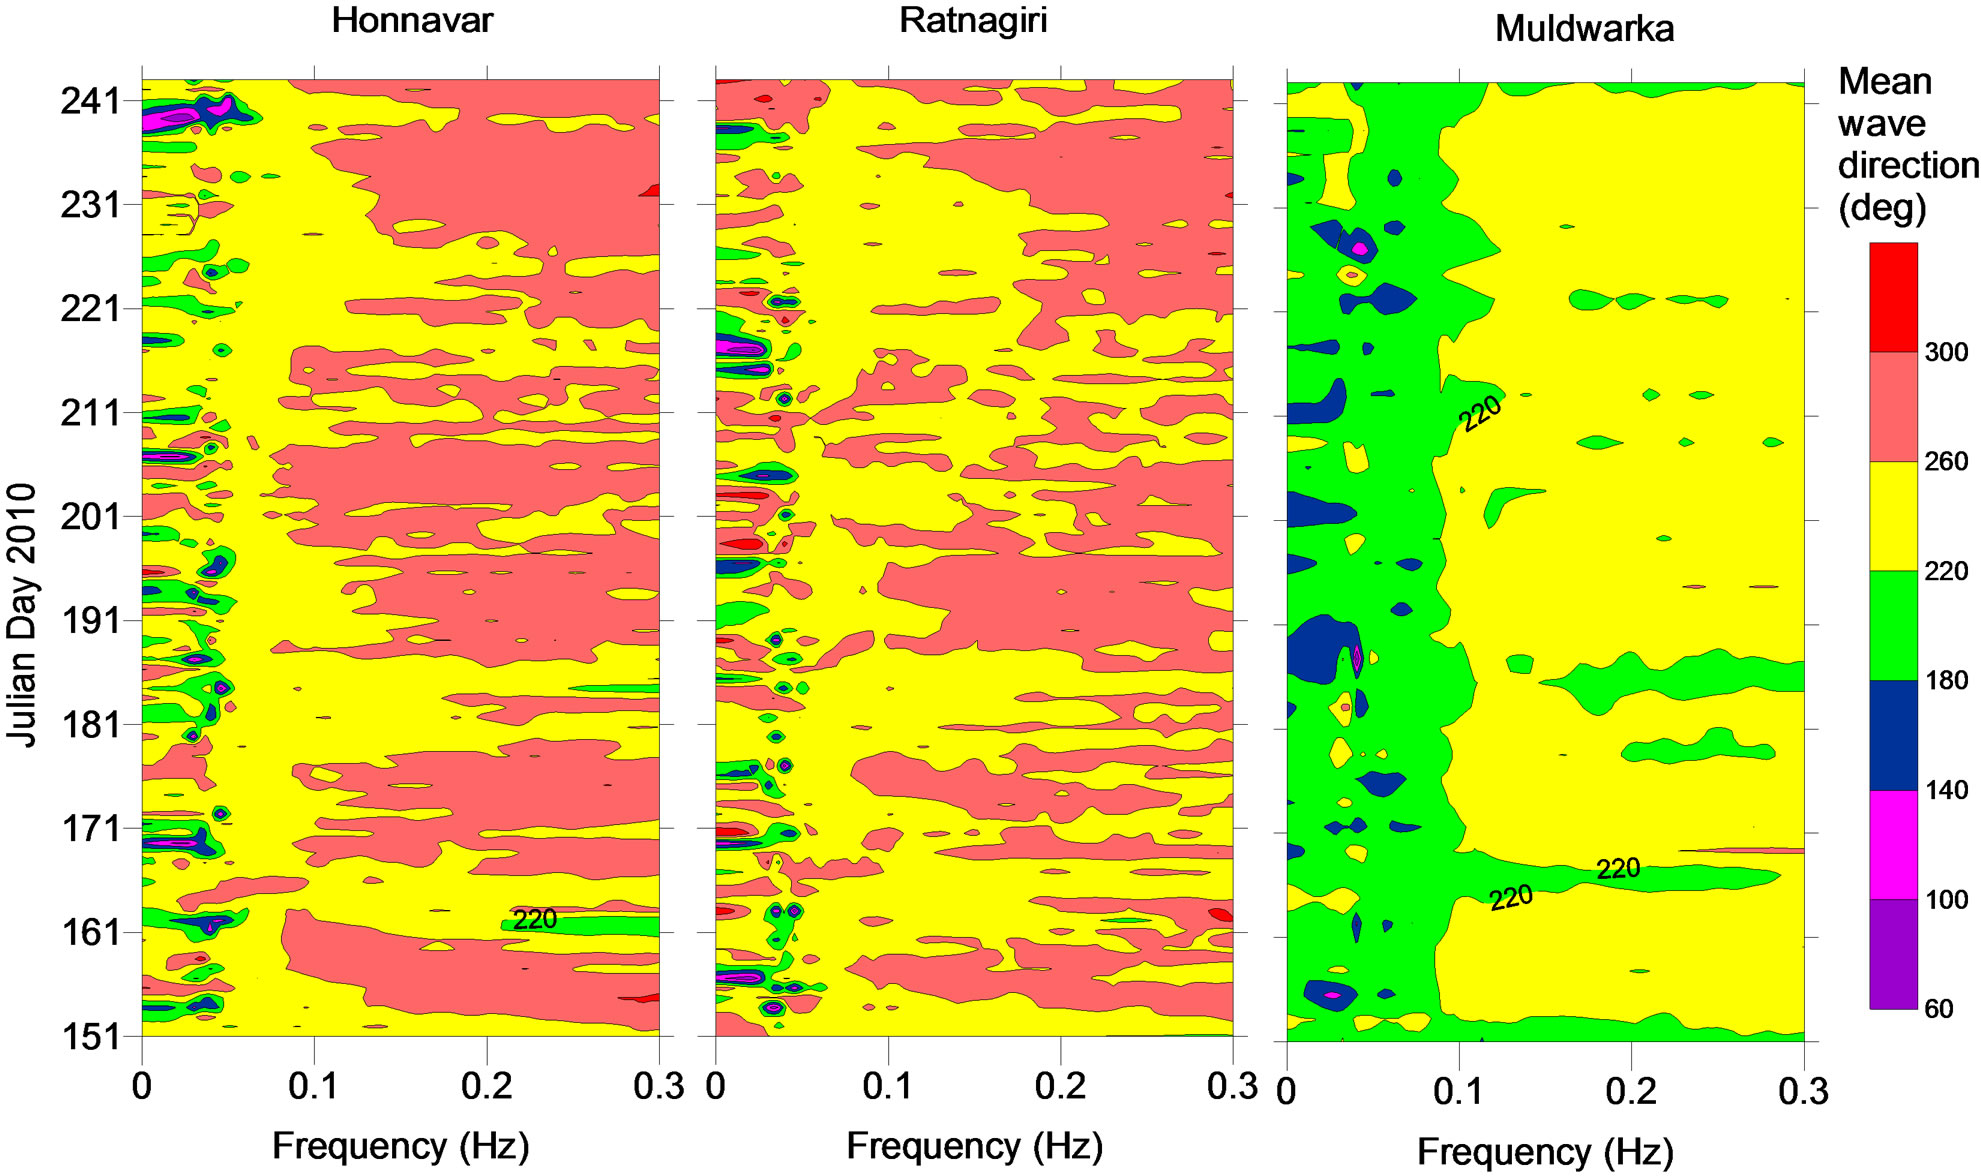
Figure 2. Contour plot of normalized spectral energy density at (a) Honnavar (b) Ratnagiri and (c) Muldwarka during summer monsoon.
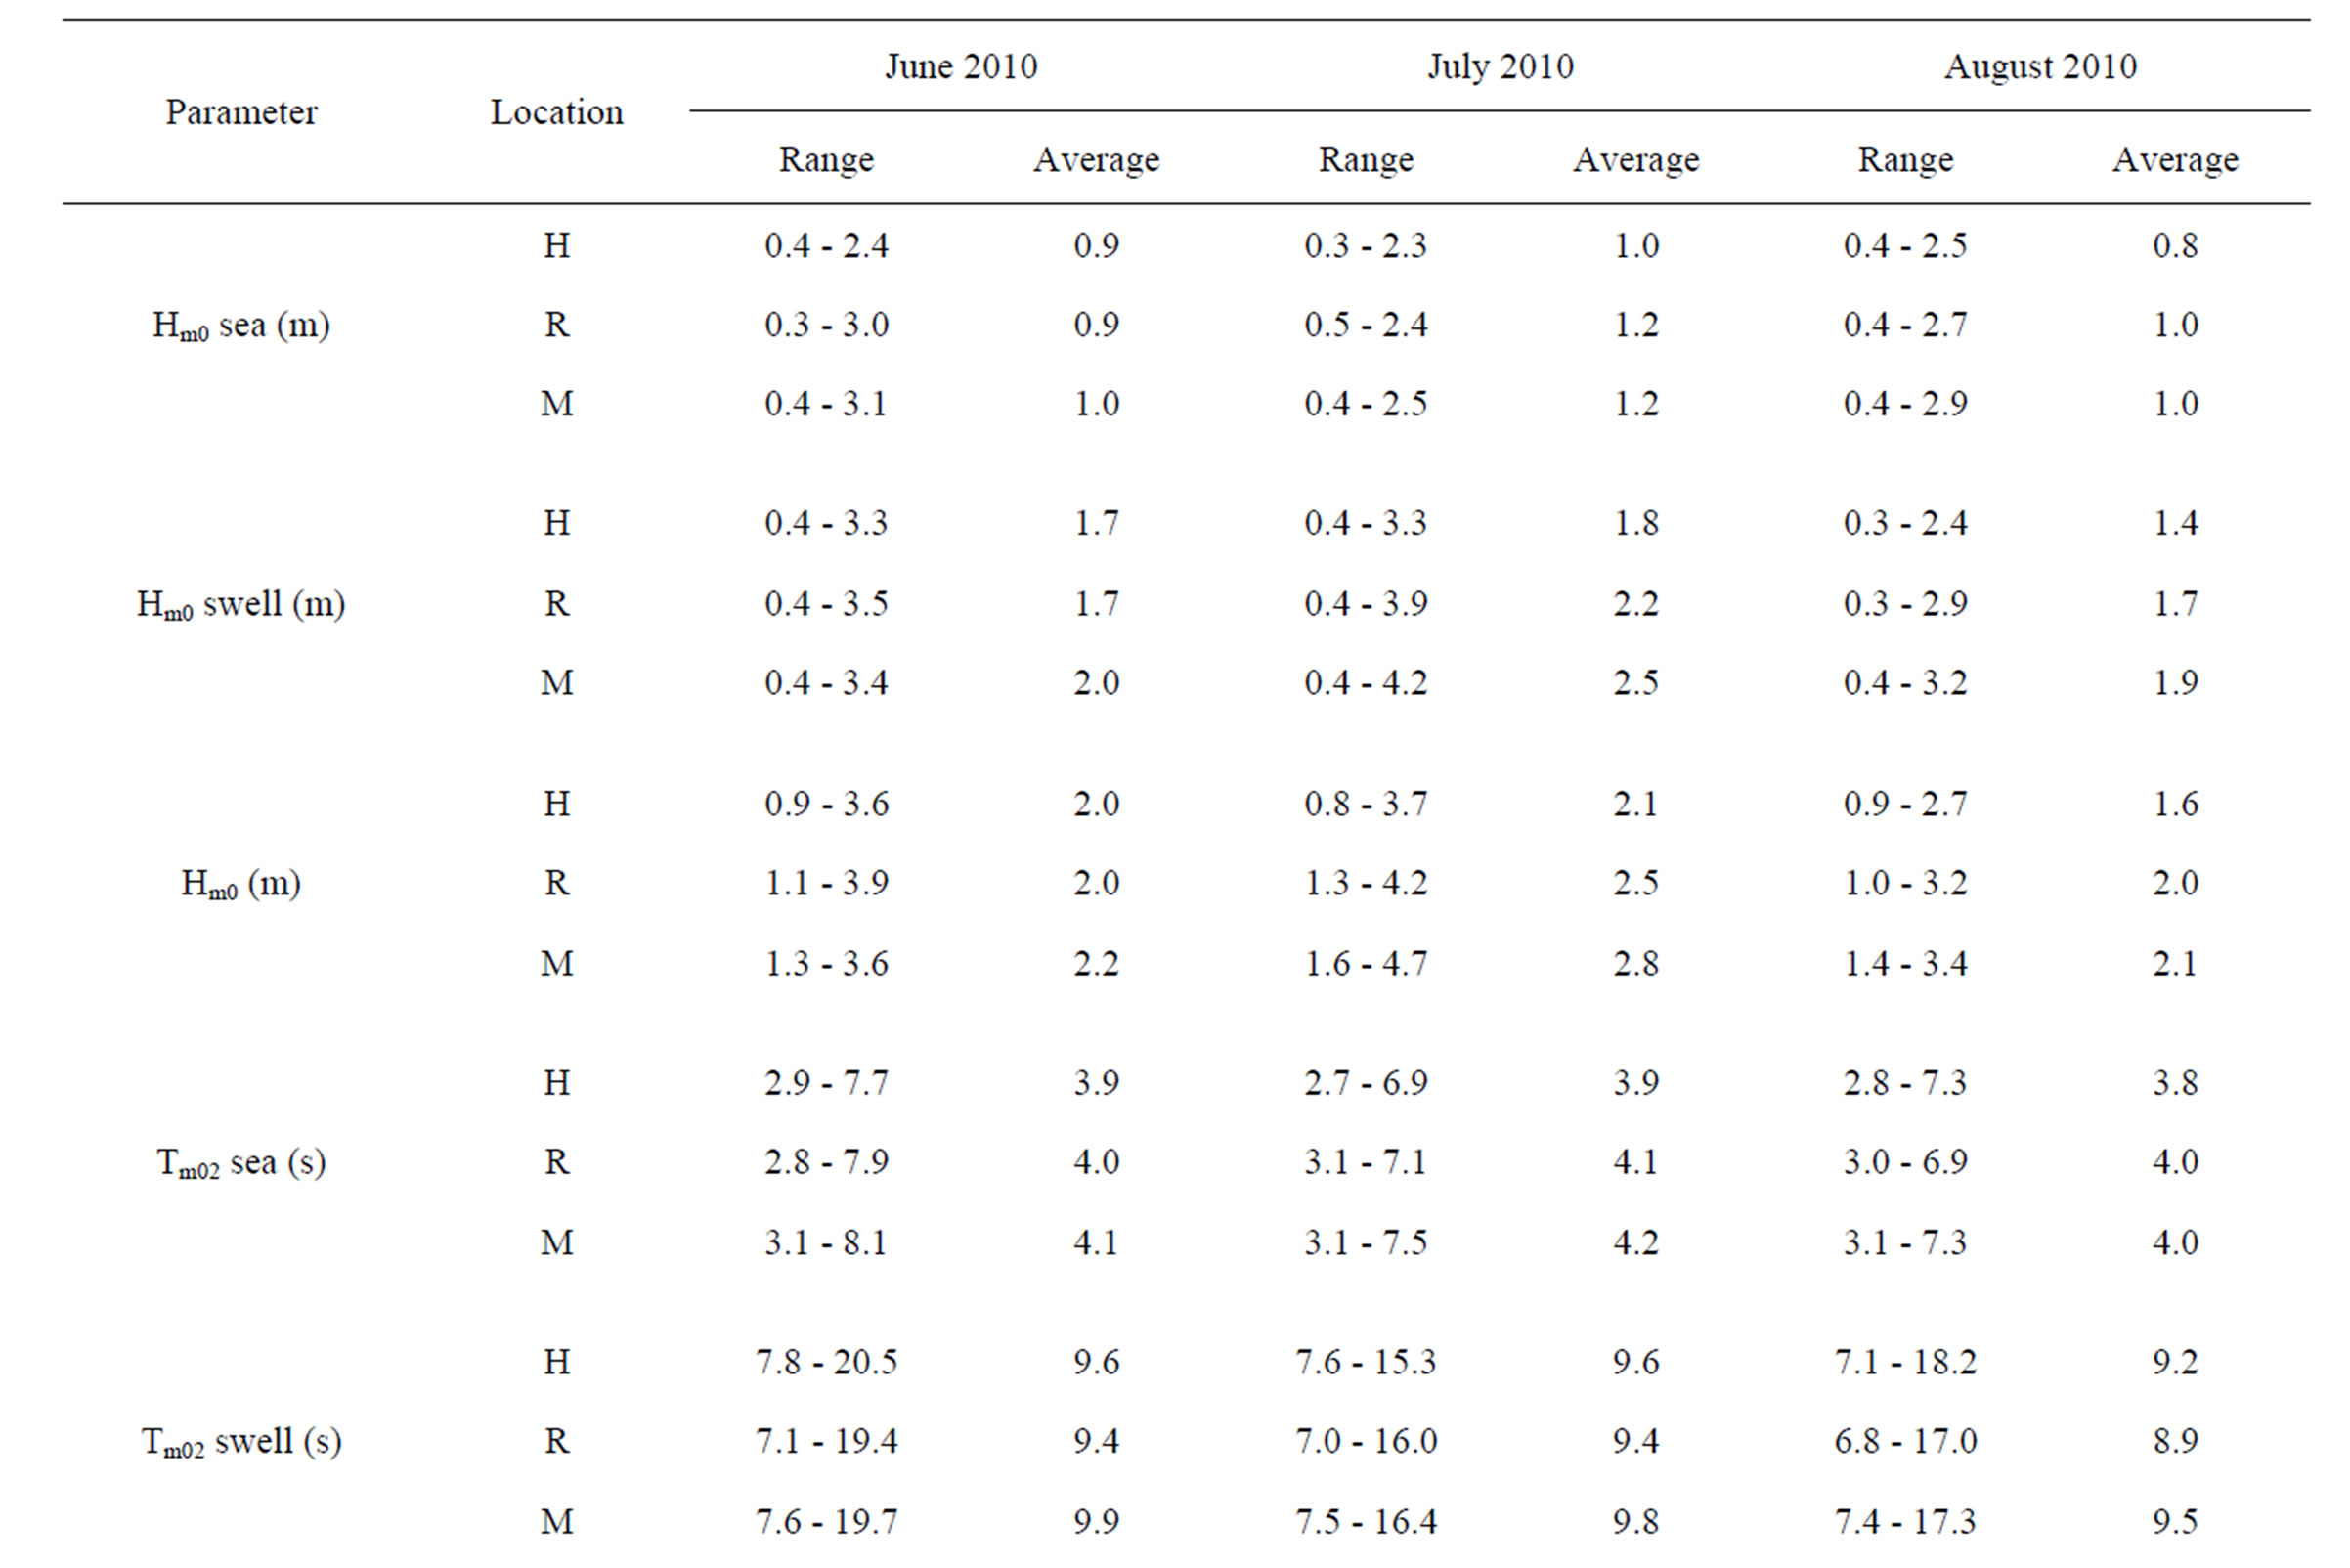
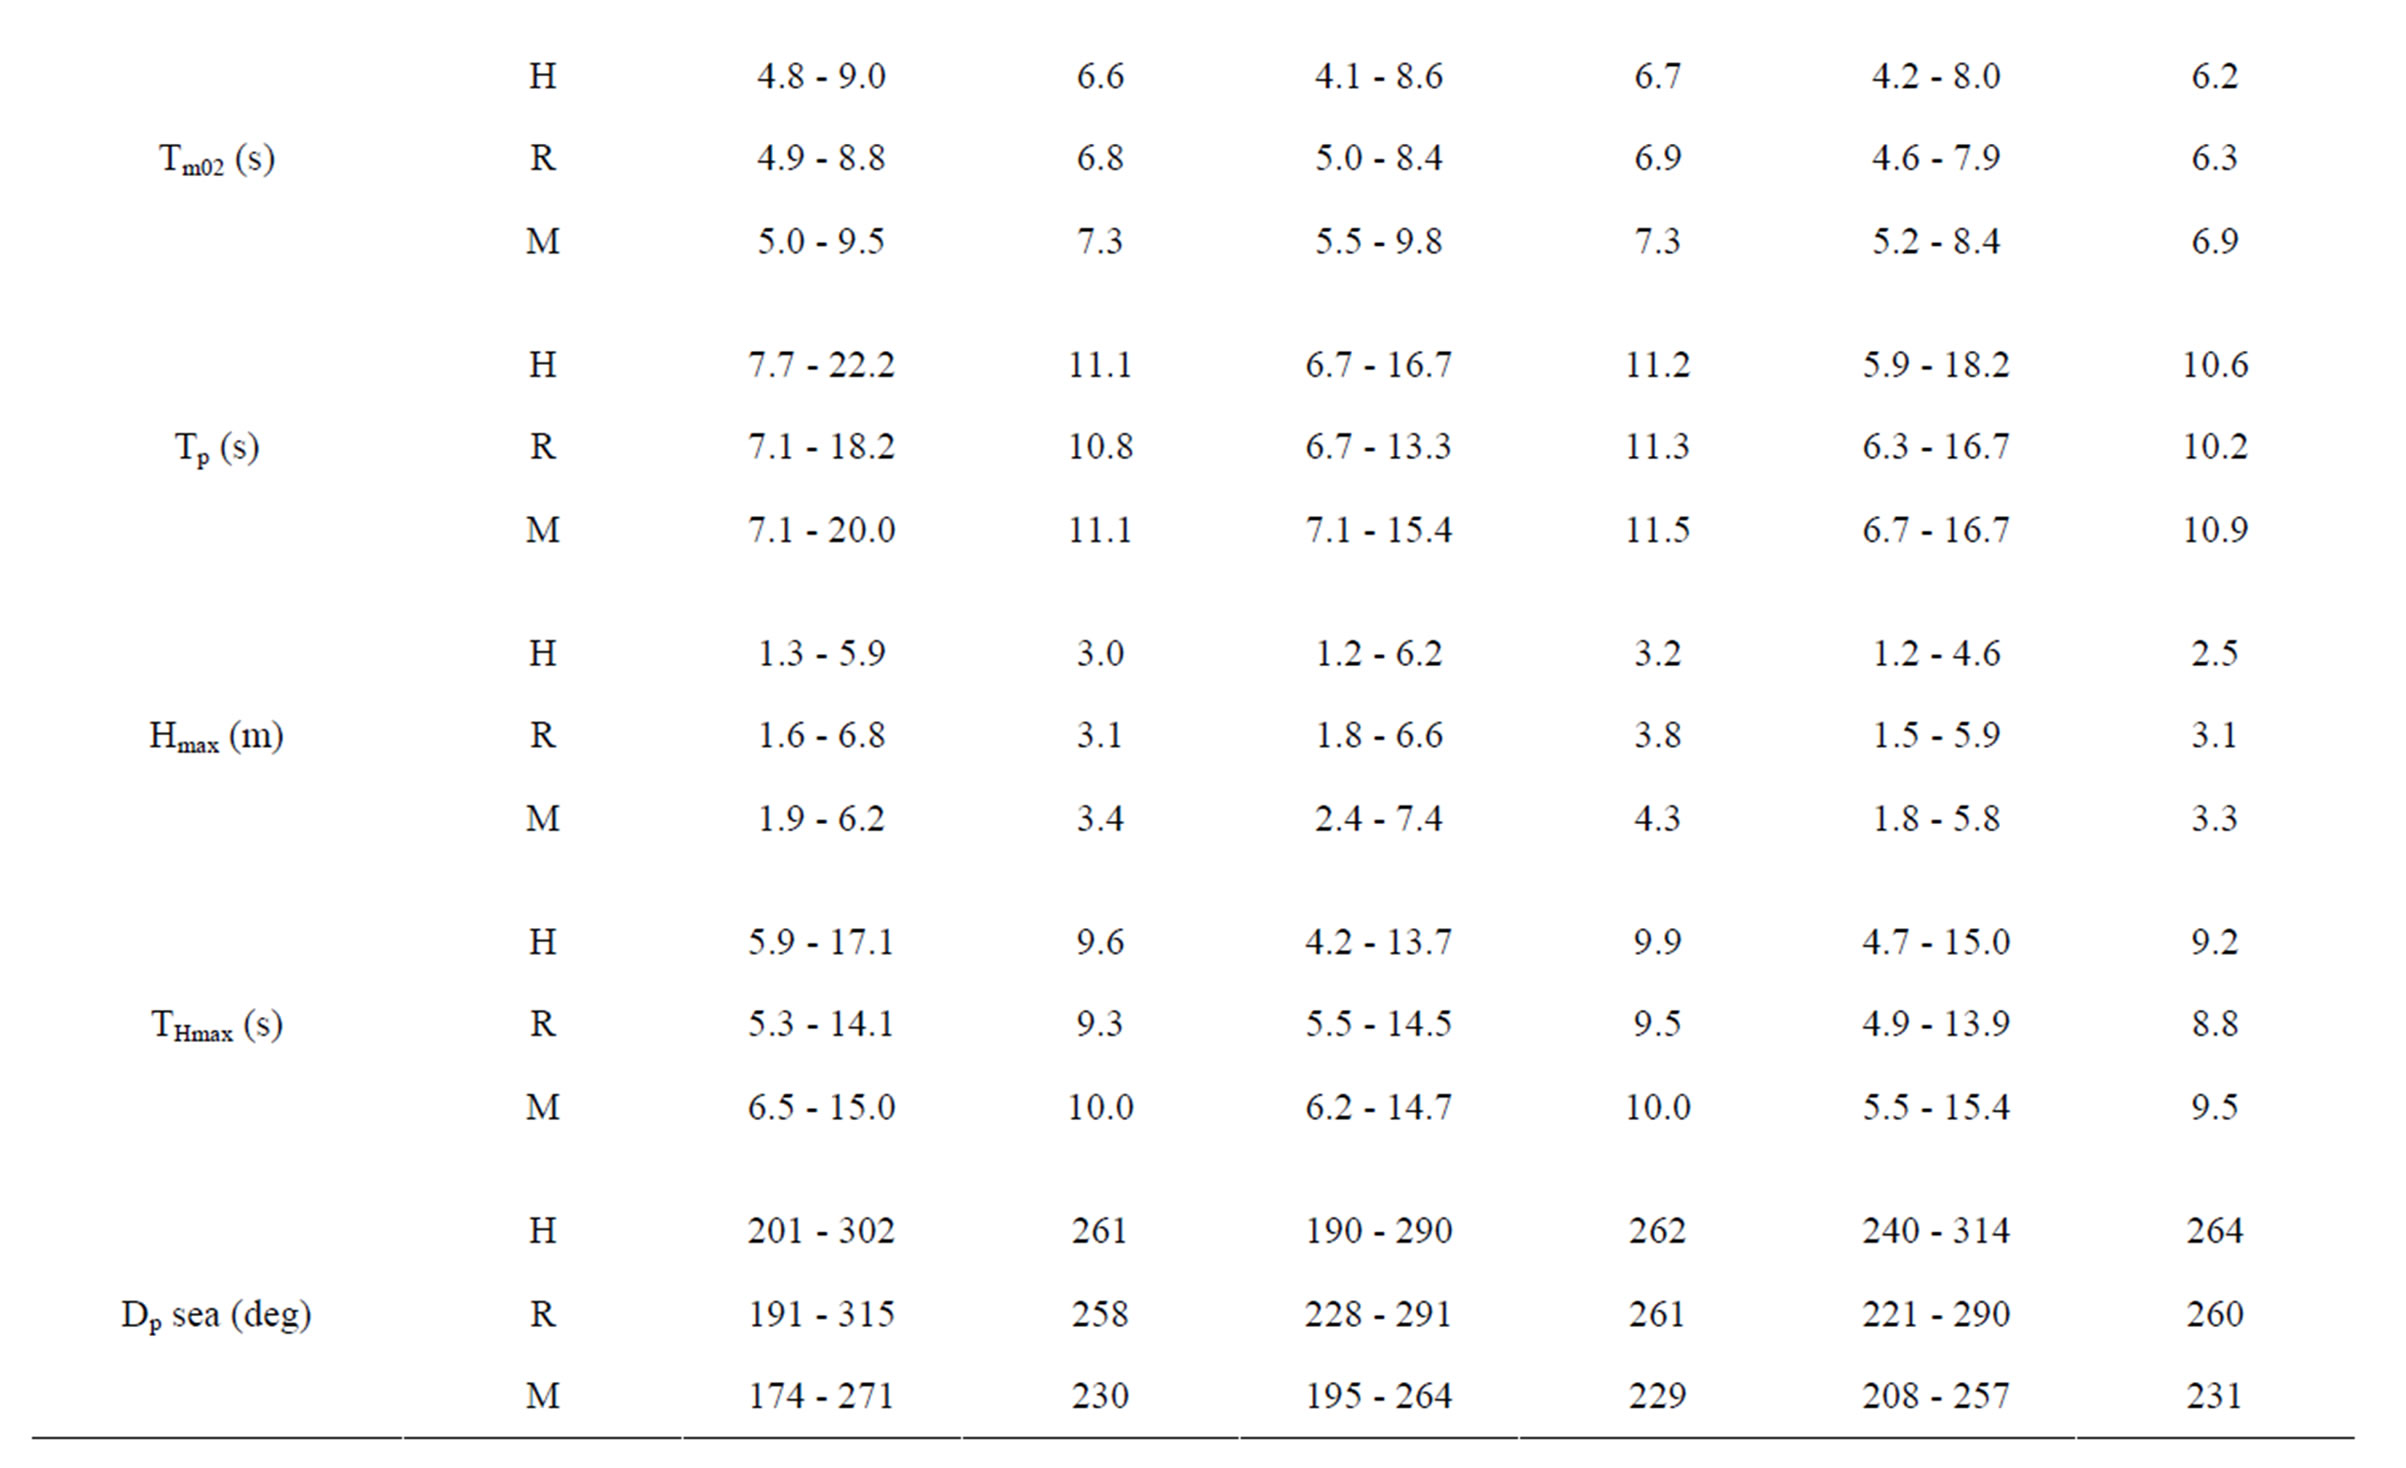
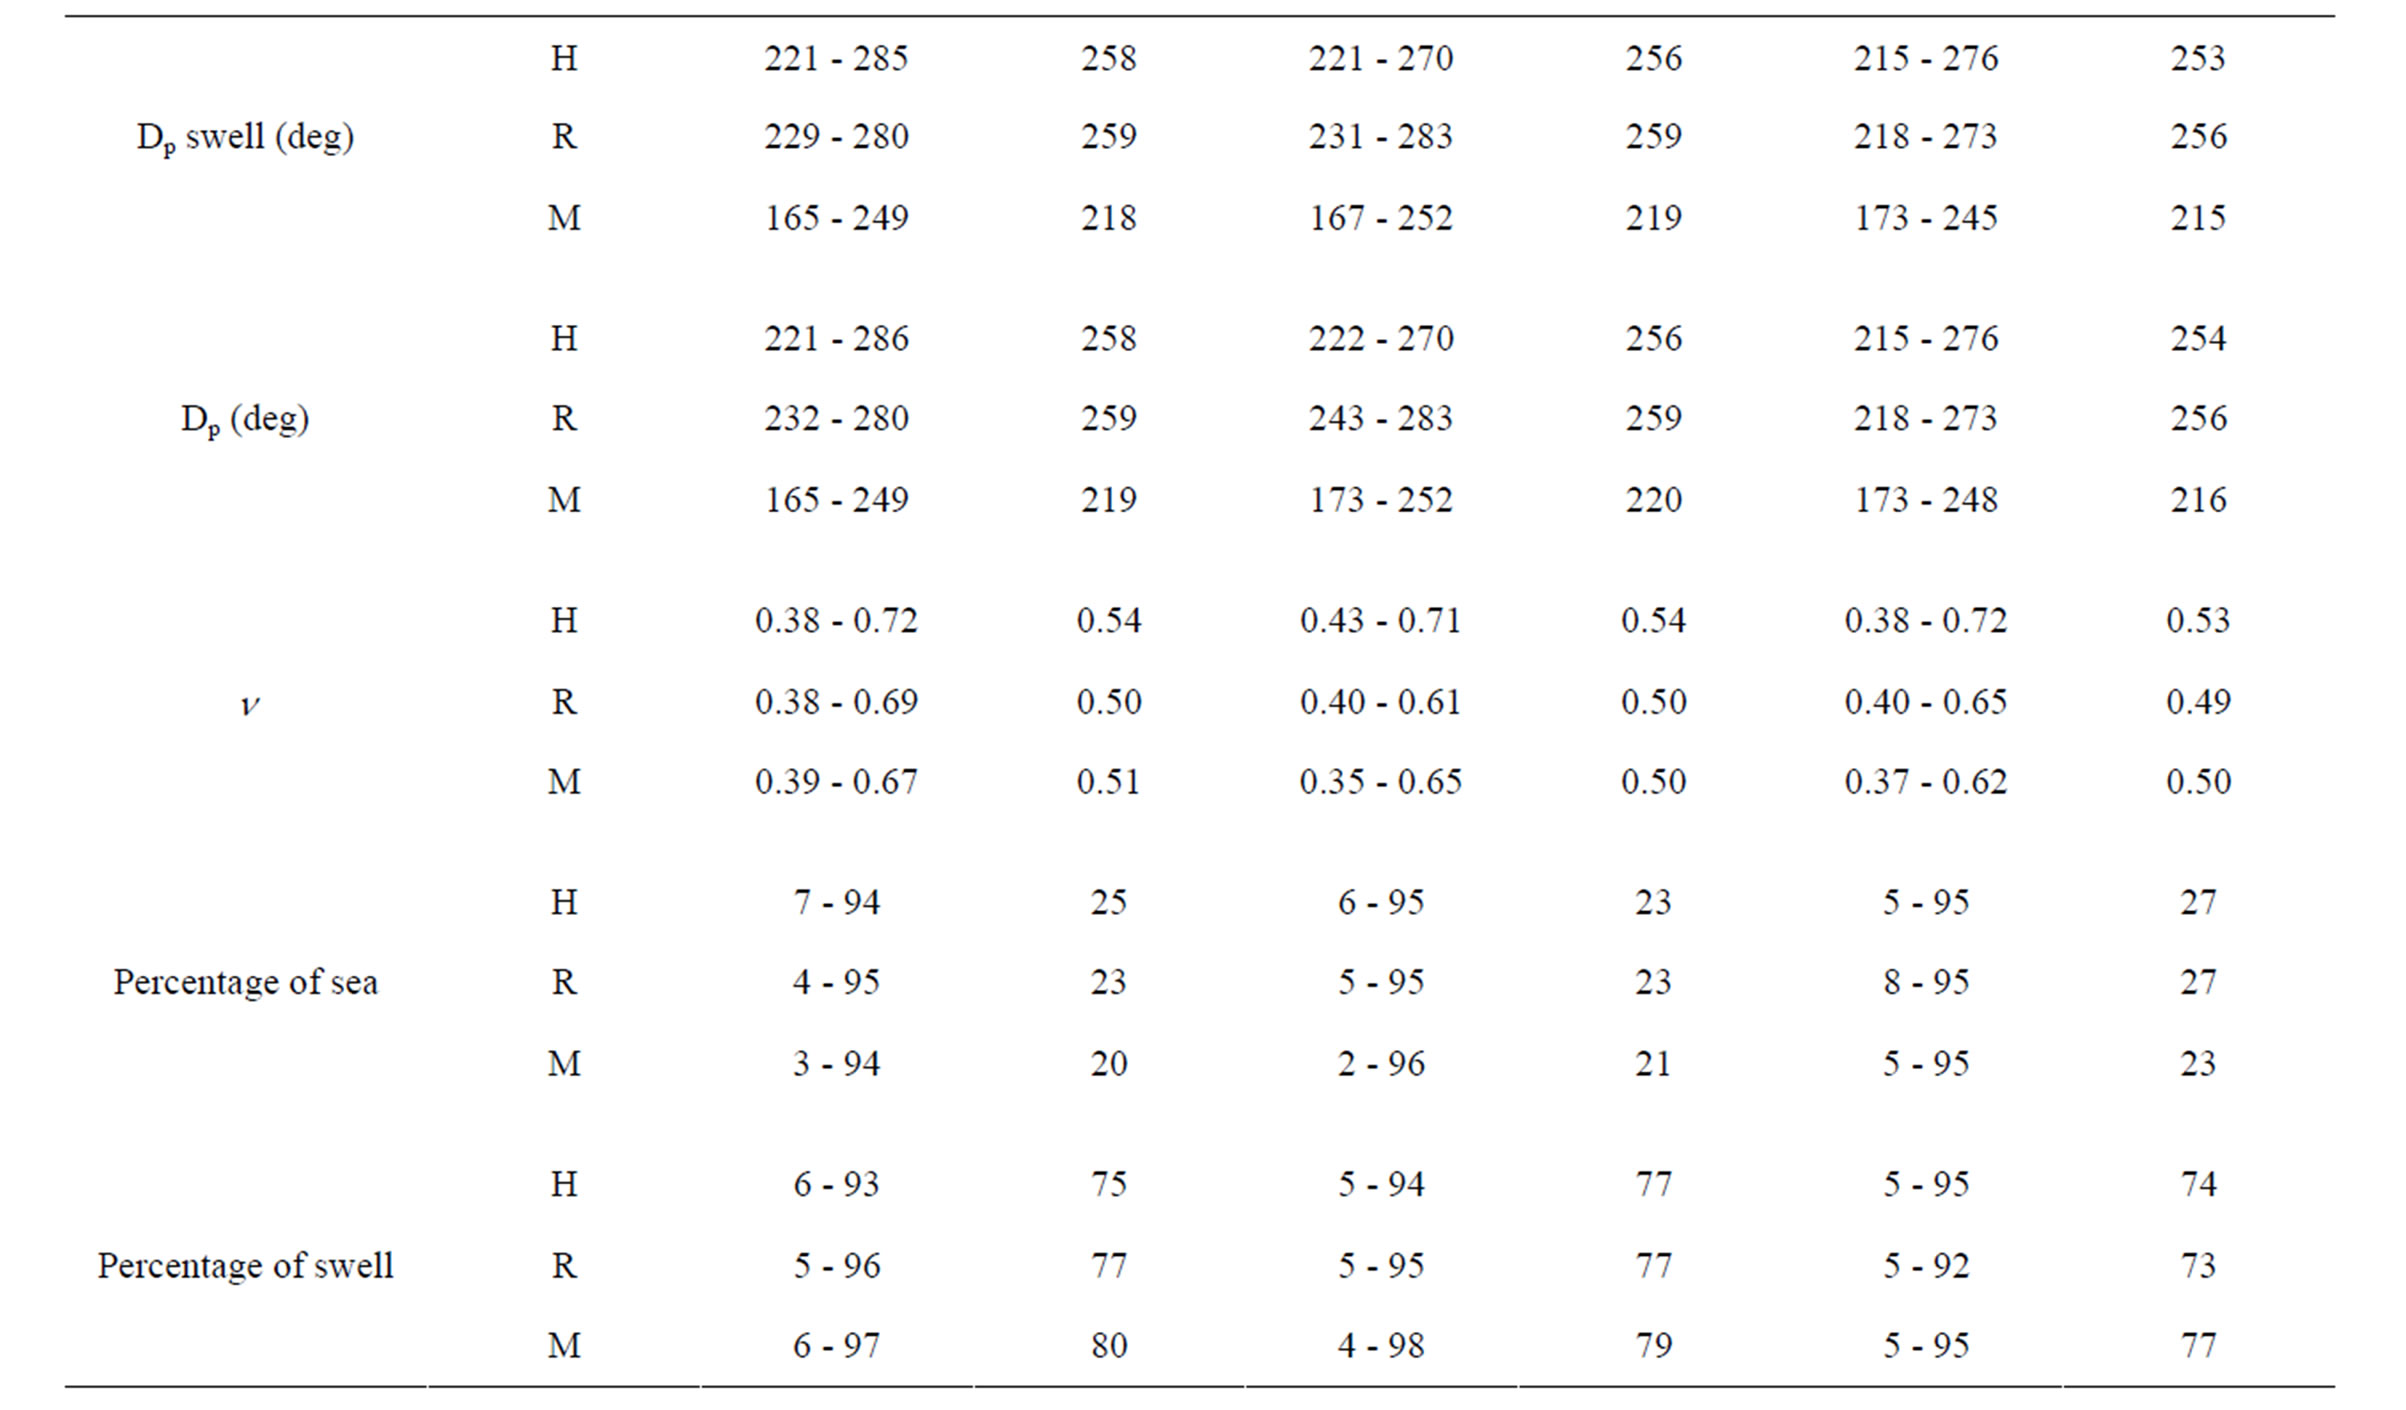
Table 2. Range and average value of wave parameters at 3 locations during summer monsoon.
1) the measurement location is in the open ocean and 2) even though the wind at the study region is strong during this period, the wind blowing over the entire Arabian Sea also will be strong and the waves generated in the Arabian Sea will be propagating towards the coast. When these swells are added to the wave system at the measurement location, the energy of the wind sea reduces and that of the swell increases [9] and will result in dominance of swells. Waves having spectral peak period less than 6 s were not present during the summer monsoon period. The wave spectral energy is divided into three bands [10] i.e. 1) short period (wave period, T < 6 s, is dominated by local seas); 2) long period (T > 12 s, results primarily from swell) and 3) intermediate period (6 s ≤ T ≤ 12 s, probably results from a mixture of local and regional wind forcing) and studied the variation. Contribution of short period waves was high (20%) at Honnavar and low (15%) at Muldwarka. Whereas, the contribution of long period waves was high at Muldwarka (18%) and low (14%) at Honnavar. The study shows that the contribution of long period waves was increasing as we move from south to north along the west coast of India. The contribution of intermediate period waves were similar at all the 3 locations. When Hm0 was more than 3 m, the contribution of long period waves was 27% at Muldwarka and 24% at Honnavar indicating that the contribution of long period waves increases as the wave height increases. The correlation between intermediate period waves and short period waves were high (correlation coefficient 0.75). But the correlation between short period waves and long period waves was low (correlation coefficient 0.4) indicating that the waves in these frequency bands are not generated by the same wind at same time. Even though the measured waves consists of sea and swell, the spectral narrowness parameter (n) has a mean value of around 0.5 indicating that the wave spectra is narrow banded during the monsoon.
The average of the mean wave period (Tm02) of sea was 4 s and that of swell was 9.5 s (Table 2). The most frequent wave periods (Tm02) was 6 to 7 s (45% of the observations) at Honnavar and Ratnagiri whereas at Muldwarka 45% of the observations were having Tm02 between 7 and 8 s. Tm02 over 9 s were seldom and occur with a probability of about 1%. Tm02 was relatively high at Muldwarka compared to other locations. Variations in Tm02 between the 3 locations were around 8%.
The mean wave direction with respect to coastal inclination determines the direction of movement of littoral sediments in the near shore region. At Honnavar and Ratnagiri waves were predominantly swells arriving from southwest-west (257˚) direction (Figure 3). The average coastal inclination is 17˚ to the west from the true north at Honnavar. Waves having direction 253˚ will be approaching perpendicular to the coast (wave crest angle will be parallel to the coastline). Study shows that the wave direction (Dp) do not vary significantly at
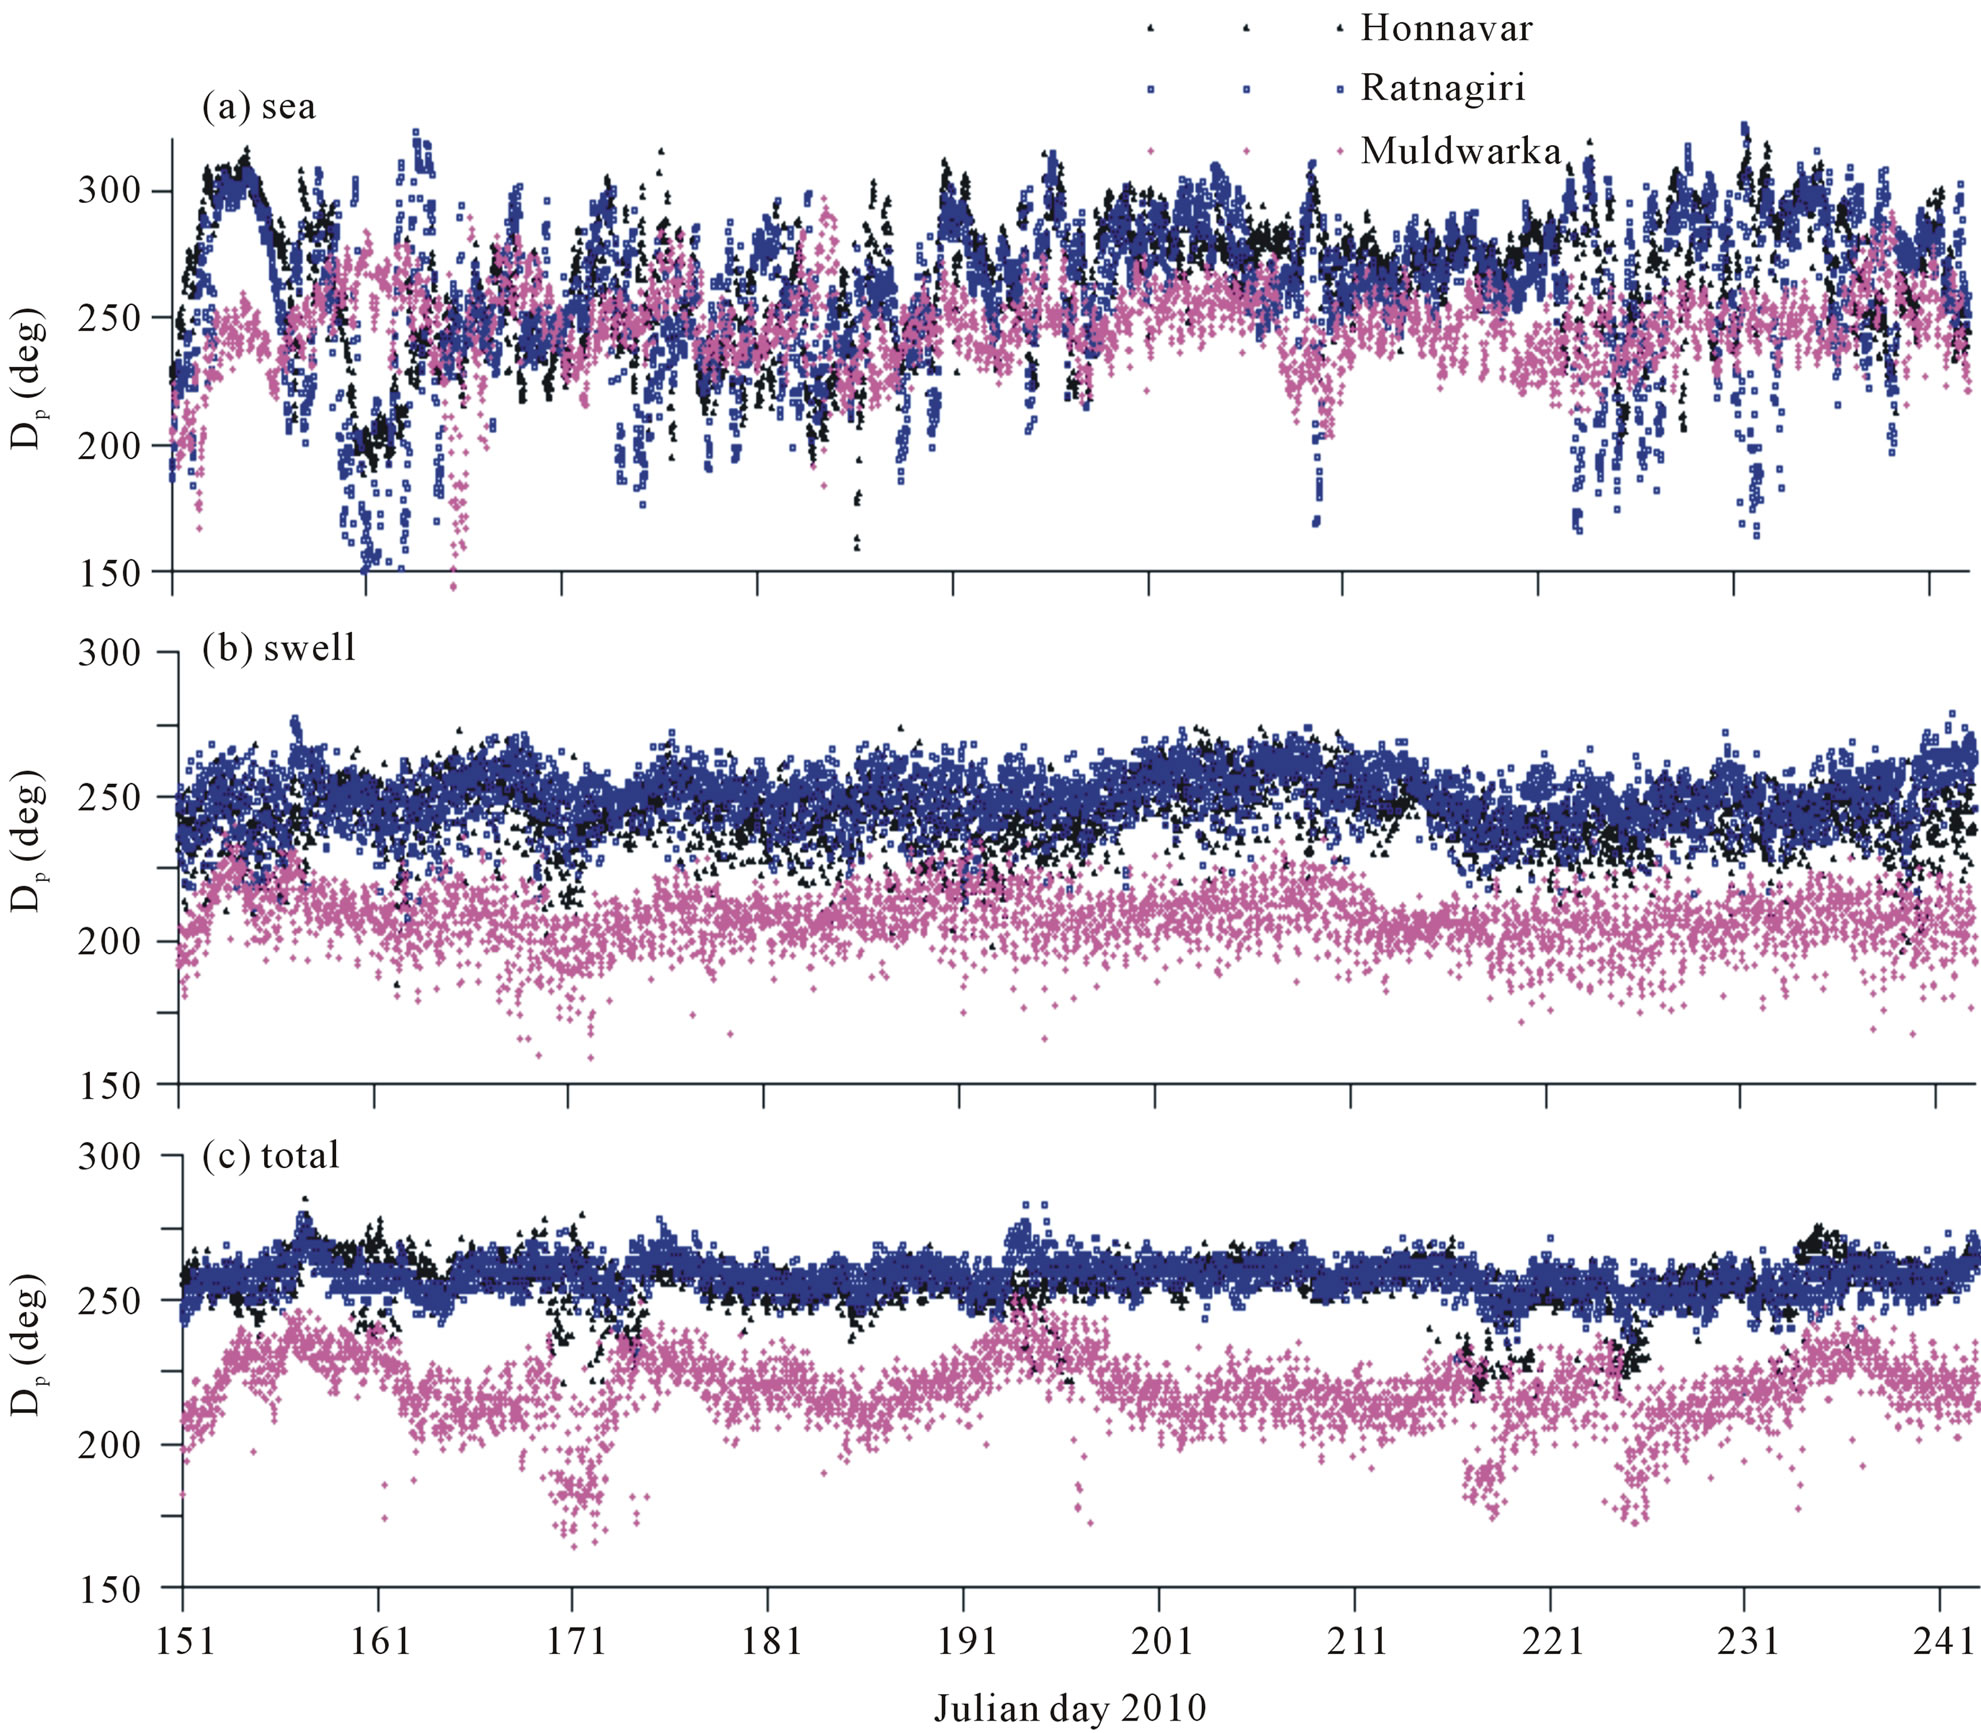
Figure 3. Time series plot of mean wave direction of (a) Wind sea; (b) Swell and total during pre-monsoon, monsoon and post-monsoon period at Honnavar, Ratnagiri and Muldwarka.
Honnavar and Ratnagiri. But the waves at Muldwarka were different with swells arriving from southwest (217˚). The average coastal inclination at Muldwarka is 67˚ to the west from the true north. Waves having direction 203˚ will be approaching perpendicular to the coast. At Honnavar and Ratnagiri, the high frequency waves (wind sea) were approaching from the directional sector between south and northwest (190˚ to 315˚) (Figure 4), whereas at Muldwarka, the high frequency waves were approaching from the directional sector between south and west (174˚ to 271˚). The difference in wave direction at Muldwarka was due to the coastal inclination. The study shows that the direction of wind sea and swell differ upto 40˚ during the summer monsoon period. Hence it is important to consider the directions of sea and swell while planning the marine structures along the west coast of India.
The water depth was 10, 13 and 10 m at the wave measurement locations Honnavar, Ratnagiri and Muldwarka. Since the measurement is done in relatively shallow location, the measured waves are depth influenced. Average value of ratio of water depth and wave length associated with the mean wave period is 0.2 (<0.5) indicating that the measured waves were in the transitional water. Hence the waves measured were the transformed waves and the wave height and the wave direction measured will be different than that in the deep water.
The peak wave period varies between 7 and 20 s with mean value of 11 s (swell conditions). Peak period of high waves (>3 m) were between 10 and 13 s (Figure 5(a)). The average value of the peak period was similar at all the 3 locations. The maximum spectral energy density was increasing from south to north (Figure 5(b)) with the spectral energy density at the northern location 60% more than that at the southern location. Correlation between maximum spectral energy density (Emax) and the significant wave height was high (Figure 5(c)).
The maximum value of Hm0 for wave data collected at 3, 6, 12 and 24 h interval was less by 4.5%, 8%, 10% and 12% compared to the value obtained with data collected at 1/2 h interval. Goda [11] observed that wave data with recording intervals of 6 or 12 h tend to miss the peaks of some storm events and can lead to underestimation of severe wave conditions. In order to compensate for this
 (a) (b) (c)
Figure 4. Contour plot of mean wave direction at (a) Honnavar (b) Ratnagiri and (c) Muldwarka during summer monsoon.
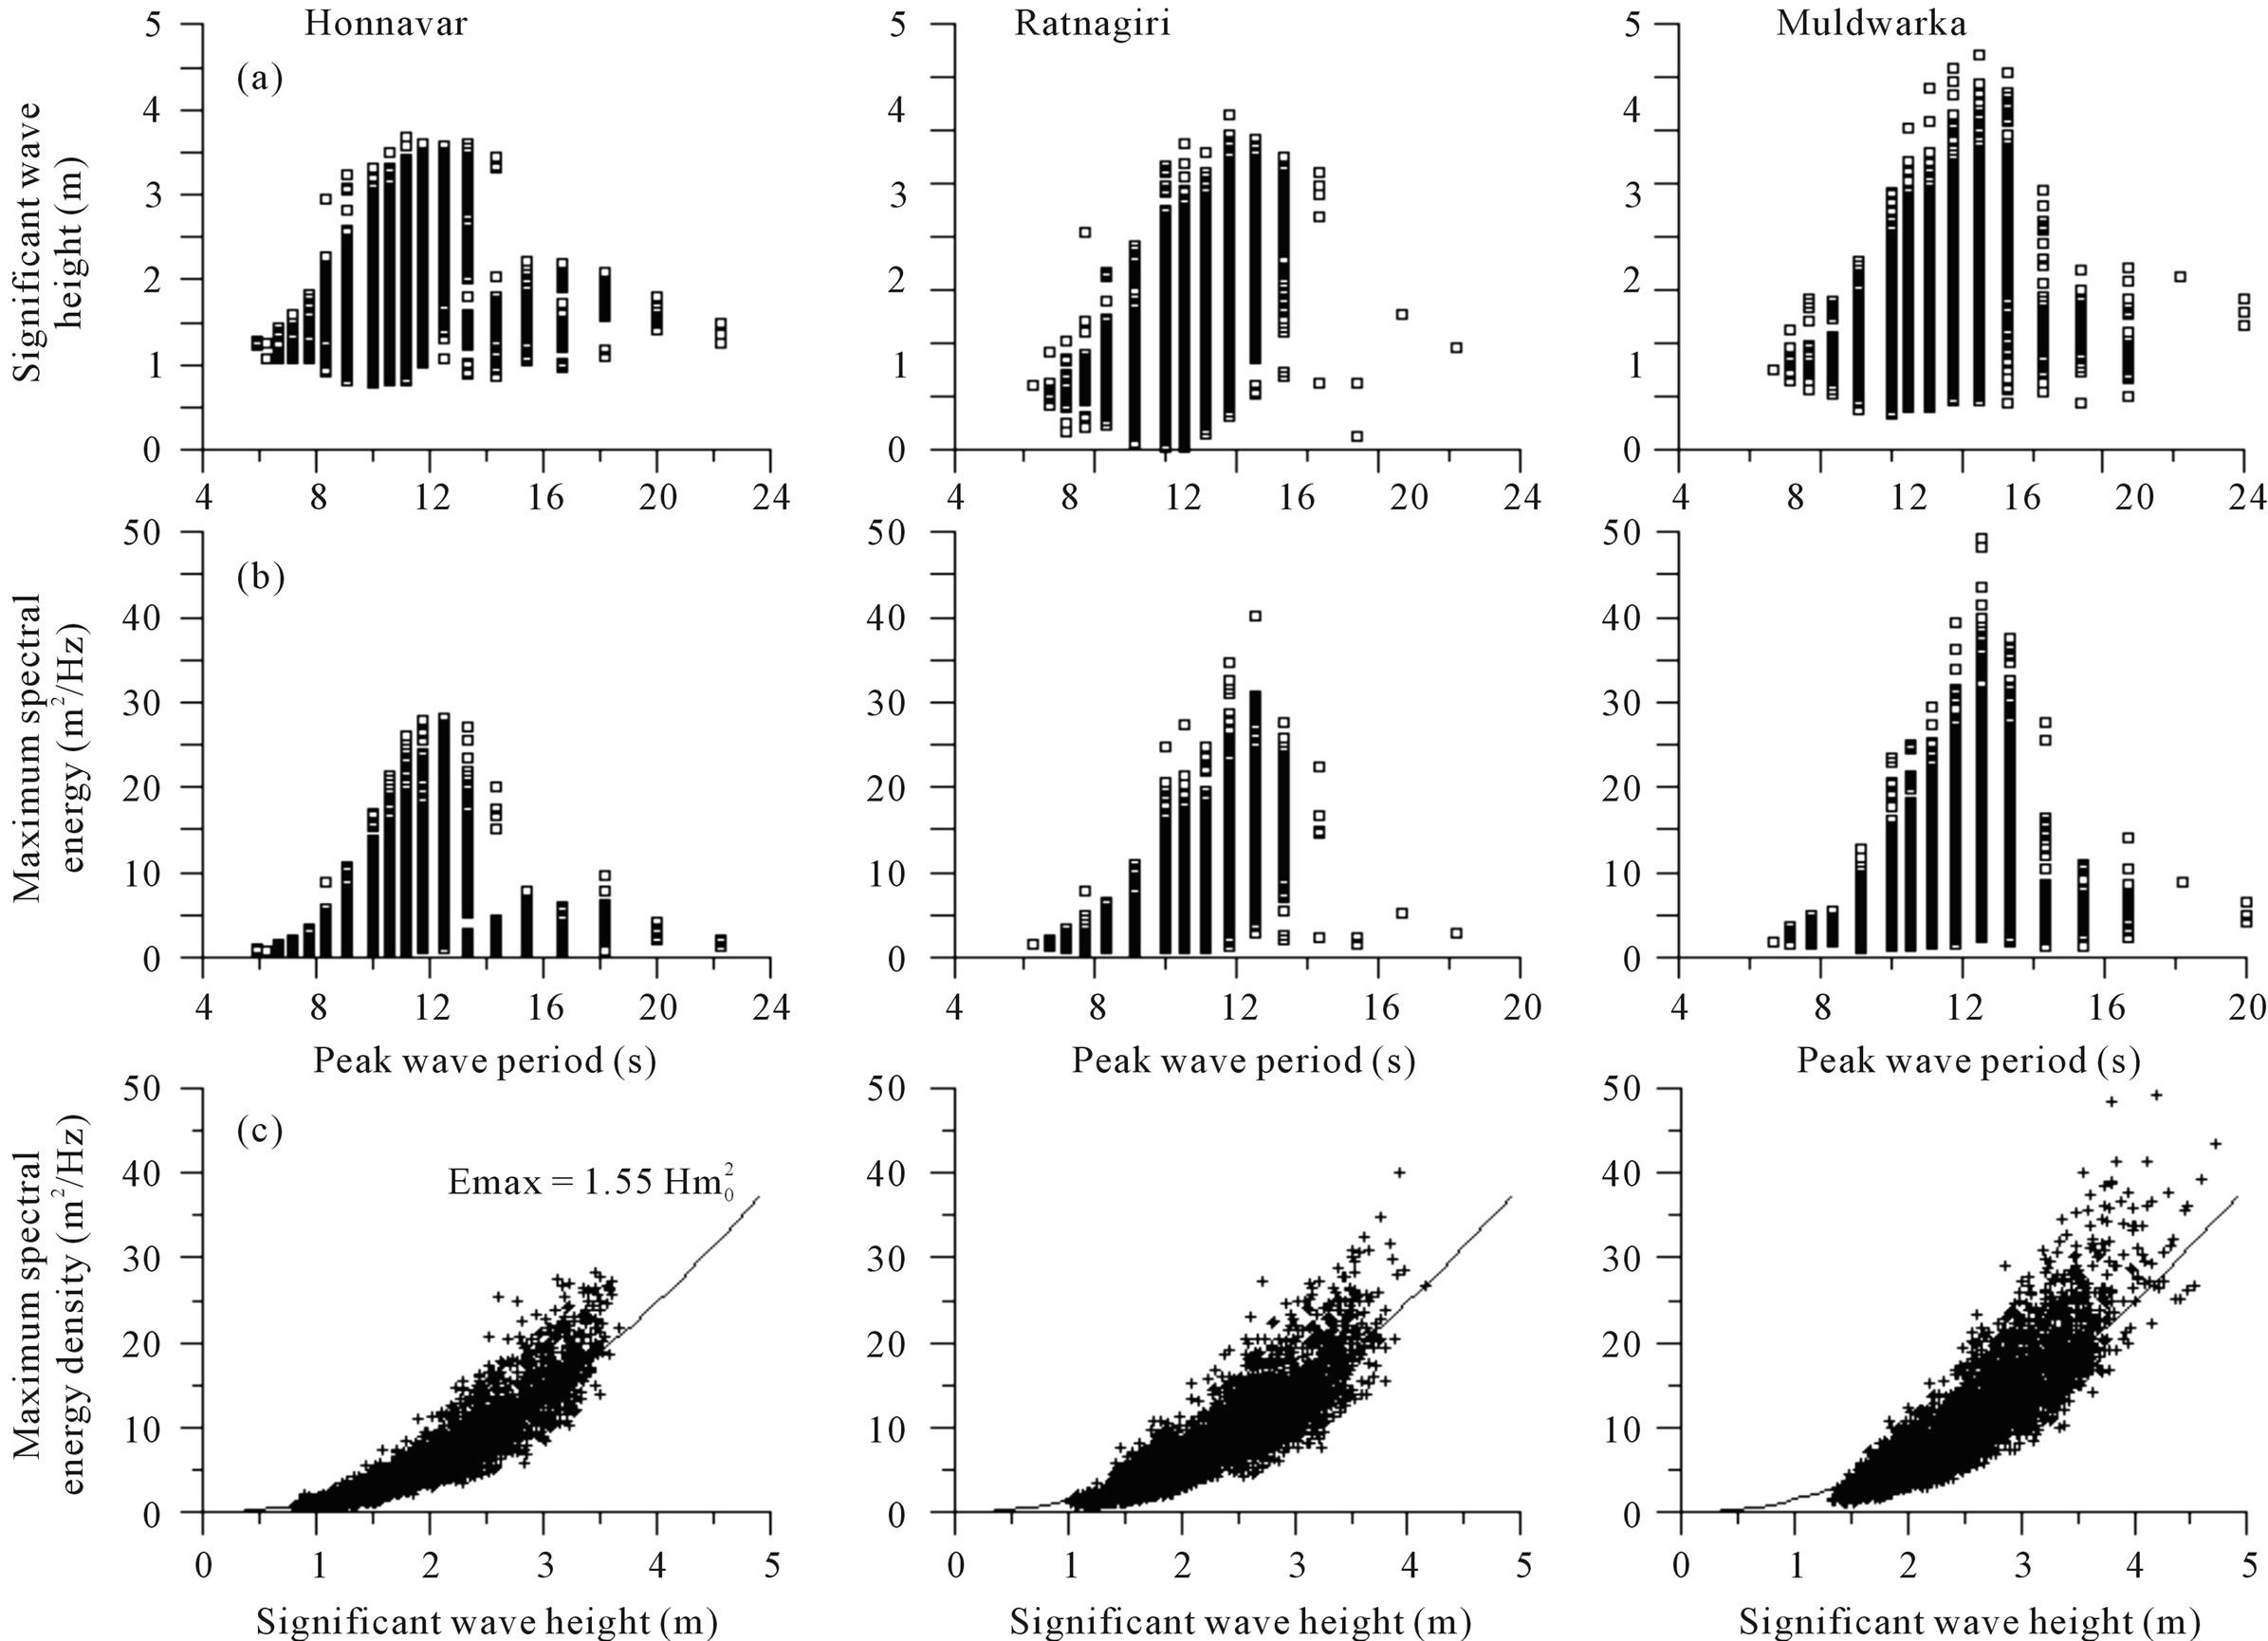
Figure 5. Variation of (a) Significant wave height; and (b) Maximum spectral energy density with peak wave period; (c) Maximum spectral energy density with significant wave height at Honnavar, Ratnagiri and Muldwarka during summer monsoon.
effect, Allen and Callaghan [12] used a simple block adjustment factor of 7% for the 6 h recording interval data and 10% for the 12 h recording intervals to each peak Hm0 value. The adjustment factors were found to be similar to the value obtained in the present data. There was no change in the average value of Hmax, Hm0, Tm02 and Tp for data based on different recording interval.
5. Conclusion
Percentage of swells in measured waves were 75% to 79% with higher percentage of swells in the northern location compared to that at the southern location. The significant wave height up to 4.7 m and maximum wave height up to 7.4 m was measured. The wave height was increasing from south to north with the significant wave height (Hm0) at the northern location 20% more than that at the southern location due to the increase in the swell height. Variations in mean wave period between the 3 locations were around 8%. Waves having spectral peak period less than 6 s were not present during the summer monsoon period. Peak period of high waves (>3 m) were between 10 and 13 s. Correlation between short period waves (wave period, T < 6 s) and long period waves (T > 12 s) was low (correlation coefficient 0.4) indicating that the waves in these frequency bands are not generated by the same wind at same time. The contribution of long period waves were high for higher waves and was increasing from south to north along the west coast of India. As the data collection interval increased, the maximum value of Hm0 was underestimated. But there was no change in the average value of Hmax, Hm0, Tm02 and Tp for the data based on different recording interval.
6. Acknowledgements
Integrated Coastal and Marine Area Management Project Directorate (ICMAM PD), Ministry of Earth Sciences, New Delhi funded the measurement at Honnavar. Indian National Centre for Ocean Information System (Ministry of Earth Sciences), Hyderabad funded the measurement at Ratnagiri and Gujarat Ambuja Cements, Muldwarka funded the measurement at Muldwarka. Director, National Institute of Oceanography, Goa provided encouragement to carry out the study. We thank Ms. Kirti Kedar Dubhashi, Technical Assistant, NIO for the data analysis. This is NIO contribution No. 5113.
REFERENCES
- V. S. Kumar, N. M. Anand, K. A. Kumar and S. Mandal, “Multipeakedness and Groupiness of Shallow Water Waves along Indian Coast,” Journal of Coastal Research, Vol. 19, No. 4, 2003, pp. 1052-1065.
- V. S. Kumar, S. Philip and T. N. B. Nair, “Waves in Shallow Water off West Coast of India during the Onset of Summer Monsoon,” Annales Geophysicae, Vol. 28, 2010, pp. 817-824. doi:10.5194/angeo-28-817-2010
- V. S. Kumar, J. Singh, P. Pednekar and R. Gowthaman, “Waves in the Nearshore Waters of Northern Arabian Sea during the Summer Monsoon,” Ocean Engineering, Vol. 38, No. 2-3, 2011, pp. 382-388. doi:10.1016/j.oceaneng.2010.11.009
- V. S. Kumar, K. C. Pathak, P. Pednekar and R. Gowthaman, “Coastal Processes along the Indian Coastline,” Current Science India, Vol. 91, No. 4, 2006, pp. 530-536.
- F. B. Stephen and T. Kollstad, “Field Trials of the Directional Waverider,” Proceedings of the 1st International Offshore and Polar Engineering Conference, Edinburgh, 11-16 August 1991, pp. 55-63.
- M. S. Longuet-Higgins, “On the Joint Distribution of the Periods and Amplitudes of Sea Waves,” Journal of Geophysical Research, Vol. 80, No. 18, 1975, pp. 2688-2694. doi:10.1029/JC080i018p02688
- A. J. Kuik, G. Vledder and L. H. Holthuijsen, “A Method for the Routine Analysis of Pitch and Roll Buoy Wave Data,” Journal of Physical Oceanography, Vol. 18, No. 7, 1988, pp. 1020-1034. doi:10.1175/1520-0485(1988)018<1020:AMFTRA>2.0.CO;2
- J. Portilla, F. J. Ocampo-Torres and J. Monbaliu, “Spectral Partitioning and Identification of Wind Sea and Swell,” Journal of Atmospheric and Oceanic Technology, Vol. 26, No. 1, 2009, pp. 117-122. doi:10.1175/2008JTECHO609.1
- M. A. Donelan, “The Effect of Swell on the Growth of Wind Waves,” Johns Hopkins APL Technical Digest, Vol. 8, No. 1, 1987, pp. 18-23.
- P. D. Bromirski, D. R. Cayan and R. E. Flick, “Wave Spectral Energy Variability in the Northeast Pacific,” Journal of Geophysical Research, Vol. 110, 2005, Article ID: C03005. doi:10.1029/2004JC002398
- Y. Goda, “On the Methodology of Selecting Design Wave Height,” Proceedings of 21st Coastal Engineering Conference, ASCE, New York, 20-25 June 1988, pp. 899- 913.
- M. Allen and J. Callaghan, “Extreme Wave Conditions for the South Queensland Coastal Region,” Environment Technical Report, Environmental Protection Agency, Queensland, Vol. 32, 1999, pp. 1-7.