Open Journal of Clinical Diagnostics
Vol.05 No.01(2015), Article ID:53963,8 pages
10.4236/ojcd.2015.51001
Evaluation of Laboratory Performance with Quality Indicators in Infectious Disease Hospital, Kano, Nigeria
Feyisayo Ebenezer Jegede1, Henry Akwen Mbah1*, Mansur Aminu2, Timothy Nathaniel Yakubu1, Kwasi Torpey1
1Family Health International (FHI360), Abuja, Nigeria
2Infectious Disease Hospital Laboratory, Kano, Nigeria
Email: *hmbah@linuxmail.org
Copyright © 2015 by authors and Scientific Research Publishing Inc.
This work is licensed under the Creative Commons Attribution International License (CC BY).
http://creativecommons.org/licenses/by/4.0/


Received 20 January 2015; accepted 5 February 2015; published 11 February 2015
ABSTRACT
Background: In January 2010, the implementation of quality management systems toward WHO- AFRO laboratory accreditation commenced in the Antiretroviral Treatment Laboratory of the Infectious Disease Hospital, Kano, Nigeria. Quality improvement projects were instituted in 2011 in line with ISO 15189 requirements for accreditation of medical laboratory. In this study we evaluated the performance of the laboratory through some set of quality indicators (QI). Methodology: This was a retrospective study to evaluate laboratory QIs monitored from January 2011 to December 2013. The QIs were specimen rejection rate (SSR), turnaround time (TAT), proficiency testing performance (PTP) and client satisfaction survey (CSS). Data was collected into an excel file for analysis and percentage performance compared among years. SSR & TAT were evaluated with the Sigma scale. Results: A total of 7920 (2194 in 2011, 2715 in 2012, 3011 in 2013) specimens were received for testing. 22 (0.28%) specimens were rejected and 81 (1.02%) specimens’ results were reported after the acceptable TAT, giving a Sigma level of 4.27 and 3.82 for SSR and TAT respectively. There was steady improvement in PTP: CD4+ from 67% in 2011 to 90% in 2013, hematology from 81% in 2012 to 83% in 2013, blood film reading 79% in 2011 to 83% in 2013 and chemistry from 90% in 2011 to 93% in 2013. HIV serology recorded 100% throughout. CSS increased from 59% in 2012 to 78% in 2013. However, there was no statistically significance difference reported for PTP and CSS over the years (P > 0.05). Conclusion: The study highlights the need to continuously evaluate QIs and calls for more effort to improve on PTP and focuses on understanding and improving on clients concerns.
Keywords:
Evaluation, Laboratory, Quality Indicators, Six Sigma, Nigeria

1. Introduction
Laboratory plays a pivotal role in disease control and prevention program by providing timely data or information for patient management and disease surveillance [1] . Quality in laboratory has huge impact on diagnosis and patient management as about 80% of all diagnosis is made on the basis of laboratory tests [2] [3] . International Organization for Standardization (ISO-15189) has recommended assessment and monitoring of quality management systems (QMS) in laboratory as quality improvement efforts towards quality laboratory services [4] . Quality laboratory management system has main objectives which are timely, precise and accurate results and meeting patients need and satisfaction. Key measures for improving laboratory services are continuous monitoring of the total testing process, the use of quality indicators to identify improvement opportunities, and measurement of the efficacy of specific interventions [5] .
QMS are still uncommon in clinical laboratories in Nigeria [6] [7] . In January 2010, implementation of QMS toward WHO-AFRO laboratory accreditation [8] [9] commenced in Nigeria involving several laboratories including Infectious Disease Hospital (IDH), Kano [10] , which is supported by FHI360. Quality improvement (QI) projects were instituted in IDH, Kano in line with ISO 15189 requirements for accreditation of medical laboratory in 2011. Some of these QI projects were monitored through quality indicators. Quality indicator is the information qualitative or quantitative associated to an event (or process or results) put under observation, that is able to evaluate its changes during the time and to verify achievement by comparing it with a criterion [11] [12] . Besides meeting the requirement of ISO 15189, the quality indicators are also required to provide information and accountability to stakeholders, users, etc. and establish a program of continual improvement to ensure quality of care and patient safety. Selected quality indicators encompassing each path of the laboratory total testing process (work flow) were monitored progressively over time.
Six Sigma provides principles and tools that can be applied to any process as a means to measure defects and/or error rates and to determine the degree to which any process deviates from its goal. Six Sigma refers to a quality level defined as the near-perfect defect rate of 3.4 defects per million opportunities [13] which is a goal for world-class quality. Six Sigma scale is an indirectly proportion to system defect or error rate as the higher the Sigma scale the lower the possibility of error in the system, thus the consistency and steadiness of the processes improve [14] [15] . Sigma metrics are being adopted as a universal measure of quality. In the clinical laboratory, it has been used to evaluate performance of testing processes, service provision and to establish benchmarks [13] [14] [16] [17] . Thus the number of errors or defects per million products or tests is a measure of the performance of a laboratory. In this study, it has been used to assess performance in some quality indicators like sample rejection rate and turnaround time.
The main objective of this study was to analyze quality indicators in order to evaluate laboratory quality performance over time as a strategy for continuous quality improvement effort.
2. Methodology
2.1. Study Design and Setting
This was a retrospective study to analyze and evaluate quality indicators from January 2011 to December 2013 in the Antiretroviral Treatment (ART) Laboratory of IDH, Kano.
IDH, Kano, located in the North West of Nigeria, within the savanna was established in the early 1960s as an isolation unit for smallpox patients. Subsequently, the unit was expanded into a fully-fledged secondary level state owned public hospital. The hospital provides services to a catchment area including Kano and neighboring states and also to patients from the Republic of Niger. Presently, the hospital has a capacity of about 250 beds, and a new multi-drug resistant (MDR) tuberculosis clinic with 3 additional wards. With funds from President Emergency Plan for AIDS Relief (PEPFAR) through United State Agency for International Development (USAID), FHI360 has been supporting IDH, Kano to provide comprehensive antiretroviral therapy (ART) pro- gram since February 2005 till date. As of September 2014, a total of 9758 HIV positive patients have so far been registered for ART services, with about 5151 initiated on antiretroviral therapy. The ART Laboratory provides HIV serological screening and monitoring testing such as CD4+ enumeration, clinical chemistry, hematology as well as other tests like pregnancy, hepatitis, syphilis including tuberculosis and malaria microscopy.
2.2. Quality Indicators
The seven laboratory quality indicators monitored are grouped according to the phase of the total laboratory testing process. The quality indicators with the set performance target along with the related Institute of Medicine (IOM) domains are listed in Table 1. The critical health care domains as defined by the IOM are patient safety, effectiveness, equity, patient centeredness, timeliness, and efficiency [18] . All quality indicators monitored were scrutinized for data completeness and consistency. Of the seven quality indicators evaluated, only four indicators (specimen rejection rate, turnaround time, proficiency testing performance and client satisfaction survey) were analyzed in this study. The remaining three indicators (equipment down time, reagents stock out and reagent rejection rate) were excluded in this analysis because of incomplete data.
Quality indicators monitoring were regularly reviewed by laboratory management (head of department, quality officer, safety officer and sectional head of each unit) team to make informed decision on improving on quality management processes.
For the purpose of our study, the various quality indicators were defined and/or measured as follows:
Proficiency testing performance (PTP): This indicator is the percentage of correct proficiency testing (PT) results. Criteria for passing vary by analytes (e.g., target value ± a fixed concentration limit, ± a fixed percentage, or ± 2 SD for results of a given laboratory group) or test type. The annual frequency of the proficiency testing was: CD4 count six trails; Hematology and Film Reading 12 trials; Chemistry 12 trails; HIV serology three trials.
Client satisfaction survey (CSS): This indicator is the percentage of clients satisfied with various aspects of laboratory services such as confidentiality, courtesy, instruction manual, explanation of procedures, cleanliness, waiting time, turnaround time, result information and counseling. For the survey, questionnaires were administered to randomly selected clients who visited the laboratory (n = 135) between June to August in 2012 and (n = 150) over the same period in 2013. The questionnaire had nine questions (Figure 2) covering various aspect of laboratory services and the grading ranged from 1 point being the lowest level of satisfaction to 5 points being the highest.
Specimen rejection rate (SRR): This indicator is the percentage of specimen rejected and not tested due to some reasons. For example, blood clot, hemolysis, insufficient specimen, wrong bottle, wrong additive or spill sample, etc.
Turnaround time (TAT): This indicator refers to the percentage of specific laboratory tests that do not meet a reporting deadline.
Equipment down time: This indicator is the number of days in a month that the equipment is not functional due to breakdown.
Reagent stock out: This indicator reports the number of days in a month a particular test kit or group of reagents was out of stock. ART reagents include (HIV rapid test Kits, CD4 count reagents for FACSCount®, hematology reagents for Beckman Coulter® and chemistry reagents for Selectra Junior®).
Reagent rejection rate: This indicator shows the rate at which test kits or reagents (HIV rapid test Kits, CD4 count reagents far FACSCount®, hematology reagents for Beckman Coulter® and chemistry reagents for Selectra Junior®) are rejected based on predefined standard in laboratory quality manual such as expired reagents at supply, reagent supplied without lot number, reagent cool chain compromised or other issues along the chain of custody.
2.3. Data Collection, Validation and Analysis
Raw data were collected for each indicator manually by facility laboratory quality officer and crossed checked and approved by the laboratory supervisor. Data was entered manually into excel file, reviewed and cleaned by FHI360 laboratory staff before analysis. For PTP, the average percentage per trial by year for each parameter was analyzed. For CSS, the general score for each of the satisfaction item and also the overall satisfaction score was determined. The mean difference for PTP and CSS were tested by using one-way analysis of variance and student’s T-test where applicable and probability of 0.05 was considered statistical significant.

Table 1. Set performance for each quality indicator and IOM domains.
IOM = Institute of Medicine; PTP = Proficiency testing performance; *Not considered in analysis; #time interval between sample collection to availability of results for clinician use in this case is 24 hours for HIV monitoring investigations.
PTP and CSS Comparison were made with set targets (Table 1) for each QI. SRR and TAT were normalized to parts-per-million defects with the formula  (Defects per million opportunities (DPMO) and converted to Sigma scale using Yield to Sigma Conversion Table [14] .
3. Results
A total of 7920 (2194 in 2011, 2715 in 2012, 3011 in 2013) specimens were received for testing over the study period. The overall specimen rejection rate (SSR) of (22/7920) 0.28% and turnaround time (TAT) of (81/7920) 1.02% were above the defined standard and improved over the study period (Table 2). On analyzing with the Six Sigma scale, the specimen rejection rate was 2778 defects per million with a sigma level of 4.27 and specimen TAT default rate was 10,227 defects per million with a sigma level of 3.82. Table 2 shows details for each period. Specimen rejection was mostly due to clots (50%) (Table 3) and delay in meeting TAT was solely due to equipment down time.
Figure 1 shows the PTP for the various tests over the study period. In 2011, the PTP for CD4 count (67%) and hematology film reading (79%) were below the set standard of 80% compared to the other domains. For the remaining two years period, the PTP for all the domains was satisfactory. HIV serology recorded 100% through- out. There were no statistically significance differences in PTP (CD4 count, hematology, Chemistry and HIV serology) from 2011 to 2013 (P > 0.05).
Although, CSS showed progressive improvement performance from 59% in 2012 to 78% in 2013, the overall performance was below set standard. However, cleanliness (62% in 2012 and 86% in 2013), counseling (57% in 2012 and 81% in 2013), instruction manual (60% in 2012 and 82% in 2013) and explanation of procedures (49% in 2012 and 71% in 2013) were the most improved and waiting time (64% in 2012 and 73%in 2013) was the least improved (Figure 2). Further analysis on CSS showed that there was no statistically significance difference in performance in 2012 and 2013 (P > 0.05).
4. Discussion
Quality Improvement (QI) projects were instituted in IDH, Kano in line with ISO 15189 requirements for accreditation of medical laboratory and some were monitored by using quality indicators.
As we experienced with some of the quality indicators, poor documentation of laboratory processes, incidence and occurrence is a big challenge as the staff consider documenting as unnecessary paperwork and extra burden as reported earlier in Nigeria [7] . Health-workers performance (defined as adherence to an accepted standard or guideline) is very often inadequate, and is a widespread problem in low-resource settings [19] .
In this study, the overall SSR of 0.28% was lower than a 0.57%, 1.46% and 4.19% reported in similar laboratory based studies in Porto Alegre, Brazil [20] , Cape Town, South Africa [21] and Delhi, India [3] respectively.
Table 2. SRR rate and TAT expressed in Sigma scale.
DPMO: Defects per million opportunities; SRR: Specimen rejection rate; TAT: Turnaround time.
Table 3. Reasons for specimen rejection.
 80% represent acceptable benchmark for PTP except for serology which is >90%
Figure 1. Proficiency testing performance (PTP) from 2011 to 2013.
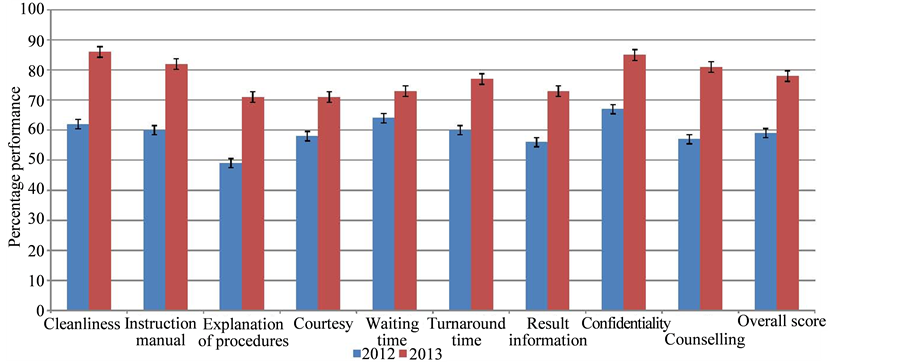
Figure 2. Client satisfaction survey (CSS) performance for 2012 and 2013.
Furthermore, we reported that sample clotting accounted for about 50% of specimen rejection which is similar to a 54% reported in the Brazil study [20] but higher than the South Africa study reporting 30% [21] . Our findings for specimen rejection due to insufficient specimen volume (22.7%) is similar to the South Africa study (22%) [21] , but very different from a 43.8% reported in the Brazil study [20] . With the exception of a few referrals, over 90% of the blood samples in this study were collected within the phlebotomy unit under the supervision of the laboratory head by laboratory staff trained in phlebotomy practice. This practice may have accounted for the low SRR in this study. Some reports have concluded that the rates of pre-analytic errors are lower for outpatients, for whom phlebotomy procedures are performed by personnel under direct laboratory control [22] [23] .
There are no widely accepted turnaround time (TAT) goals for specific laboratory testing, hence laboratory set target based on test type, priority, population served to meet patient satisfaction and efficiency [24] . In our study a TAT of 24 hours set target (standard of ≥95%) was considered satisfactory, as the focus is on ART patients that usually have appointments at two months interval for antiretroviral (ARV) drug refill. More so, any newly diagnosed HIV patient must have at least two session of adherence counseling that takes an average of two days before they are evaluated for possible ARV therapy. Others studies had documented and set the average TAT for the clinical biochemistry of 5.5 hours for routine inpatient samples and 24 hours for the outpatient samples [25] . We recorded a very good performance above the set benchmark as only 1.02% of the results were reported after the acceptable TAT. This performance is comparable to report on a study of routine outpatient test with a TAT of 24 hours, involving 118 hospital based laboratories in the United State of America (USA) where acceptable performance was met by 98.8% of laboratories for basic metabolic panel measurement and 99.5% for FBC measurement [24] .
Laboratory quality indicator data, most often presented and reported as a percentage of variance, may be misleading, especially when the variances and calculated percentages, appear to be low. Therefore laboratory data reported in parts-per-million defects (Sigma scale) demonstrates opportunities for significant improvements in laboratory performance across the total testing process [13] . To the best of our knowledge, this is first time in Nigeria that an aspect of clinical laboratory performance is being analyzed with the Six Sigma scale. Based on the Sigma scale we reported a SRR of 4.27 and TAT of 3.82 which is optimal/satisfactory based on benchmark for minimum process performance of 3 Sigma [26] . Our Sigma value for SRR is similar to a USA College of American Pathologist (CAP) Q-probes study that reported 4.15 for hematology and 4.25 for chemistry specimen acceptability [13] . In our study, even our lowest Sigma value of 3.54 for TAT in 2011 surpasses the minimum acceptable standard of 3 Sigma. In health care, quality problems frequently occur at rates of 20 to 50 percent, or 200,000 to 500,000 per million [27] .
The proficiency testing performance score for HIV serology was consistently at 100%. Improved PTP in HIV serology score from 74% to 94% in a survey involving 44 laboratories in four trails following staff mentoring have been reported in Nigeria [28] . For the other parameters there was sustained improvement over the study period. Our improved trend (67% in 2010 to 90% in 2013) in CD4+ PTP was similar (58% in 2009 to 88% in 2010) to that reported in Clinical Trials Centers in Ghana and Burkina Faso following the introduction of Good Clinical Laboratory Practices (GCLP) within the laboratories [29] . One probable cause for poor PTP for CD4 count in 2011 was due to the deployment of a new staff on rotation that had just passed the initial competency assessment to the CD4 count testing bench from routine bacteriology laboratory. A study in Tokyo have attributed poor performance in the external quality assurance (EQA ) surveys to be closely related to the type of training and experience of the laboratory technical staff as well as poor laboratory managements and supervisory ability of the consultant physicians [30] . Another probable cause for poor PTP in CD4 testing is pipetting error. Following a review of corrective and preventive action record, regular pipette calibration was introduced as corrective measure. For chemistry and hematology PT, pipetting error was an unlikely issue as the analyzers used are fully automated to pipette both sample and reagents. Furthermore, all the major equipments were regularly calibrated as scheduled.
Although there was in improvement in CSS from 59% in 2012 to 78% in 2013, it was still below the benchmark of ≥80% set for the laboratory. A very similar result of improvement in patient satisfaction from 56% to 73% over a two years period was reported for a laboratory in Botswana [31] . Our findings was lower compared to an 83% score reported for patient satisfaction of hospital services conducted in Aminu Kano Teaching Hospital, Kano, a close by setting [32] . Another study in Ethiopia also reported a higher (85.5%) overall patients satisfaction rate for ART Laboratory monitoring services [33] .
One of the limitations of this study was the exclusion of proficiency testing trials that the laboratory did not participate in within the stipulated survey period due to equipment breakdown or stock out of reagents especially for the hematology analyzer. Although our results based on Sigma rating meets international standards, it should be interpreted with a lot of caution with reference to the overall laboratory quality status. The evaluation only pertains to SRR in the pre-analytical and TAT in the post-analytical laboratory work phase, without any parameter in the analytical phase and many other critical quality system essential elements in all the phases. It is also worth noting that, although our results on TAT based on laboratory testing that meets reporting deadline was excellent and met international standards, the results for TAT based on CSS did not reflect this. In as much as CSS is increasingly being promoted in developing countries as a means of assessing healthcare service quality and the demand for these services, there is a lot of concerns about the reliability of responses in such surveys due to bias [34] .
Besides poor staff attitude, poor state of infrastructure, difficult work flow due to unstructured floor plan, and interrupted power supply poses challenge to the smooth implementation of quality improvement (QI) projects in the ART Laboratory, IDH, Kano. ART program supported by funder is been considered as extra work or mostly refer to secondary assignment at facility level, systems integration including laboratory services integration is critical to remedy this situation [35] .
5. Conclusion
Although there have been steady improvements in the performance of all the QI analyzed, the study highlights the need to continuously evaluate QIs and calls for improved effort on the review and use of proficiency testing record, feedback for opportunity to improve quality laboratory services and focuses on understanding and improving on clients concerns. The ART Laboratory, IDH, Kano is still in the pathway of implementing QMS toward WHO-AFRO laboratory accreditation [8] [9] . Much more is still required in terms of technical knowhow, management support and commitment toward improved and sustained laboratory quality systems as a way towards any international standard of laboratory accreditation.
Authors Contributions
Conceived and designed of experiment: FEJ, MA, HAM; performed the experiment: FEJ, TNY, MA; analyzed the data: MA, HAM, FEJ, HAM, and KT; wrote the paper: HAM, FEJ, TNY, MA; reviewed the manuscript: FEJ, TNY, HAM, and KT.
Ethical Considerations
FHI360 Office of International Research Ethics (OIRE), North Carolina, USA, approved the study (IRB No. 657532-1).
Financial Disclosure Statement
Support for this study was provided by FHI360 Nigeria with funds from the U.S. President’s Emergency Plan for AIDS Relief (PEPFAR) through U.S. Agency for International Development (USAID).
Competing Interest
The authors have declared no competing interests. The views express here are those of the authors and do not necessarily reflect those of FHI360.
Acknowledgements
The authors sincerely appreciate stakeholders in Kano State Ministry of Health, Hospital Management Board, all hospital staffs especially the laboratory staffs of Infectious Disease Hospital, Kano for the support and providing a conducive atmosphere for the successful conduct of this study.
References
- WHO (2008) Strengthening Public Health Laboratories in the WHO African Region: A Critical Need for Disease Control. 58th Session of the WHO Regional Committee for Africa (AFR/RC58/R2), World Health Organization Regional Office for Africa, Yaounde.
- Bonini, P., Plebani, M., Ceriotti, F. and Rubboli, F. (2002) Errors in Laboratory Medicine. Clinical Chemistry, 48, 691- 698.
- Agarwal, R., Chaturvedi, S., Chhillar, N., Goyal, R., Pant, I. and Tripathi, C.B. (2012) Role of Intervention on Laboratory Performance: Evaluation of Quality Indicators in a Tertiary Care Hospital. Indian Journal of Clinical Biochemistry, 27, 61-68. http://dx.doi.org/10.1007/s12291-011-0182-7
- International Organization for Standardization (2012) ISO 15189: Medical Laboratories Requirements for Quality and Competence. Geneva. http://www.iso.org
- Salinas, M., López-Garrigós, M., Gutiérrez, M., Lugo, J. and Uris, J. (2010) Two Minutes of Monthly Monitoring Can Ensure Quality Laboratory Service Every Day of the Year. Lab Medicine, 41, 360-363. http://dx.doi.org/10.1309/LM8OI14LCORJYHVY
- Audu, R.A., Sylvester-Ikondu, U., Onwuamah, C.K., Salu, O.B., Ige, F.A., Meshack, E., et al. (2011) Experience of Quality Management System in a Clinical Laboratory in Nigeria. African Journal of Laboratory Medicine, 1, 1-5. http://dx.doi.org/10.4102/ajlm.v1i1.18
- Jegede, F.E., Mbah, H.A., Yakubu, T.N., Adedokun, O., Negedu-momoh, O.R. and Torpey, K. (2014) Laboratory Qua- lity Audit in 25 Anti-Retroviral Therapy Facilities in North West of Nigeria. Open Journal of Clinical Diagnostics, 4, 193-204. http://dx.doi.org/10.4236/ojcd.2014.44028
- Gershy-Damet, G.-M., Rotz, P., Cross, D., Belabbes, E.H., Cham, F., Ndihokubwayo, J.-B., et al. (2010) The World Health Organization African Region Laboratory Accreditation Process: Improving the Quality of Laboratory Systems in the African Region. American Journal of Clinical Pathology, 134, 393-400. http://dx.doi.org/10.1309/AJCPTUUC2V1WJQBM
- Yao, K., McKinney, B., Murphy, A., Rotz, P., Wafula, W., Sendagire, H., Okui, S. and Nkengasong, J.N. (2010) Improving Quality Management Systems of Laboratories in Developing Countries: An Innovative Training Approach to Accelerate Laboratory Accreditation. American Journal of Clinical Pathology, 134, 401-409. http://dx.doi.org/10.1309/AJCPNBBL53FWUIQJ
- Mbah, H., Ojo, E., Ameh, J., Musuluma, H., Negedu-Momoh, O.R., Jegede, F., et al. (2014) Piloting Laboratory Quality System Management in Six Health Facilities in Nigeria. PLoS ONE, 9, e116185. http://dx.doi.org/10.1371/journal.pone.0116185
- UNI 11097 (2003) Quality Management―Quality Indicators and Quality Management Synoptical Tables―General Guidelines.
- Shahangian, S. and Snyder, S.R. (2009) Laboratory Medicine Quality Indicators. American Journal of Clinical Pathology, 131, 418-431. http://dx.doi.org/10.1309/AJCPJF8JI4ZLDQUE
- Nevalainen, D., Berte, L., Kraft, C., Leigh, E., Picaso, L. and Morgan, T. (2000) Evaluating Laboratory Performance on Quality Indicators with the Six Sigma Scale. Archives of Pathology & Laboratory Medicine, 124, 516-519.
- Westguard, S. (2011) 113 Improve Lab Operations with Six Sigma Metrics. American Society for Clinical Pathology, Chicago.
- Nanda, S.K. and Ray, L. (2013) Quantitative Application of Sigma Metrics in Medical Biochemistry. Journal of Clinical and Diagnostic Research, 7, 2689-2691.
- Coskun, A., Inal, T., Unsal, I. and Serteser, M. (2007) Six Sigma as a Quality Management Tool: Evaluation of Performance in Laboratory Medicine. In: Coskun, A., Ed., Quality Management and Six Sigma, Sciyo, Rijeka,247-263.
- Coskun, A. (2006) Six Sigma and Calculated Laboratory Tests. Clinical Chemistry, 52, 770-771. http://dx.doi.org/10.1373/clinchem.2005.064311
- Baker, A. (2001) Crossing the Quality Chasm: A New Health System for the 21st Century. British Medical Journal, 323, 1192. http://dx.doi.org/10.1136/bmj.323.7322.1192
- Rowe, A.K., De Savigny, D., Lanata, C.F. and Victora, C.G. (2005) How Can We Achieve and Maintain High-Quality Performance of Health Workers in Low-Resource Settings? The Lancet, 366, 1026-1035. http://dx.doi.org/10.1016/S0140-6736(05)67028-6
- Guimarães, A.C., Wolfart, M., Brisolara, M.L.L. and Dani, C. (2012) Causes of Rejection of Blood Samples Handled in the Clinical Laboratory of a University Hospital in Porto Alegre. Clinical Biochemistry, 45, 123-126. http://dx.doi.org/10.1016/j.clinbiochem.2011.10.009
- Jacobsz, L.A., Zemlin, A.E., Roos, M.J. and Erasmus, R.T. (2011) Chemistry and Haematology Sample Rejection and Clinical Impact in a Tertiary Laboratory in Cape Town. Clinical Chemistry and Laboratory Medicine, 49, 2047-2050. http://dx.doi.org/10.1515/CCLM.2011.743
- Lippi, G., Blanckaert, N., Bonini, P., Green, S., Kitchen, S., Palicka, V., Vassault, A.J. and Plebani, M. (2008) Haemolysis: An Overview of the Leading Cause of Unsuitable Specimens in Clinical Laboratories. Clinical Chemistry and Laboratory Medicine, 46, 764-772. http://dx.doi.org/10.1515/CCLM.2008.170
- Mbah, H.A. (2014) Phlebotomy and Quality in the African Laboratory. African Journal of Laboratory Medicine, 3, 4-7. http://dx.doi.org/10.4102/ajlm.v3i1.132
- Hawkins, R.C. (2007) Laboratory Turnaround Time. Clinical Biochemist Reviews, 28, 179-194.
- Goswami, B., Singh, B., Chawla, R., Gupta, V.K. and Mallika, V. (2010) Turn Around Time (TAT) as a Benchmark of Laboratory Performance. Indian Journal of Clinical Biochemistry, 25, 376-379. http://dx.doi.org/10.1007/s12291-010-0056-4
- Westgard, J.O. and Westgard, S.A. (2006) The Quality of Laboratory Testing Today: An Assessment of σ Metrics for Analytic Quality Using Performance Data from Proficiency Testing Surveys and the CLIA Criteria for Acceptable Per- formance. American Journal of Clinical Pathology, 125, 343-354. http://dx.doi.org/10.1309/V50H4FRVVWX12C79
- Chassin, M.R. (1998) Is Health Care Ready for Six Sigma Quality? Milbank Quarterly, 76, 565-591, 510.
- Audu, R.A., Onubogu, C.C., Okoye, R.N., Nwokoye, N.N., Onwuamah, C.K., Musa, A.Z., et al. (2014) Proficiency Testing for HIV, Tuberculosis and Malaria Diagnosis in Clinical Laboratories in Nigeria. African Journal of Laboratory Medicine, 3, 1-9. http://dx.doi.org/10.4102/ajlm.v3i1.102
- Ibrahim, F., Dosoo, D., Kronmann, K.C., Ouedraogo, I., Anyorigiya, T., Abdul, H., Sodiomon, S., Owusu-Agyei, S. and Koram, K. (2012) Good Clinical Laboratory Practices Improved Proficiency Testing Performance at Clinical Trials Centers in Ghana and Burkina Faso. PLoS ONE, 7, e39098.
- Kumasaka, K. (1998) External Quality Assessment for Clinical Microbiology and Good Laboratory Management. Japanese Journal of Clinical Pathology, 46, 124-131.
- Ntshambiwa, K., Ntabe-Jagwer, W., Kefilwe, C., Samuel, F. and Moyo, S. (2014) Translating a National Laboratory Strategic Plan into Action through SLMTA in a District Hospital Laboratory in Botswana. African Journal of Laboratory Medicine, 3, 1-5. http://dx.doi.org/10.4102/ajlm.v3i2.209
- Iliyasu, Z., Abubakar, I.S., Abubakar, S., Lawan, U.M. and Gajida, A.U. (2010) Patients’ Satisfaction with Services Obtained from Aminu Kano Teaching Hospital, Kano, Northern Nigeria. Nigerian Journal of Clinical Practice, 13, 371-378.
- Mindaye, T. and Taye, B. (2012) Patients Satisfaction with Laboratory Services at Antiretroviral Therapy Clinics in Public Hospitals, Addis Ababa, Ethiopia. BMC Research Notes, 5, 184. http://dx.doi.org/10.1186/1756-0500-5-184
- Glick, P. (2009) How Reliable Are Surveys of Client Satisfaction with Healthcare Services? Evidence from Matched Facility and Household Data in Madagascar. Social Science & Medicine, 68, 368-379. http://dx.doi.org/10.1016/j.socscimed.2008.09.053
- Mbah, H., Negedu-Momoh, O.R., Adedokun, O., Ikani, P.A., Balogun, O., Sanwo, O., Ochei, K., Ekanem, M. and Torpey, K. (2014) Implementing and Measuring the Level of Laboratory Service Integration in a Program Setting in Nigeria. PLoS ONE, 9, e107277. http://dx.doi.org/10.1371/journal.pone.0107277
NOTES

*Corresponding author.