Open Journal of Animal Sciences
Vol.3 No.3(2013), Article ID:33906,9 pages DOI:10.4236/ojas.2013.33022
Mitochondrial D-loop diversity of grasscutter (Thryonomys swinderianus Rodentia: Hystricomorpha) in Ghana
![]()
1Wildlife Research Center, Kyoto University, Kyoto, Japan; *Corresponding Author: mmurayama@wrc.kyoto-u.ac.jp
2Department of Animal Science, School of Agriculture, University of Ghana, Legon, Ghana
3Department of Animal Biology and Conservation Science, Faculty of Science, University of Ghana, Legon, Ghana
Copyright © 2013 Christopher Adenyo et al. This is an open access article distributed under the Creative Commons Attribution License, which permits unrestricted use, distribution, and reproduction in any medium, provided the original work is properly cited.
Received 8 April 2013; revised 28 May 2013; accepted 7 June 2013
Keywords: Agro-Ecological Zones; Rodent; D-Loop; Genetic Variation; Thryonomys swinderianus
ABSTRACT
Attempts are being made to domesticate the grasscutter (Thryonomys swinderianus) for commercial production in Sub-Saharan Africa to cater for the protein needs of the people and to satisfy the craving for bushmeat, thereby reducing habitat destruction through hunting. The objective of this study was to determine the genetic diversity of grasscutter populations in Ghana. DNA was extracted from roots of hair samples collected from 84 grasscutters from three agro-ecological zones in Ghana, namely Guinea Savanna (n = 17), Forest (n = 22), and Coastal Savanna (n = 45). Mitochondrial D-loop was sequenced and the diversity was determined across the zones. Out of 26 haplotypes found, 15 were obtained from Guinea Savanna, 7 from Forest and 13 from Coastal Savanna. Haplotype diversities were 0.978, 0.853 and 0.875 respectively for Guinea Savanna, Forest and Coastal Savanna zones. Analysis of molecular variance (AMOVA) revealed significant differentiation between Forest and Savanna populations (FST = 0.14, p < 0.05). Network analysis indicated two clusters, one of which consisted of only Savanna haplotypes. Population neutrality tests showed that Forest and Coastal Savanna populations had been stable while the Guinea Savanna zone population had undergone an expansion (Fu’s FS = −7.132, p < 0.05). The results of this study demonstrated that the Ghanaian populations of grasscutters are highly diverse but are less distinctive.
1. INTRODUCTION
The grasscutter (Thryonomys swinderianus), also known as the cane rat (or aulacode in Francophone West Africa), is a hystricomorph rodent which mainly inhabits the Sudan and the Guinea savanna [1]. It is an herbivorous species found in grassland areas and wooded savanna and is particularly widely distributed at places where its most preferred grasses for feeding are available [2]. In farming areas, it is often regarded as a major crop pest, destroying cassava, maize, sugarcane, and in plantations feeding on young cocoa, coconut and oil palm [2,3]. Wild grasscutters are distributed throughout Ghana, except in rain forests, but they occur in secondary forests and cropped areas leading to continuous expansion of their habitat due to forest clearance for agricultural activities [3].
Surveys in Ghana have revealed that grasscutter meat is the most preferred by “chop bar” operators (cooked food vendors) and consumers [4,5]. Grasscutters are thus hunted aggressively to the point of using poisonous baits and fire to the peril of wildlife habitats, the environment and consumers. The meat is eaten by all classes of people with no religious prohibitions [6], and is also exported to continental Europe and the United States, where it is sold mainly to West Africans living in those regions [7].
Grasscutter domestication started in the 1970s but efforts over the years have met with little success. Rearing attempts suffered from high mortality due to the aggressive nature of the species, referred to as “berserk behavior” [7]. In any domestication process, selection for desirable traits is of great importance to ensure ease of handling and for profitable production in the case of the grasscutter, which is being developed as a mini-livestock in Sub-Saharan Africa to alleviate poverty and to cater for the protein needs of the people. Various aspects of grasscutter biology have been studied in order to better manage the species under domestic conditions. These include reproduction [8-13], nutrition [14,15], parasites and diseases [16-18]. However, much remains to be done on the genetics of the grasscutter production, especially at the molecular level.
Mitochondrial DNA is known to be maternally inherited, and non-recombinant with a high mutation rate [19-21]. The D-loop is a hypervariable, non-coding part of the mitochondrial genome that is approximately 1 kb long and less than 7% of the total mitochondrial genome of most mammals [21]. It is also known to regulate transcription and replication [22]. The above characteristics of the mitochondrial DNA, specifically the Dloop, make it an excellent marker for population genetics studies. Also, because of easier amplification due to the presence of multiple copies within a cell, mitochondrial DNA has been used extensively to study populations and to trace maternal lineages. Sequence analysis of the Dloop as a dominant marker can efficiently reveal genetic structure and differentiation among populations [23,24]. These genetic diversity measures of populations nevertheless serve as useful information for conservation.
Management of populations for conservation requires baseline information such as genetic structure and diversity. Even though the grasscutter is not expected to be endangered in the foreseeable future, increasing our understanding of the population dynamics and genetic diversity of the species is necessary for monitoring. The objective of this study was therefore to assess the genetic diversity among grasscutter populations inhabiting three agro-ecological zones in Ghana. As far as we are aware, no genetic diversity study about the grasscutter has been reported in the literature. This paper therefore reports for the first time, the mitochondrial D-loop diversity of grasscutter populations in Ghana.
2. MATERIALS AND METHODS
2.1. Sample Collection
A total of 84 hair samples were collected from grasscutters in three agro-ecological zones in Ghana; Coastal Savanna (n = 45), Forest (n = 22) and Guinea Savanna (n = 17) (Figure 1). The different zones differ in terms of climatic conditions (e.g. rainfall pattern and temperature) and vegetation type and therefore each was considered to be habitat for a separate population of grasscutters. All samples except semi-domesticated individuals, were collected from centrally located bushmeat markets in the
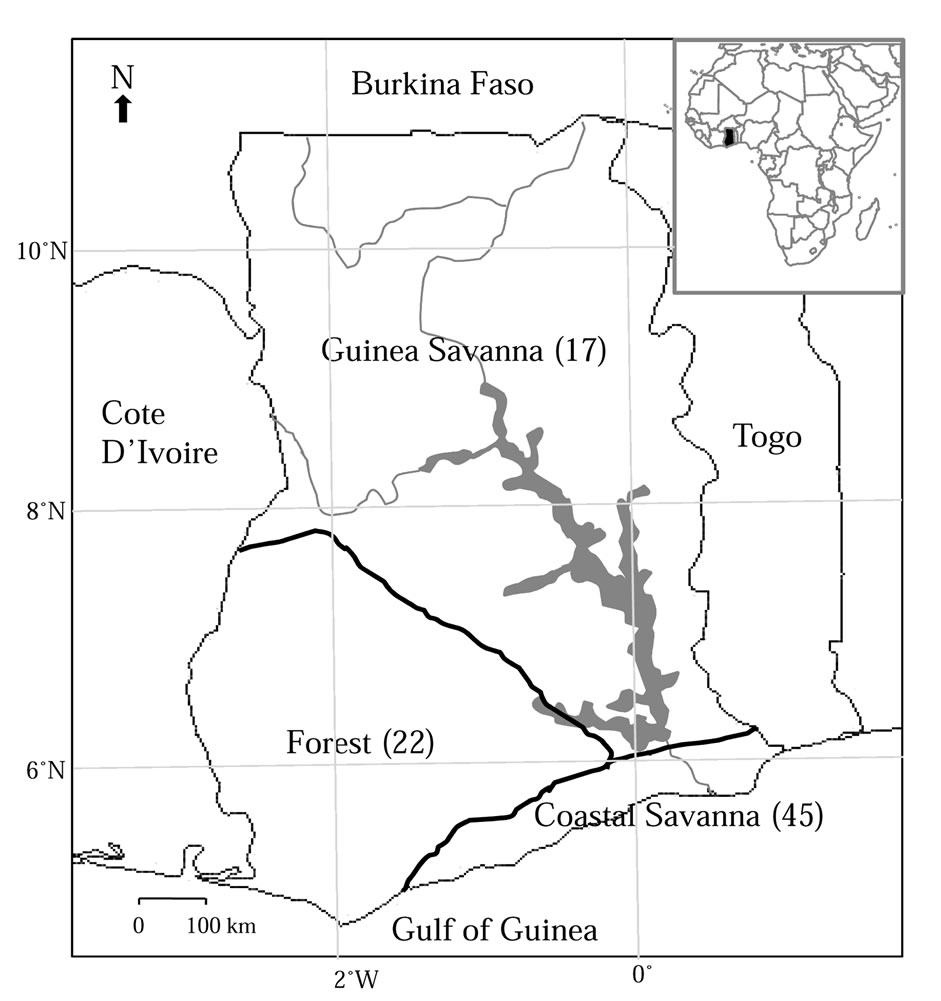
Figure 1. The map of Ghana showing three agro-ecological zones. Numbers in parenthesis indicate number of samples collected in each zone.
different agro-ecological zones. These bushmeat markets were thought to cover wide range and samples were representative of each zone because animals traded were hunted from both far and near. The exact locations could however not be ascertained. Out of the 45 Coastal Savanna samples, 21 were obtained from semi-domesticated unrelated individuals which were kept by farmers. DNA was extracted from the root of 15 - 20 hair pieces of each sample using Instagene Matrix (Bio-Rad Laboratories, USA), quantified using NanoDrop Spectrophotometer (Thermo Scientific, USA) and stored at −30˚C until ready for use.
2.2. PCR Amplification and Sequencing
Mitochondrial displacement loop (D-loop) was amplified in a PCR using CRmtDF (5’-CCAACTCCCAAAGCTGATGT-3’) as the forward primer, and CRmtDR (5’-GGCACCAACATCATCACAAA-3’) as the reverse primer. These primers were designed with a registered sequence of the grasscutter (Accession no. AJ301644) [25] using Primer 3 software and could amplify 501 bp of the D-loop. The PCR mixture contained 0.75 U of LA-Taq DNA polymerase (TaKaRa, Shiga, Japan), PCR buffer, 400 µM of each dNTP, 0.4 µM each of forward and reverse primers, 0.1 µg of T4 Gene 32 Protein (Nippon Gene, Japan) and 20 ng of template DNA in a total volume of 15 µl. PCR cycling conditions consisted of an initial denaturation of 95˚C for 2 min, followed by 35 cycles of 95˚C for 30 sec, 55˚C for 30 sec, 74˚C for 1 min and a final extension of 74˚C for 10 min. Aliquots of 5 µl of the PCR products were electrophoresed on 1.5% agarose gel to check amplification. DNA bands were visualized after Ethidium Bromide staining under UV light, and expected size was determined in relation to a DNA size standard. The remaining aliquots were purified using High Pure PCR purification kit (Roche, Manheim, Germany) and sequenced using Big Dye Terminator ver. 3.1 cycle sequencing kit (Applied Biosystems, Foster City, CA, USA) according to the manufacturers protocol and electrophoresed on an ABI PRISM 3130xl sequencer (Applied Biosystems).
Both forward and reverse complements of the reverse sequences were aligned to get a consensus sequence using MEGA version 5 [26]. Primer sequences were then deleted to obtain 501 bp of the D-loop spanning from position 15,661 to 16,161 of the mitochondrial genome [25], and covering the rapidly evolving extended-termination associated sequences (ETAS) domain and part of the central domain (CD) of the D-loop [21].
2.3. Data Analysis
Arlequin ver. 3.5 [27] was used to determine the number of haplotypes, haplotype diversity and nucleotide diversity in each agro-ecological zone. Haplotype diversity indicates genetic diversity within populations and nucleotide diversity is estimated as the function of the number of polymorphic sites and the frequency of transition or transversion and insertion or deletion within the population [23]. A haplotype network was constructed using outputs from TCS ver. 1.21 [28] and Network software ver. 4.6 (www.fluxus-engineering.com). Analysis of molecular variance (AMOVA) was conducted in Arlequin, considering genetic distance between haplotypes and their frequencies to determine the variation among and within populations. It was assumed that the three populations formed one group and therefore the pooled flat genetic structure in Arlequin was chosen. In order to increase the level of accuracy, 10,000 random permutations were performed. The gamma value was set at 0 as this is proposed when mutation rates cannot be assumed to be uniform [27]. This is usually the case for mtDNA D-loop and most especially for rodents because they have short generation intervals [29,30]. The significance (p-value) of the fixation index, which is analogous to the F-value in the conventional analysis of variance, was estimated as the probability that a random value is greater than or equal to the observed value. To determine which populations were genetically different from each other, pairwise FST values which show genetic distance between given pair of populations were computed [31].
According to Harpending [32], a mismatch distribution is a measure of the distribution of pairwise differences among non-recombinant DNA sequences in a population. This distribution is multimodal, smooth and has a peak for populations that have undergone expansion but erratic or ragged for populations in equilibrium [32-34]. Past demographic events are known to leave footprints in the DNA sequence of individuals in a population. To get a glimpse of the demographic history of the grasscutter populations, mismatch distributions (10,000 bootstrap replicates) were determined and Tajima’s D and Fu’s FS neutrality indices were computed under the infinite site model as implemented in the Arlequin software [27]. The number of simulated samples under the infinite site model was 10,000.
To examine the relationship between geographic distance and genetic distance (equilibrium between gene flow and genetic drift), isolation-by-distance analysis was conducted as implemented in GenAlex ver. 6.41 [35]. Coordinates between pairs of sampling sites were converted into geographic distances, and a Mantel test was performed to assess the correlation between geographic distance and pairwise FST values.
3. RESULTS
3.1. Haplotype Diversity
Guinea Savanna samples had 21 polymorphic sites whereas Coastal Savanna and Forest zones had 15 and 12 polymorphic sites, respectively. In all, there were 23 variable sites including five singletons and 18 parsimonious informative sites. All polymorphic sites were transitions except for one transversion at position 16,125 in a Guinea Savanna zone haplotype. Out of a total of 26 haplotypes, 15 were from Guinea Savanna, seven from Forest and 13 from the Coastal Savanna (Table 1). The sequences were deposited in Genbank under the accession numbers AB675385 to AB675410. The Forest and Coastal Savanna zones shared three haplotypes whilst five haplotypes were shared between Coastal Savanna and Guinea Savanna. Forest and Guinea Savanna also had three haplotypes in common. In all, only two haplotypes were found to be common to the three agro-ecological zones. Haplotype diversities were 0.978, 0.853 and 0.875 for Guinea Savanna, Forest and Coastal Savanna zones respectively (Table 2). Even though there were fewer samples from the Guinea Savanna zone, the Guinea Savanna zone was found to have the highest haplotype diversity compared to the Forest and the Coastal Savanna zones.
Nucleotide diversity was 0.012 for both Guinea Savanna and Coastal Savanna zones which is almost twice as that of the Forest zone (0.007) (Table 2). AMOVA results indicated that 85.79% of the total variation was within populations whilst the remaining 14.21% was
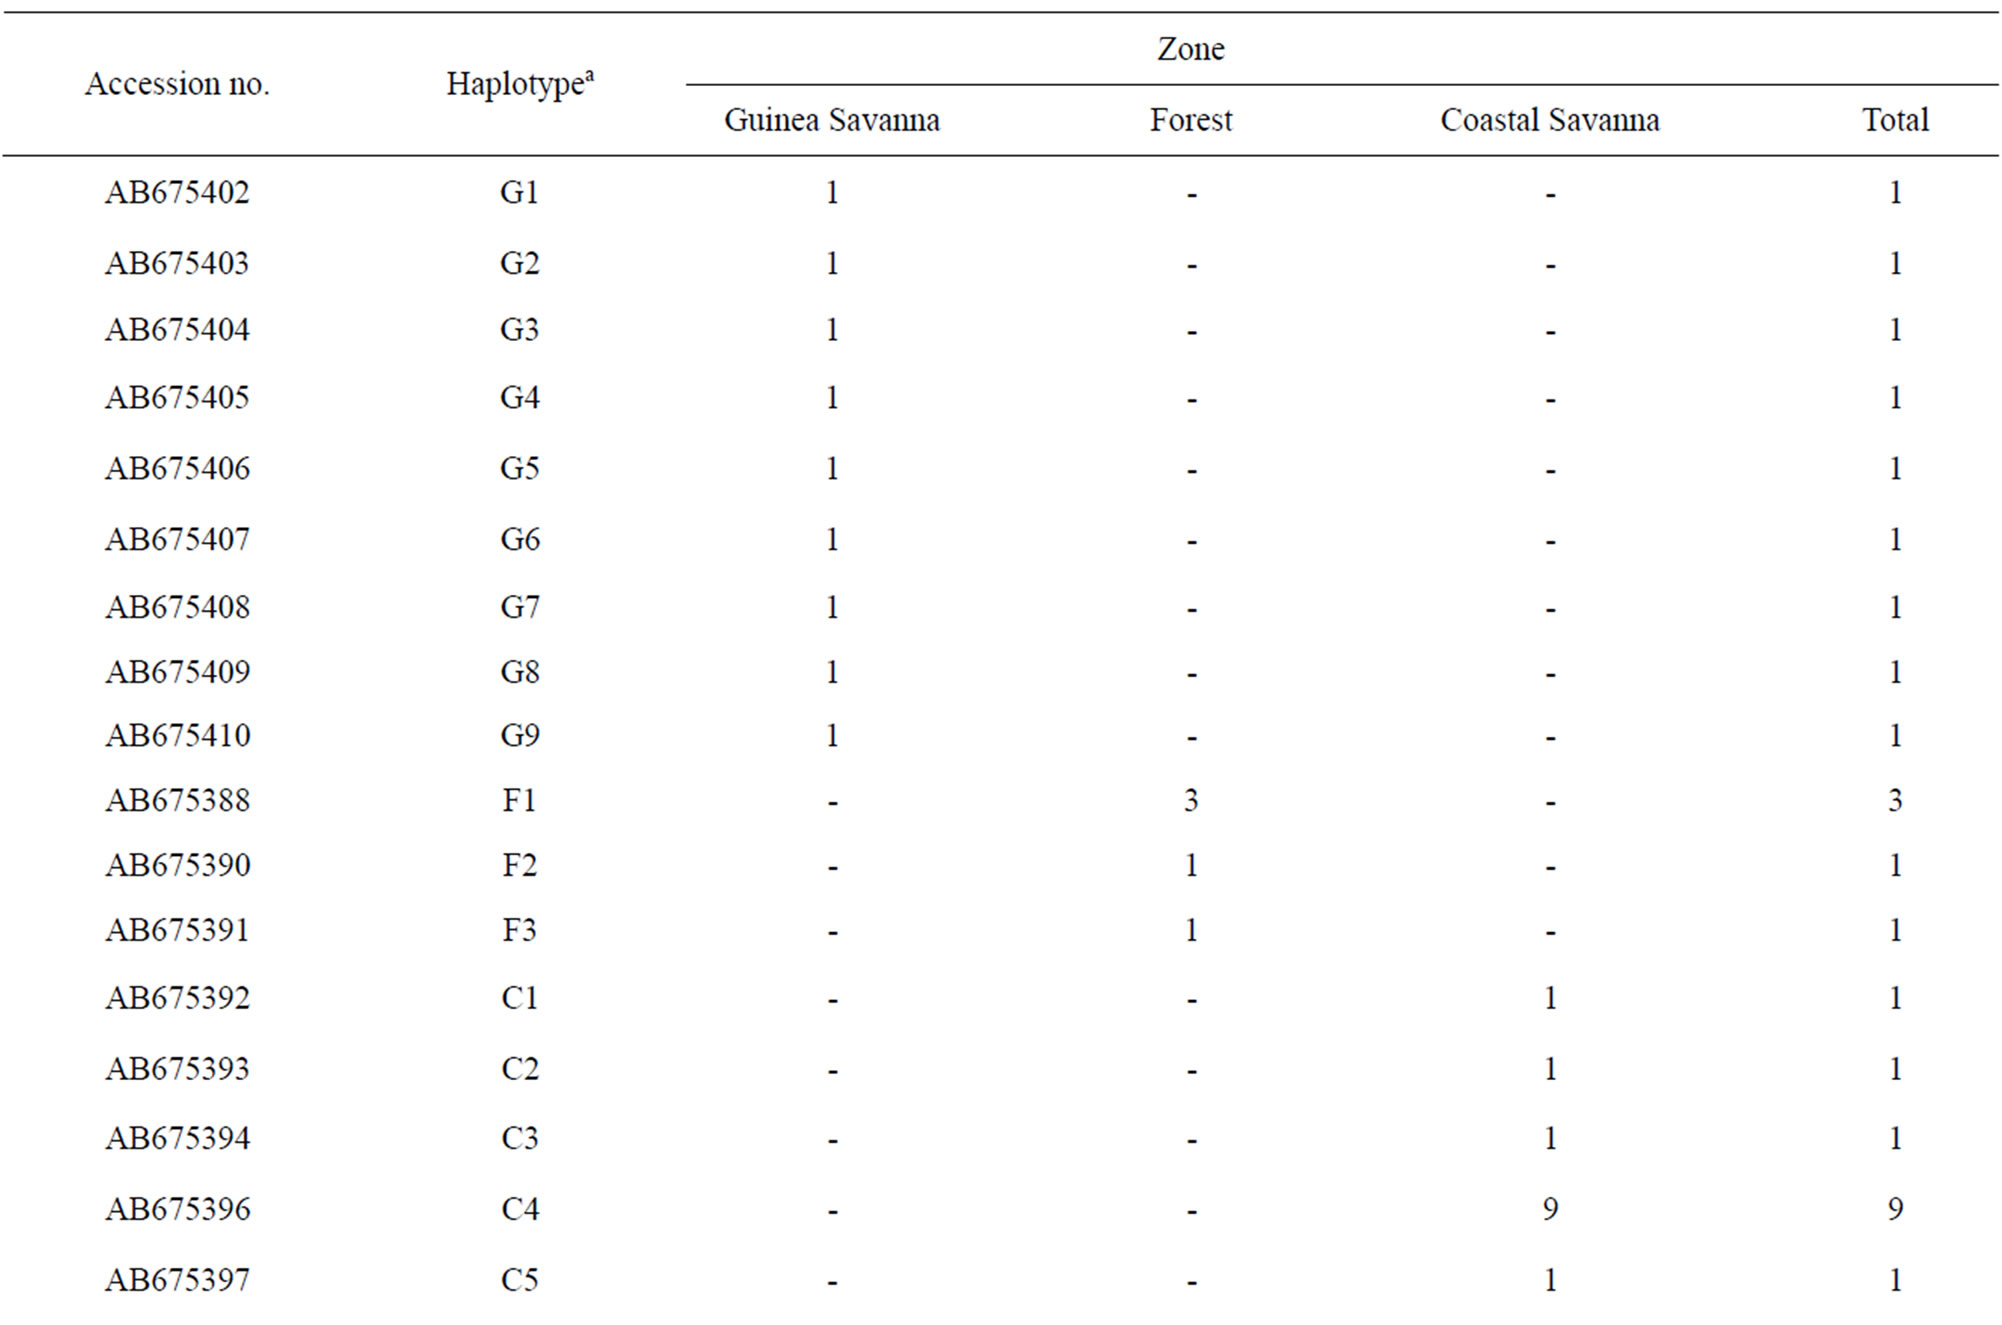
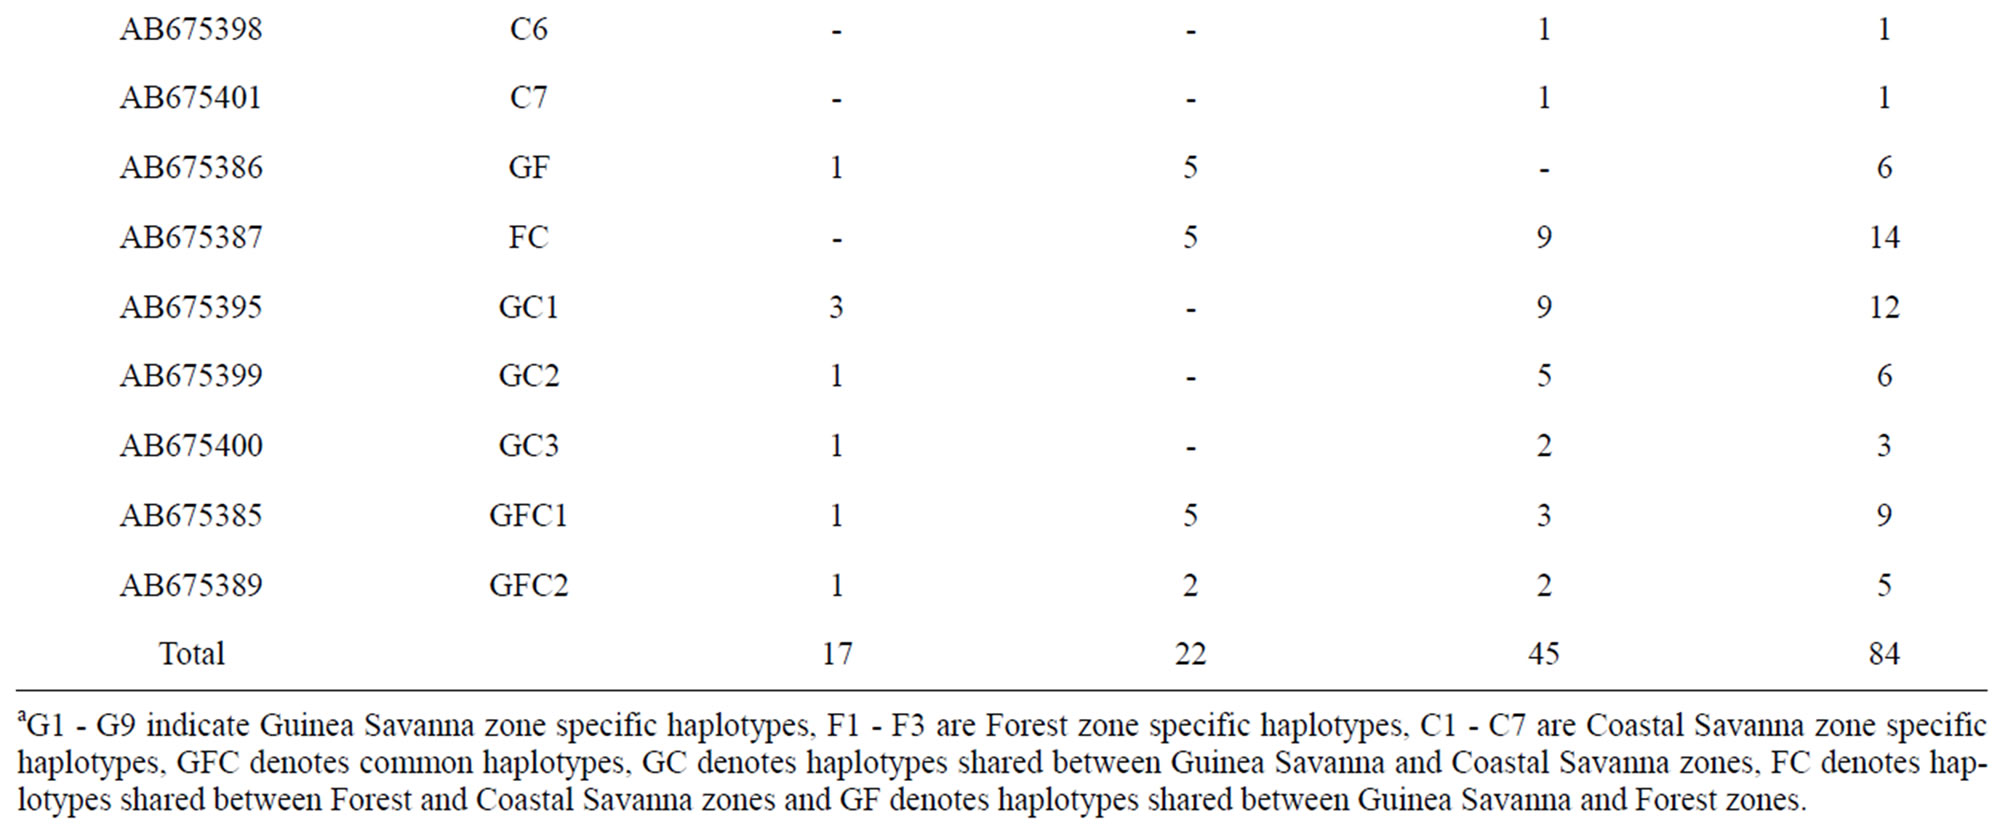
Table 1. Haplotypes and their frequencies in each population.

Table 2. Genetic diversity and indices of population neutrality across the three agro-ecological zones.
among populations (Table 3). The fixation index resulting from the AMOVA analysis, which gives an indication of population differentiation, was found to be highly significant (p < 0.001) even though the larger part of the variation was within populations. This indicated that the populations are less structured. In terms of pairwise FST, Guinea Savanna and Coastal Savanna had the lowest FST value (0.052) indicating that they are the closest, while Forest and Coastal Savanna had the highest value (Table 4). The results indicated significant genetic differentiation (p < 0.05) between Forest and Coastal Savanna and also between Forest and Guinea Savanna. There was however no significant differentiation between Guinea Savanna and Coastal Savanna zone haplotypes.
Figure 2 presents a haplotype network showing two clusters, one of which is fairly simple and consists of only Savanna haplotypes (Cluster A), and the other which harbors the two common haplotypes, consists of haplotypes from all zones, and is more complex (Cluster B). Such a network shows the relatedness of the different haplotypes based on nucleotide substitutions. It can be seen that the Savanna haplotypes in Cluster A are more closely related to each other than Forest haplotypes. Haplotypes from both savanna zones can be seen in both clusters whereas the Forest haplotypes are found only in the complex cluster. This is indicative of the presence of two haplo-groups within the two savanna zones.
3.2. Mismatch Distribution and Population Neutrality
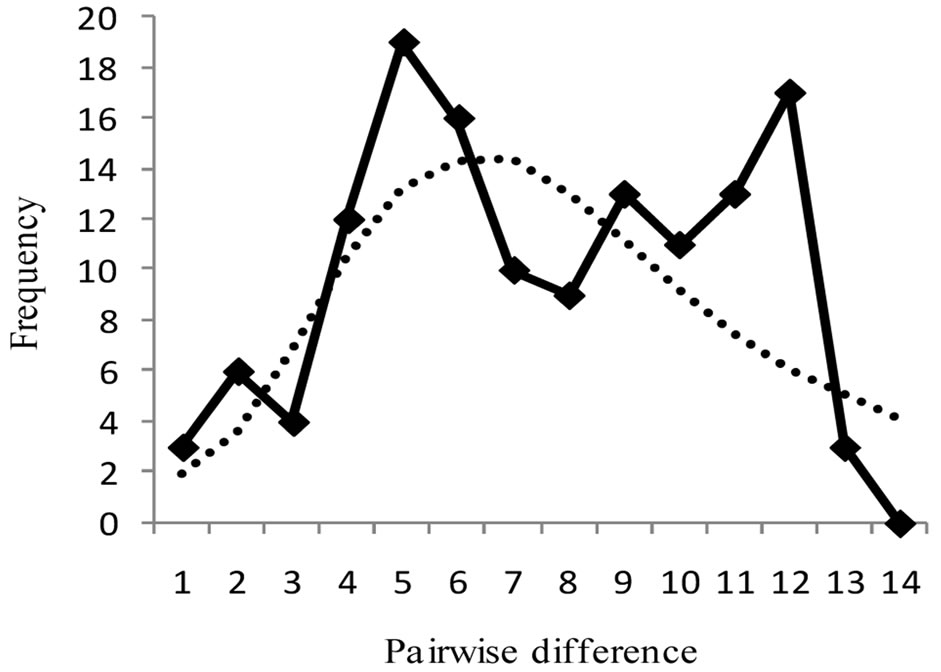
Figure 3 shows mismatch distributions of the three populations, with the observed mismatch distribution being multimodal for all populations, though not significant. Harpending’s raggedness index, rg, Tajima’s D and Fu’s FS are presented in Table 2. For both rg and D,
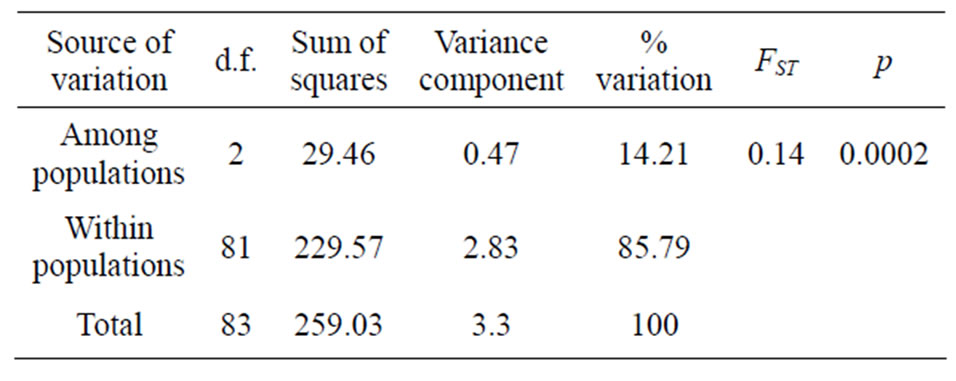
Table 3. Results of analysis of molecular variance (AMOVA).
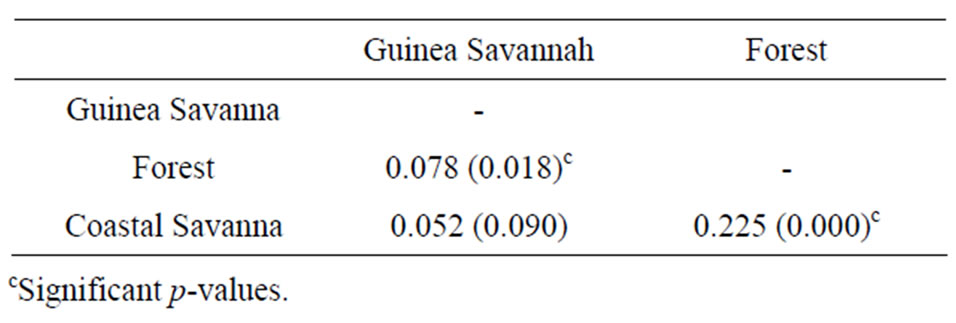
Table 4. Matrix of pairwise FST values for the three agro-ecological zones.
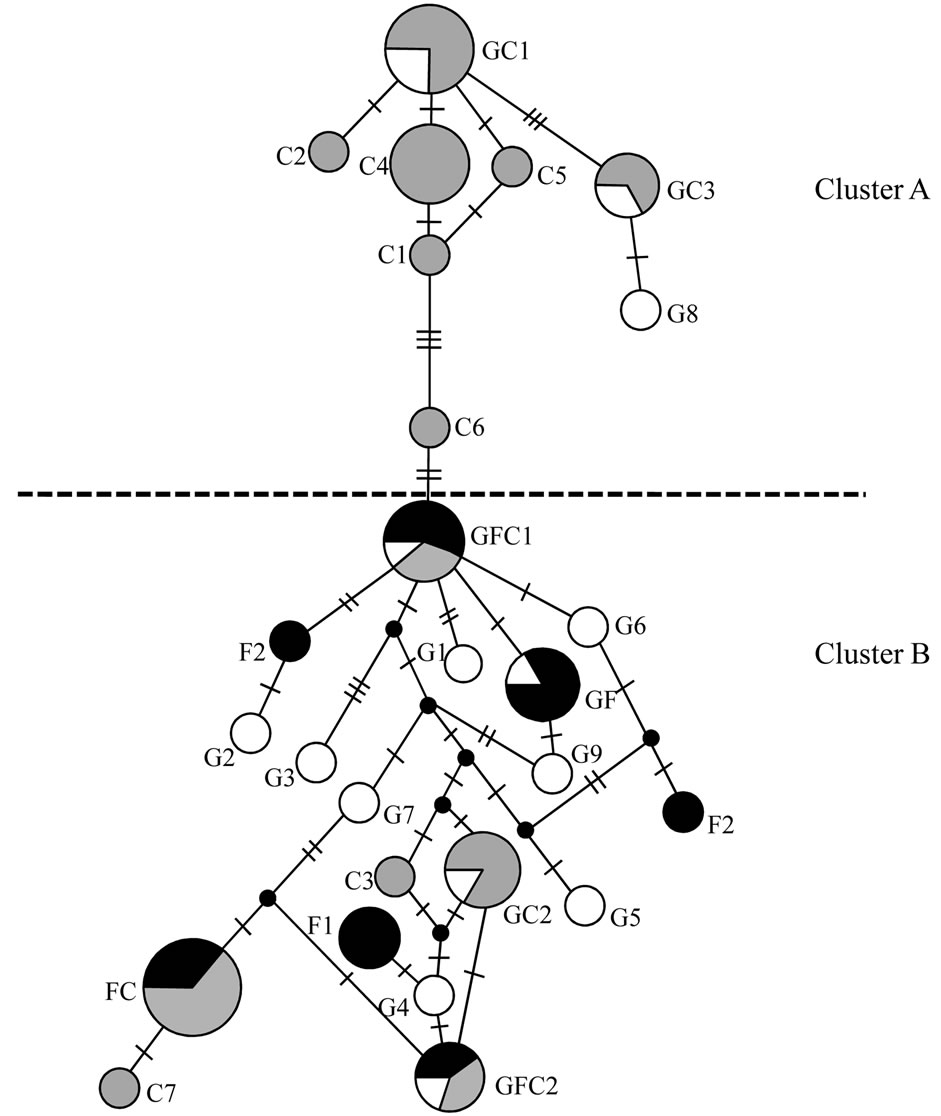
Figure 2. Network among haplotypes. G1 - G9 indicate Guinea Savanna zone specific haplotypes (open circles), F1 - F3 are Forest zone specific haplotypes (black circles), C1 - C7 are Coastal Savanna zone specific haplotypes (gray circles), GFC denotes common haplotypes, GC denotes haplotypes shared between Guinea Savanna and Coastal Savanna zones, FC denotes haplotypes shared between Forest and Coastal Savanna zones and GF denotes haplotypes shared between Forest and Guinea Savanna zones. The proportions of individuals from each agro-ecological zone in the common and shared haplotypes are shown as slices. The size of the circle is proportional to the total number of individuals of that haplotype. The crossbars show the number of substitution between haplotypes whilst the black nodes indicate missing haplotypes.
none of the zones was found to be significant (p > 0.05). These statistical tests therefore indicate that the populations were under neutral selection. Fu’s FS was however significant for Guinea Savanna zone (p < 0.05), which is an indication of a recent past expansion event in this population [36]. A Mantel test conducted to assess the equilibrium between genetic drift and gene flow, was found to be non-significant (Rxy = 0.022, p > 0.05).
4. DISCUSSION
In this study, it is not unexpected that 26 different haplotypes were found coupled with high haplotype diversities (0.85 - 0.97) across the three zones, owing to the fact that the D-loop has a high mutation rate [21]. These results are comparable to a previous report on a South American hystricomorph rodent, Microcavia australis [37] which indicated 0.70 - 0.93 for haplotype diversity (h) and 0.0006 - 0.0095 for nucleotide diversity
 (a)
(a) 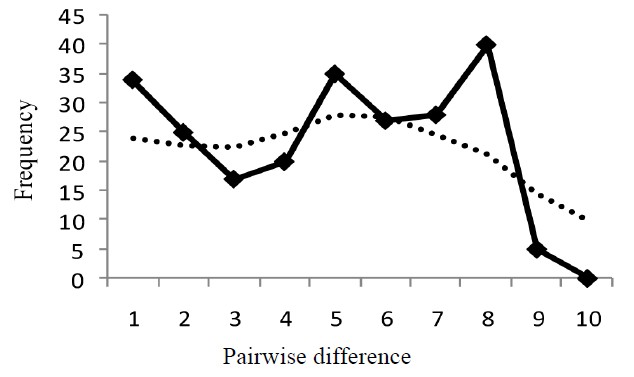 (b)
(b) 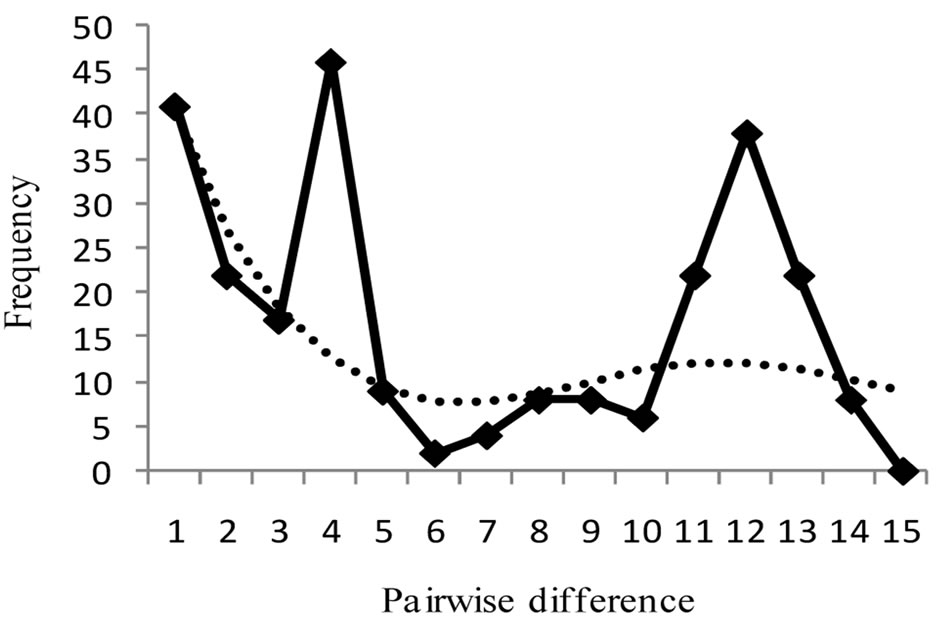 (c)
(c)
Figure 3. Harpendings mismatch distribution showing observed and simulated frequencies of pairwise differences for each population. (a) Guinea Savanna zone; (b) Forest zone; (c) Coastal Savanna zone. Observed frequency and simulated frequency are shown by thick line and dotted line, respectively.
(π). The results of our study are however higher than that of [38] on Laonastes aenigmamus in Laos (h = 0.79). According to [39], lack of gene flow diminishes genetic diversity. Also, genetic drift, dispersal pattern and vicariance events such as habitat fragmentation may all influence genetic structure and diversity of mammals. For instance [37] found highly differentiated highland and lowland populations of M. australis with almost all haplotypes being unique to populations, indicating very restricted levels of gene flow between the populations. Similar results were obtained by Ojeda [40] on another rodent, Tympanoctomys barrerae, in the same region.
The possible reason for the higher haplotype diversities could be that there are no or limited barriers to gene flow as grasscutters are good swimmers [2] and can cross water bodies which might be perceived as barriers to dispersal. It has been observed that grasscutters in Ghana continue to expand their habitats in the Forest zone due to forest clearance for farming activities [2]. This possible dispersal could account for the two common haplotypes found among the three zones. We hypothesize that there is unrestricted gene flow among the populations especially between the Guinea Savanna and Coastal Savanna zones. More extensive sampling focusing on social structure will however be necessary to test this hypothesis. Another possible reason for the high haplotype diversities could be the very high population of grasscutters which existed in the recent past or presently exist in the country. This assertion could be supported with the fact that grasscutters can be found in almost every part of Ghana [3]. Grasscutters are predominantly savanna species [1] which thrive on grasses and succulent stems, hence the name “grasscutter”. It is probable that the Forest population of grasscutters arises out of a recent colonization of the Forest zone by grasscutters from the Guinea Savanna zone, hence the genetic distance between Forest and Guinea Savanna is closer than the Forest and Guinea Savanna than Forest and Coastal Savanna populations. According to [41], lack of equilibrium between genetic drift and gene flow or absence of isolation by distance, which is the case in this study, may be due to a recent colonization event, in turn linked to human impact in the Forest zone. Agriculture-related activities such as forest clearance, bush burning and cultivation of crops result in expansion of grassland areas within the Forest zone and ultimately forest fragmentation. These farmlands and grassland areas have become suitable habitats for the grasscutter.
Non-significant population differentiation between the two Savanna zones suggests that there is direct gene flow between the Guinea Savanna and the Coastal Savanna zones. This genetic distance reflects a dispersal pattern; possibly from the Guinea Savanna zone to the Coastal Savanna zone. This dispersal pattern might be a result of limited availability of feed resources due to harsh climatic conditions in the Guinea Savanna zone, characterised by relatively higher temperatures and a single rainy season between July and October [42]. Longer periods of aridity in this zone coupled with higher temperatures, may cause grasses to dry up. More so, the Guinea Savanna zone experiences frequent bushfires as a result of bush burning related to farming activities or as a hunting practice. This reduces the amount of feed resources available, forcing groups of individuals to migrate to places where feed resources are readily available.
The Ghanaian populations of grasscutters, except for those in the Guinea Savanna zone, have been stable as observed from the mismatch distributions. [32] noted that populations that have undergone expansion show mismatch distributions that are multimodal, but populations that are stable have erratic distributions. None of the three zones was significant for Harpending’s raggedness index, rg and Tajima’s D. The results of mismatch distribution from the three populations reflect a multimodal distribution (Figure 3), including the Guinea Savanna. The difference is however found in the Fu’s FS test where the Guinea Savanna population displays a significant negative value (p < 0.05), suggesting a demographic expansion event. It is known that Fu’s FS has more statistical power than Tajima’s D [43] and it is sensitive to other demographic events such as population bottlenecks and genetic hitchhiking [36]. Results should however be interpreted cautiously because the different tests have different sensitivities [22]. According to [44], populations with bottlenecks show low variation in mitochondrial DNA. A population bottleneck might not be the likely reason for the significant FS. Genetic hitchhiking is also ruled out because mitochondrial DNA is nonrecombinant [21]. A past expansion event could account for this significance and this could be supported by the relatively higher haplotype diversity observed in the Guinea Savanna zone compared to other populations. [36] however, cautioned that one cannot make a definite conclusion by using one gene and that a combination of nuclear and mitochondrial markers may be necessary.
[40] suggested that lack of isolation-by-distance pattern could be due to recent habitat expansion or colonization of new areas and inconsistent gene flow. We did not find any pattern of isolation-by-distance in our study, which supposes that an expansion event could influence this result. It was possible that the recent population expansion portrayed by the Guinea Savanna zone as found in the Fu’s neutrality test and a recent colonization of the Forest zone as deduced from the results influenced the population structure and consequently the equilibrium between gene flow and genetic drift.
Within the Guinea Savanna and Coastal Savanna zones, double peaks were observed from the mismatch distribution (Figure 3). Even though the population history of the grasscutter in Ghana is not known, this result could be an indication of the coexistence of two haplo-groups in the two savanna zones. This tendency which is also clearly evident from the network analysis (Figure 2) is not profound in the Forest zone probably because of habitat limitations. This could also explain why the genetic differentiation between the Guinea Savanna and Coastal Savanna populations is not significant. The two populations may therefore be considered as one Savanna population.
The grasscutter is a “Least Concern” species according to the IUCN Red List [45] and therefore does not require to be targeted for conservation at the present time. It is however envisaged that recent human population expansion in Ghana coupled with rampant hunting, if not checked, might cause this species to be endangered in the future. Also, bushfire associated with the hunting of the grasscutters may destroy the habitat of many wildlife species. This study has therefore shed some light on the genetic diversity of grasscutters in Ghana, and this information may be valuable for future conservation efforts. It has also revealed the possibility that Guinea Savanna zone population of grasscutters has undergone population expansion in the past. It may be worthwhile to confirm these results with microsatellite analysis of the populations since mitochondrial and nuclear markers can sometimes present conflicting results due to different modes of inheritance and rates of evolution [46]. As a preliminary study and the first of its kind in grasscutters, we found high D-loop diversity among grasscutter populations in Ghana. However, a more detailed study focusing on genetic structure and dispersal patterns within each agroecological zone would be necessary to ascertain these results. As domestication of this species is being intensified because of its good prospects as a mini-livestock [4,7,10], information presented in this paper will serve as a baseline for further population genetics studies.
5. ACKNOWLEDGEMENTS
The authors thank Dr. Phyllis Addo of Noguchi Memorial Institute for Medical Research, University of Ghana for providing samples from some of her experimental animals. Thanks also go to Ghanaian farmers for allowing samples to be taken from their animals, as well as to Mr. Bright Adenyo for assisting in sample collection from the different agroecological zones. Dr. Eiji Inoue of the Graduate School of Science, Kyoto University gave invaluable suggestions for this study and Prof. D. K. Attuquayefio of the Department of Animal Biology and Conservation Sciences, University of Ghana provided useful comments on the manuscript, for which we are most grateful.
This work was supported by the Ministry of Education, Culture, Sports, Science and Technology (MEXT) with a Grant-in-aid for Science Research (grant number 21310150 to MI-M), the Global Center of Excellence Program of Kyoto University “Formation of a Strategic Base for Biodiversity and Evolutionary Research: from Genome to Ecosystem (A06)”, the Asia and Africa Science Platform Program under the Japanese Society for the Promotion of Science and Environment Research and Technology Development Fund (D-1007).
REFERENCES
- Jori, F., Mensah, G.A. and Adjanohoun, E. (1995) Grasscutter production: An example of rational exploitation of wildlife. Biodiversity and Conservation, 4, 257-265. doi.org/10.1007/BF00055972
- Opara, M.N. (2010) The Grasscutter I: A livestock of tomorrow. Research Journal of Forestry, 4, 119-135. doi.org/10.3923/rjf.2010.119.135
- Annor, S.K., Adu, E.K., Donkor, J., Otsyina, H.R. and Ahiaba, J. (2009) Grasscutter production: A handbook. GTZ/MOAP, Accra.
- Ntiamoa-Baidu, Y. (1998) Wildlife development plan 1998-2003, Vol. 6: Sustainable use of Bushmeat. Wildlife Department, Ministry of Lands and Forestry, Accra.
- Owusu, E.H., Ntiamoa-Baidu, Y. and Ekpe, E.K. (2006) The dependence of local people on bushmeat in the Afadjato and Agumatsa Conservation Area, Ghana. Nature & Faune, 21, 33-44.
- Opara, M.N. (2010b) Grasscutter: The haematology and major parasites. Research Journal of Parasitology, 5, 214-223. doi.org/10.3923/jp.2010.214.223
- Adu, E.K., Alhassan, W.S. and Nelson, F.S. (1999) Smallholder farming of the greater cane rat, Thryonomys swinderianus, Temminck, in southern Ghana: A baseline survey of management practices. Tropical Animal Health and Production, 31, 223-232. doi.org/10.1023/A:1005267110830
- Asibey, E.O.A. (1981) Maternal and neo-natal weight in the grasscutter, Thryonomys swinderianus (Temminck) in Ghana. African Journal of Ecology, 19, 355-360. doi.org/10.1111/j.1365-2028.1981.tb01072.x
- Adu, E.K. and Yeboah, S. (2000) The efficacy of the vaginal plug formation after mating for pregnancy diagnosis, and embryonic resorption in utero in the greater cane rat (Thryonomys swinderianus, Temminck). Tropical Animal Health and Production, 32, 1-10. doi.org/10.1023/A:100524480092
- Addo, P., Dodoo, A., Adjei, S., Awumbila, B. and Awotwi, E. (2002) Determination of the ovulatory mechanism of the grasscutter. Animal Reproduction Science, 71, 125- 137. doi.org/10.1016/S0378-4320(01)00184-1
- Adu, E.K. (2003) Patterns of parturition and mortality in weaned greater cane rats (Thryonomys swinderianus, Temminck). Tropical Animal Health and Production, 35, 425-431. doi.org/10.1023/A:1025815528916
- Owusu, B.A., Adu, E.K., Awotwi, E.K. and Awumbila, B. (2010) Embryonic resorption, litter size and sex ratio in the grasscutter, Thryonomys swinderianus. Animal Reproduction Science, 118, 366-371. doi.org/10.1016/j.anireprosci.2009.08.013
- Henry, A.J. (2011) Reproductive performance of grasscutter does at first parity and growth performance of their F1 generation. Asian Journal of Animal Science, 5, 289- 295. doi.org/10.3923/ajas.2011.289.295
- Annor, S.Y., Kagya-Agyemang, J.K., Abbam, J.E.Y., Oppong, S.K. and Agoe, I.M. (2008) Growth performance of grasscutter (Thryonomys swinderianus) eating leaf and stem fractions of Guinea grass (Panicum maximum). http://www.lrrd.org/lrrd20/8/anno20125.htm
- Karikari, P.K. and Nyameasem, J.K. (2009) Productive performance and carcass characteristics of captive grasscutters (Thryonomys swinderianus) fed concentrate diets containing varying levels of guinea grass. World Applied Science Journal, 6, 557-563.
- Oboegbulem, S.I. and Okoronkwo, I. (1990) Salmonallae in the African great cane rat (Thryonomys swinderianus ). Journal of Wildlife Diseases, 26, 199-121.
- Opara, M.N. and Fagbemi, B.O. (2008) Occurence and prevalence of gastro-intestinal helminthes in the wild grasscutter (Thryonomys swinderianus, Temminck). Life Sciences Journal, 5, 50-56.
- Kankam, T., Adu, E.K. and Awumbila, B. (2009) Gastrointestinal parasites of the grasscutter (Thryonomys swinderianus, Temminck 1827) on the Accra Plains of Ghana. African Journal of Ecology, 47, 416-421. doi.org/10.1111/j.1365-2028.2008.01020.x
- Avise, J.C., Arnold, J., Ball, R.M., Bermingham, E., Lamb, T., Neigel, J.E., Reeb, C.A. and Saunders, N.C. (1987) Intraspecific phylogeography: The mitochondrial DNA bridge between population genetics and systematics. Annual Review of Ecology and Systematics, 18, 489- 522.
- Chen, J.Z. and Herbert, P.D.N. (1999) Intraindividual sequence diversity and a hierarchical approach to the study of mutations. Mutation Research, 434, 205-217. doi.org/10.1016/S0921-8777(99)00029-4
- Larizza, A., Pesole, G., Reyes, A., Sbisa, E. and Saccone, C. (2002) Lineage specificity of the evolutionary dynamics of the mtDNA D-loop region in rodents. Journal of Molecular Evolution, 54, 145-155. doi.org/10.1007/s00239-001-0063-4
- Abyankar, A., Park, H.-B., Tonolo, G. and Luthman, H. (2009) Comparative sequence analysis of the non-proteincoding mitochondrial DNA of inbred rat strains. PLoS ONE, 4, e8148. doi.org/10.1371/journal.pone.0008148
- Hirota, T., Hirohata, T., Mashima, H., Satoh, T. and Obara, Y. (2004) Population structure of the large field mouse, Apodemus speciosus (Rodentia: Muridae), in suburban landscape, based on mitochondrial D-loop sequences. Molecular Ecology, 13, 3275-3282. doi.org/10.1111/j.1365-294X.2004.02324.x
- Meyer, J., Kohnen, A. and Brandl, R. (2009) Genetic differentiation in an arboreal rodent from African savannas. African Journal of Ecology, 48, 831-836.
- Mouchaty, S.K., Catzeflis, F., Jankel, A. and Arnason, U. (2001) Molecular evidence of African Phiomorpha-South American Caviomorpha clade and support for Hystricognathi based on the complete mitochondrial genome of the cane rat (Thryonomys swinderianus). Molecular Phylogenetics and Evolution, 18, 127-135. doi.org/10.1006/mpev.2000.0870
- Tamura, K., Peterson, D., Peterson, N., Stecher, G., Nei, M. and Kumar, S. (2011) MEGA5: Molecular evolutionary genetics analysis using maximum likelihood, evolutionary distance, and maximum parsimony methods. Molecular Biology and Evolution, 28, 2731-2739. doi.org/10.1093/molbev/msr121
- Excoffier, L. and Lischer, H.E.L. (2010) Arlequin suite ver 3.5: A new series of programs to perform population genetics analyses under Linux and Windows. Molecular Ecology Resources, 10, 564-567. doi.org/10.1111/j.1755-0998.2010.02847.x
- Clement, M., Posada, D. and Crandall, K.A. (2000) TCS: A computer program to estimate gene genealogies. Molecular Ecology, 9, 1657-1660.
- Bromham, L., Rambaut, A. and Harvey, P.H. (1996) Determinants of rate variation in mammalian DNA sequence evolution. Journal of Molecular Evolution, 43, 610-621. doi.org/10.1007/BF02202109
- Li, W.H., Ellsworth, D.L., Krushkal, J., Chang, B.H. and Hewett-Emmett, D. (1996) Rates of nucleotide substitution in primates and rodents and the generation-time effect hypothesis. Molecular Phylogenetics and Evolution, 5, 182-187. doi.org/10.1006/mpev.1996.0012
- Reynolds, J., Weir, B.S. and Cockerham, C.C. (1983) Estimation for the coancestry coefficient: Basis for a short-term genetic distance. Genetics, 105, 767-779.
- Harpending, R.C. (1994) Signature of ancient population growth in a low-resolution mitochondrial DNA mismatch distribution. Human Biology, 66, 591-600.
- Schneider, S. and Excoffier, L. (1999) Estimation of demographic parameters from the distribution of pairwise differences when the mutation rates vary among sites: Application to human mitochondrial DNA. Genetics, 152, 1079-1089.
- Excoffier, L. (2004) Patterns of DNA sequence diversity and genetic structure after a range expansion: Lessons from the infinite-island model. Molecular Ecology, 13, 853-864. doi.org/10.1046/j.1365-294X.2003.02004.x
- Peakall, R. and Smouse, P.E. (2006) GENALEX 6: Genetic analysis in excel. Population genetic software for teaching and research. Molecular Ecology Notes, 6, 288- 295. doi.org/10.1111/j.1471-8286.2005.01155.x
- Fu, Y.-X. (1997) Statistical tests of neutrality of mutations against population growth, hitchhiking and backgroud selection. Genetics, 147, 915-925.
- Sassi, P.L., Chiappero, M.B., Borghi, C. and Gardenal, C.N. (2011) High genetic differentiation among populations of the small cavy Microcavia australis occupying different habitats. Journal of Experimental Zoology, 315, 337-348. doi.org/10.1002/jez.680
- Riviere-Dobigny, T., Herbreteau, V., Khamsavath, K., Douangboupha, B., Morand, S., Michaux, J.R. and Hugot, J.P. (2011) Preliminary assessment of the genetic population structure of the enigmatic species Laonastes aenigmamus (Rodentia: Diatomyidae). Journal of Mammalogy, 92, 620-628. doi.org/10.1644/10-MAMM-A-028.1
- Lacy, R.C. (1987) Loss of genetic diversity from managed population: Interacting effects of drift, mutation, immigration, selection and population subdivision. Conservation Biology, 1, 143-158. doi.org/10.1111/j.1523-1739.1987.tb00023.x
- Ojeda, A.A. (2010) Phylogeography and genetic variation in the South American rodent Tympanoctomys barrerae (Rodentia: Octodontidae). Journal of Mammalogy, 91, 302-313. http://dx.doi.org/10.1644/09-MAMM-A-177.1
- Slatkin, M. (1993) Isolation by distance in equilibrium and non-equilibrium populations. Evolution, 47, 264-279.
- Bennett-Lartey, S.O., Ayerno, G.S., Markwei, C.M., Asante I.K., Abbiw, D.K., Boateng, S.K., Anchirinah, V.M. and Ekpe, P. (2002) Contribution of home gardens to in situ conservation of plant genetic resources farming systems in Ghana. Proceedings of the Second International Home Gardens Workshop, International Plant Genetic Resources Institute, Rome, 83-96.
- Ramos-Onsins, S.E. and Rozas, J. (2002) Statistical properties of new neutrality tests against population growth. Molecular Biology and Evolution, 19, 2092-2100. doi.org/10.1093/oxfordjournals.molbev.a004034
- Gaines, M.S., Diffendorfer, J.E., Tamarin, R.H. and Whittam, T.S. (1997) The effects of habitat fragmentation on the genetic structure of small mammal populations. Journal of Heredity, 88, 294-304. doi.org/10.1093/oxfordjournals.jhered.a023107
- IUCN (2011) IUCN red list of threatened species. Version 2011.1. http://www.iucnredlist.org/
- Flanders, J., Jones, G., Benda, P., Dietz, C., Zhang, S., Li, G., Sharifi, M. and Rossiter, S.J. (2009) Phylogeography of the greater horseshoe bat, Rhinolophus ferrumequinum: Contrasting results from mitochondrial and microsatellite data. Molecular Ecology, 18, 306-318. doi.org/10.1111/j.1365-294X.2008.04021.x

