Open Journal of Ecology
Vol.4 No.9(2014), Article
ID:46617,15
pages
DOI:10.4236/oje.2014.49042
The Public Water Supply Protection Value of Forests: A Watershed-Scale Ecosystem Services Analysis Based upon Total Organic Carbon
Emile Elias1, David Laband2, Mark Dougherty3, Graeme Lockaby4, Puneet Srivastava3, Hugo Rodriguez5
1USDA-ARS Jornada Experimental Range, New Mexico State University, Las Cruces, USA
2School of Economics, Georgia Institute of Technology, Atlanta, USA
3Biosystems Engineering, Auburn University, Auburn, USA
4Forestry and Wildlife Science Department, Auburn University, Auburn, USA
5Tetra Tech, Inc., Atlanta, USA
Email: eliaseh@nmsu.edu
Copyright © 2014 by authors and Scientific Research Publishing Inc.
This work is licensed under the Creative Commons Attribution International License (CC BY).
http://creativecommons.org/licenses/by/4.0/


Received 11 March 2014; revised 11 April 2014; accepted 18 April 2014
ABSTRACT
We developed a cost-based methodology to assess the value of forested watersheds to improve water quality in public water supplies. The developed methodology is applicable to other source watersheds to determine ecosystem services for water quality. We assess the value of forest land for source water mitigation of total organic carbon (TOC) through the use of linked watershed and reservoir simulation models and cost-based valuation economics. Watershed modeling results indicated that expected urbanization will increase TOC loads to Converse Reservoir (Mobile, AL). Reservoir model results indicated that future median TOC concentrations increased by 1.1 mg·L−1 between 1992 and 2020 at the source water intake. Depending upon dynamic reservoir TOC concentrations, additional drinking water treatment with powdered activated carbon (PAC) often is necessary between May and October to comply with Safe Drinking Water Act regulations. The cost for additional treatment was calculated using minimum and maximum volume treated with simulated TOC concentrations at the source water intake. Daily simulated TOC concentrations for the base scenario using 1992 land cover (3% urban) were compared with simulated TOC concentrations following forest to urban land conversion predicted in the watershed by 2020 (22% urban). The daily cost for additional drinking water treatment with PAC was calculated if simulated TOC concentrations exceeded 2.7 mg·L−1. The mean increase in daily treatment costs between base and future scenarios ranged from $91 to $95 per km2 per day for forest land water purification ecosystem services.
Keywords:Ecosystem Services, Water Quality, Drinking Water Treatment, Urbanization, Land Use Change

1. Introduction
Protecting watersheds that are a source for public water supply can generate large benefits. Many municipalities, such as New York, NY, Boston, MA, and Portland, OR, actively purchase land in their source water catchments to minimize potential water quality problems and avoid costly drinking water treatment plant upgrades [1] . Water related ecosystem services provided by forested landscapes support many beneficial uses and public goods, including improved water quality. While the water quality services from minimally impacted ecosystems are generally appreciated, the actual economic value has been rarely quantified within an existing cost structure related to drinking water quality. This research estimates an economic value ($ per km2) for the ecosystem services provided by a forested landscape for mitigation of total organic carbon, a contaminant to drinking water treatment. In addition to the specific value we estimate for a watershed in south Alabama, we present a cost-based methodology that is usable within the United States or, for that matter, globally.
1.1. Total Organic Carbon and the Safe Drinking Water Act
Total organic carbon (TOC) in drinking water supplies can react with chlorine to form carcinogenic substances called disinfection byproducts (DBP). Source water total organic carbon (TOC) is a good indicator of the amount of DBP that may form as a result of chemical disinfection [2] . Several DBPs have been identified by the US EPA as probable human carcinogens [3] .
The US EPA first regulated DBP under the Safe Drinking Water Act in 1979 for systems serving at least 10,000 people. In 1998 the maximum contaminant level for DBP was decreased under the Stage 1 DBP Rule. The Stage 2 DBPR was proposed in 2003 and finalized in 2005. EPA believes that this regulation will further reduce exposure to DBPs and decrease potential cancer, reproductive, and developmental risks [4] . Over 260 million individuals are exposed to DBPs [4] .
The US EPA concluded that epidemiology studies support a potential association between exposure to chlorinated drinking water and bladder cancer. The American Cancer Society (ACS) estimated that there will be about 70,530 new cases of bladder cancer diagnosed in the United States in 2010 [5] . EPA has projected that the Stage 2 DBP rule will prevent approximately 280 bladder cancer cases per year. Based on bladder cancer alone, the rule is estimated to provide annualized mean monetized benefit of $1.5 billion. Additional non-quantified benefits such as those from preventing potential reproductive and developmental risks may also result [4] .
Approximately 2260 drinking water treatment plants nationwide are estimated to make treatment technology changes to comply with the Stage 2 DBP rule [3] . The Stage 2 DBP rule strengthens public health protection by requiring that systems delivering disinfected water meet maximum contaminant levels as an average at each compliance monitoring location (instead of as a system-wide average as in previous rules). Drinking water systems will begin the first year of compliance monitoring between 2012 and 2016 and must be in compliance with the Stage 2 DBP rule MCLs at the end of a full year of monitoring [4] .
As a result of DBP rules, water systems with specified source water TOC levels are required to remove a specified percentage of TOC before chlorination or change drinking water treatment disinfection processes to minimize chlorination. The percentage of TOC removal is based upon comparison of raw water and treated water TOC concentration. A running annual average for each sampling location within a water distribution system is used to meet Stage 2 requirements. If TOC removal is selected over a treatment plant disinfection upgrade, it can be achieved through additional coagulation or enhanced softening. One method to remove source water TOC within a drinking water treatment plant is the addition of activated C prior to disinfection.
TOC in drinking water reservoirs originates from either watershed sources or internal algal growth. This research utilized robust hydrologic models to simulate watershed and reservoir nutrient processes with progressive urbanization scenarios to evaluate the effects of forest land conversion on reservoir TOC concentrations. Resulting TOC concentrations from reservoir modeling were utilized to estimate the cost of TOC removal during drinking water treatment for a given forest-to-urban land conversion scenario. Differences between pre-and post-urbanization scenarios yield the municipal water treatment cost savings provided by forest ecosystems as a result of minimized in-reservoir TOC. The dollar value per km2 savings provides an estimate of the monetary value of forest water purification ecosystem services through application of cost-based valuation.
1.2. Valuing Ecosystem Services for Water Quality
According to Young [6] , estimating the economic benefits of water quality improvement is among the most difficult tasks in water valuation. Regulating ecosystem services, such as water purification, have only recently begun to be assigned economic value [7] . Methods for valuation of water-related public goods fit into one of 3 broad categories: stated preference, revealed preference, and benefit-transfer methods [8] . Farber [9] expanded these valuation methods to include categories for cost based-approaches (replacement and avoidance costs) and nonmonetizing approaches.
Stated preference techniques are the most frequently used in ecosystem services valuation, but the least rigorous because they rely upon stated rather than actual behavior. Revealed preference techniques, such as travel cost or hedonic methods, are preferred over stated preference techniques because they rely upon actual consumer behavior rather than stated behavior; however, they are often more difficult to employ than stated preference techniques. Benefit transfer methods apply economic value estimates from one location to a similar site, which can be problematic if the ecosystems are poor matches [10] . A nonmonetizing approach evaluates a relative benefit without attaching a specific dollar value to an ecosystem service. Valuation of water provision ecosystem services summarized below was typically conducted using property and recreational values, benefit-transfer methods, and nonmonetizing approaches. Avoidance-cost approaches to value water purification ecosystem services were rare.
1.2.1. Water Purification Valuation Based on Nonmonetizing Approaches
Several recent studies utilized a nonmonetizing approach for water services provided by forested ecosystems. Randhir [11] developed an expert choice model to evaluate water supply protection. They used geographic and landscape information along with runoff travel time to develop a watershed-level prioritization model. Expert opinion was then used for index-based valuation. Similarly, Farber [9] estimated the relative value of different services at Long Term Ecological Research sites, but did not attempt to derive a dollar value on the services. Rather, they utilized expert opinion to assign a range of values (−3 to +3) to an anticipated ecosystem service change.
A variation of a nonmonetizing approach for water quality was developed for the Food and Agricultural Organization (FAO) of the United Nations [12] . In was used in an economic analysis of watershed management to protect Beijing’s water supply. Valuation was conducted on parameters with an existing market, such as agricultural production, with the acknowledgement that improved water quality is an additional benefit not requiring explicit valuation [13] . The benefits of increased agricultural production, reduced flooding and soil loss, and water yield alteration supported watershed management making economic evaluation of water quality benefits unnecessary.
1.2.2. Water Purification Based on Property and Recreational Value
A review of economic valuation of freshwater ecosystem services in the US reported results from 30 refereed journal articles [14] . The articles surveyed often reported the value of improved water quality in terms of increased property prices near aquatic resources with improved water quality, or in terms of the recreational value of a body of water, such as increased rafting trips or recreational money spent. Boyle [15] used the hedonic property value approach to measure demand for protecting freshwater lakes from eutrophication. They evaluated property prices and factors necessary to compare the properties with each other around different lakes. They then surveyed landowners to compare their stated desire for water clarity with field water clarity measurements.
Several researchers applied cost estimates from recreation, known as the benefit-transfer method, for water purification ecosystem services. Morgan and Owens [16] estimated the economic benefits of the Clean Water Act in the Chesapeake Bay. Their watershed-based study focused on N and P loading from selected point and nonpoint sources, specifically alternate manure control, decreased fertilizer application, and improvement in wastewater treatment. A dollar value from previous studies [17] [18] based upon recreational benefits from improved water quality, was applied. The estimated value of a 40% improvement in water quality was $357.9 million to $1.8 billion per year. Krieger [19] reported the forest ecosystem service value for water quality for the entire US as $64.16 per household per year based upon a contingent valuation study of recreational and passive use values of Flathead Lake and River in Montana. [20] .
Elsin [21] used a benefit-transfer approach to evaluate changes in drinking water treatment costs at varying levels of source water turbidity. An improvement in turbidity of 30% saved $90,000 to $553,000 per year in the Neuse Basin of North Carolina. Postel and Thompson [22] reported adapted increased water treatment costs related to decreased catchment forest land from Ernst [23] . A reduction from 60% forest land to 10% forest land increased drinking water treatment costs by 211%. While previous work [21] [22] related forest land or water quality to treatment cost, cost estimates of forest water purification ecosystem services based upon water treatment costs were generally uncommon.
Most studies did not focus on water quality or water purification from forested catchments, instead reporting improvements in “water supply” or “water provision” from forested catchments. The dimensions in which the terms “water supply” or “provision” reflect water quality or water purification in each study is often unknown. As such, specific dollar value estimates summarized below apply to the general category of “water supply”.
1.2.3. Dollar Value Estimates of Forest Land for “Water Provision”
A review of the economic value of forest watershed protection for various benefits including water quality regulation found that economic values for water quality were negligible when expressed on a per hectare basis [24] . In contrast, others report values of $3.64 to $245 ha−1 for forest provision of fresh water supply (Table 1). Costanza [25] reported the annual value of forests for water supply as between $3.64 to $65.96 ha·y−1, which is higher than the global value of $2.97 ha reported previously [26] . Nunez [27] used a production function method and report an annual value of $61.20 to $162.40 ha. Turner [28] reported an annual value of $245 ha for water provision from the Chattahoochee and Oconee National Forests in Georgia. An estimated mean willingness-to-pay for wetland water related services including water filtration was between $15.22 and $31.22 ha·y−1 [29] .
One well-known example of watershed management for water supply protection emerged due to the influence of changes in EPA regulations on the water supply of New York City [1] [8] . Watershed management is important since >99% of the supply is surface water. Consequently, NYC actively purchases land in the contributing subwatersheds and ~27% is publicly owned. The average price of natural land purchased for NYC watershed protection was $6745 per ha [22] . Other major US cities relying on surface water supplies with public ownership include Boston, MA (~60%), Portland, OR (100%), and Seattle, WA (100%) [1] .
We estimate a dollar value for water purification services of forested landscapes through application of a cost-based method. According to Daily [30] , more research is needed to build the credibility of ecosystem services approaches by combining biophysical measurements with economic valuation to estimate the monetary value of ecosystem services at the scale of decisions. This research is novel in that we were able to attach a specific dollar value anchored in an existing cost structure to the recognized benefits for water quality provided by of forested watersheds. While our empirical application focuses on Converse Reservoir, which supplies drinking water for the city of Mobile, AL, the methodology we employ using paired biophysical models with cost-based valuation of water quality improvement can be applied elsewhere.
1.3. Study Area
Converse Reservoir was formed in 1952 by impoundment of Big Creek in Mobile County, Alabama with a 37 m high earthen dam. The reservoir is located ~6 km from the Alabama-Mississippi border (Figure 1). Converse Reservoir, also referred to as Big Creek Lake, supplies the majority of drinking water for the City of Mobile through the Mobile Area Water and Wastewater Service (MAWWS).
Within the Converse Watershed there are wetlands, forests, dairy farms, plant nurseries, pecan groves and residential areas that utilize septic tanks for sewage disposal. MAWSS owns roughly 36.4 km2 surrounding the reservoir (approximately 11.5% of the total watershed area), which is managed for timber production by MAWSS.
Precipitation near the City of Mobile is some of the highest in the US, with a 48-y (1957-2005) median annual precipitation of 166 cm. Watershed soils are generally acidic, low in natural fertility and organic matter content and composed of fine sand or loamy find sand. These soils are considered well to moderately well drained [31] .
Converse Reservoir receives inflow from seven major tributaries, as well as groundwater inflow. A firm-yield analysis of Converse Reservoir estimated ~5% of the total volume is from groundwater [32] . Stream flow from the

Table 1 . Studies reporting ecosystem services related to the provision of fresh water.
*Adapted from US Department of Agriculture Forest Service. 1985. Proposed land and resource management plan. 1985 revision. ChattahoocheeOconee National Forests, Washington DC.
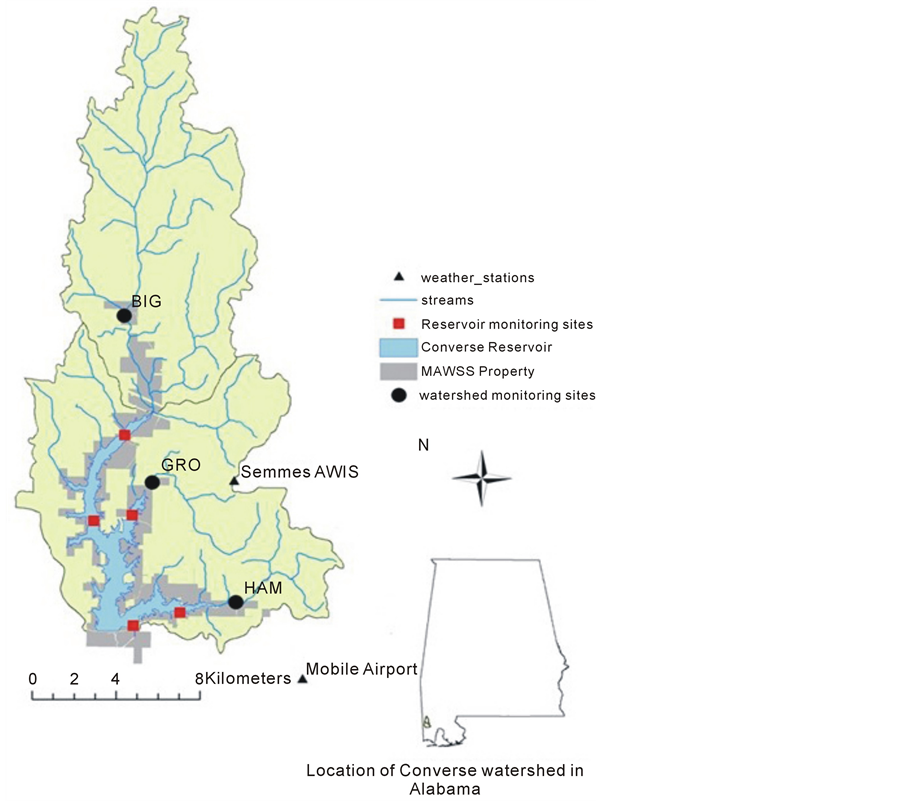
Figure 1. Monitoring locations, weather stations, and Mobile Area Water and Sewer Systems (MAWSS) property in the Converse Watershed in southwestern Alabama. Watershed monitoring sites represent gauging and water quality monitoring locations.
3 major tributaries (Big, Crooked and Hamilton creeks) has been monitored by USGS gauging stations since 1990. Converse Reservoir has two main branches, Big Creek, which becomes the mainstem of the reservoir, and Hamilton Creek. The drinking water intake is on Hamilton Creek 4.8 km from the mainstem of the reservoir.
Concerns about the quality of Converse Reservoir as a supply source for drinking water led to various scientific investigations [33] -[38] . Tributary and reservoir water quality data have been collected by the United States Geological Survey (USGS), Auburn University (AU) and MAWSS under various sampling programs and intervals from 1990 to 2005.
The eastern watershed boundary extends to within 500 m of Mobile, Alabama, city limits. New road construction is expected along with increased urbanization. The Mobile Metropolitan Planning Organization (MMPO) Transportation Plan (2000 to 2030) depicts a new freeway loop bisecting the eastern portion of the watershed [39] . Relocation of Highway 98 to the north within the watershed in 2007 generated litigation due to failed Alabama Department of Transportation (ALDOT) erosion control [40] . Future forecasts of urbanization in the Southeastern US reported by the Southern Forest Resource Assessment [41] indicated that major urbanized centers will be concentrated in 3 large areas. One of these was the Gulf Coast centered on Mobile Bay, which encompasses the Converse Watershed. The Forests on the Edge project [42] evaluated urbanization at a national scale and depicted increased population and urban housing densities within the Converse Watershed every 10 y between 1990 and 2030. Local, regional and national urbanization studies described above concur that the Converse Watershed will likely experience significant urbanization in the coming decades.
2. Methods
Results from watershed and reservoir hydrologic models were utilized to estimate the value of forested landscapes for potential reservoir TOC regulation. In-reservoir TOC concentrations resulting from watershed pre-and posturbanization forest to urban land use conversions were utilized. A cost-based economic analysis method was used to estimate the value of the forested landscape for water quality maintenance using costs associated with additional drinking water treatment options available in lieu of watershed management.
2.1. Watershed Modeling
The Loading Simulation Program in C++ (LSPC) [43] which can simulate TOC and provide input for a widely used reservoir model described below was selected as the watershed model for this project. LSPC was used to simulate a 1992 pre-urbanization land use scenario, as well as post-urbanization scenarios estimated using Forest on the Edge (FOTE) housing density projections for 2020 [42] [44] . FOTE urbanization is spatially explicit, so expected urban growth was calculated on a subwatershed basis for the 62 subwatersheds comprising the greater Converse watershed (Figure 2). FOTE urbanization is based upon 30 m2 resolution projection based upon historic and current housing density and county level population projections. FOTE housing density projections assume that future growth will be similar to the growth of the past decade. We applied local knowledge, such as knowledge of private land ownership, to the FOTE urbanization projections for our study watershed. Base and future scenarios were paired and compared with one another to evaluate the influence of estimated forest to urban land conversion on simulated total N (TN), total P (TP) and TOC concentrations and loads to Converse Reservoir between 1991 and 2005 using actual atmospheric conditions. While our economic analysis focuses on TOC, analysis of TN and TP were necessary since these nutrients support algae growth, simulated during reservoir modeling, which is a form of C important to the overall TOC budget.
Hydrologic calibration of the watershed model consisted of comparisons between predicted stream flow at Big Creek (USGS station number 02479945), Hamilton Creek (02480002) and Crooked Creek (02479980) to observed corresponding daily, monthly and yearly stream flow from 1 January 1991 to 31 December 2000. Water quality calibration and validation must occur following hydrologic calibration and validation. Grab samples of TN, TP and TOC concentrations collected by the USGS were extrapolated to monthly loads using the USGS load estimator (LOADEST) regression model for Big, Crooked and Hamilton creeks [45] . LOADEST estimates loads in rivers by utilizing measured stream flow and concentration data to develop a regression model. Monthly loads estimated by LOADEST were compared with simulated LSPC monthly loads statistically using Nash-Sutcliffe efficiency (NSE), percent bias (PBIAS) and ratio of the root mean square error to the standard deviation of measured data (RSR) to evaluate model performance [46] . Expected urbanization and changes in stream flow, TOC concentrations and TOC loads were reported.
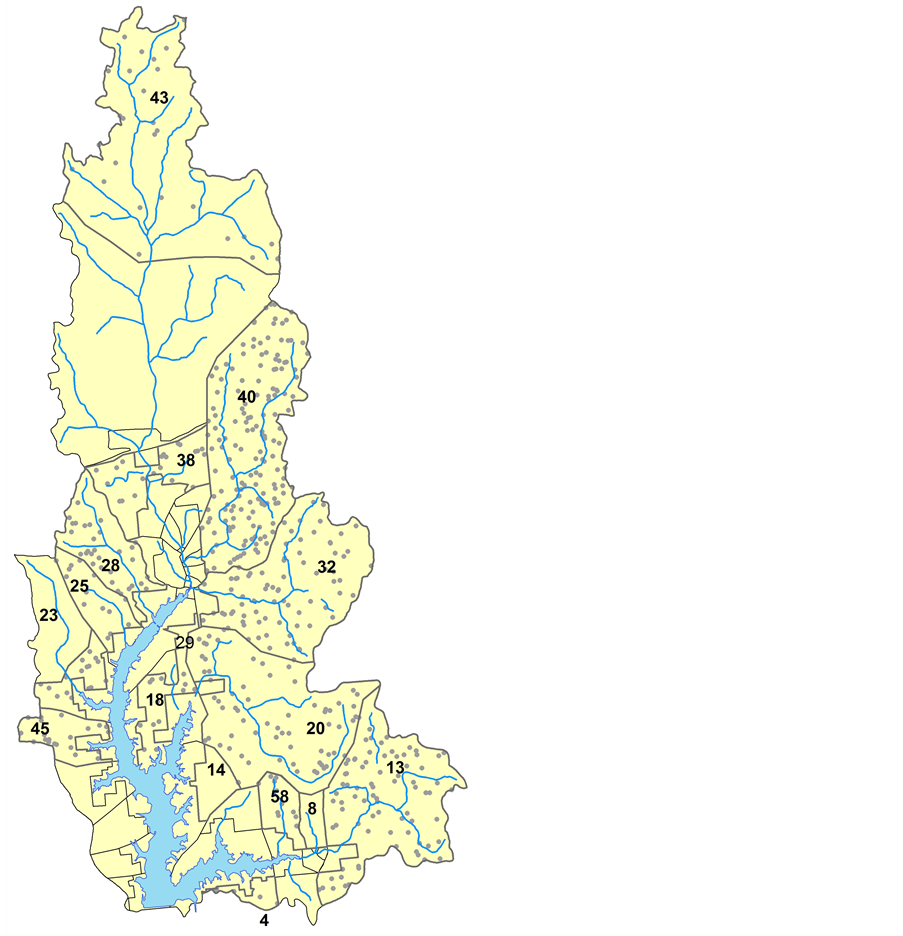
Figure 2. Forest to urban land conversion in the Converse Watershed from 1990 to 2020 by subwatershed. Subwatershed number, bold; acres changed from forest to urban in boxes. Each dot represents 20 acres changed from forest to urban land use within the subwatershed.
2.2. Reservoir Modeling
Daily flows and loads (kg) from watershed modeling were used to simulate base and future scenarios in the Environmental Fluid Dynamics Code (EFDC) hydrodynamic and water quality model. The EFDC model was developed at the Virginia Institute of Marine Science [47] . The model has been applied in various locations, including the Chesapeake Bay estuarine system [48] , the Neuse Estuary in North Carolina [49] and the Florida Everglades [50] . Daily differences between base and future TOC concentrations (mg·L−1) from May to October between 1992 and 2004 at the drinking water intake were used to estimate differences in treatment cost. The year 2000 was a severe drought year and was not used in reservoir simulation because 1) this research aimed to evaluate the influence of urbanization during average conditions, and 2) the reservoir model had limitations during low-water level simulation.
2.3. Economic Analysis
The change from forested to urbanized land use along with the resultant change in reservoir TOC concentrations were valued using a cost-based method based on the cost of removing carbon to minimize human health risk from carcinogens as mandated by the Stage 2 Disinfection Byproducts Rule [3] . The amount of land converted from forest (52 km2) was linked to higher costs for TOC removal as urbanization increased. The difference in additional PAC treatment costs divided by the area changed from forest to urban land use provided a cost per km2 estimate for forest water quality services related to reservoir TOC concentrations. A cost-based method was selected as a straight-forward application of previously determined costs for additional water treatment with PAC used to value forest-water related services. The benefit of this approach is that it attaches an actual dollar value to ecosystem services. The drawback is that it relies upon estimates of increased treatment costs, which may change with changes in regulations or PAC costs.
Based upon previous monitoring data, MAWSS has established TOC and water temperature levels above which disinfection byproduct formation is more likely in the water distribution system. Operational thresholds are defined as a finished water TOC concentration exceeding 1.5 mg·L−1 when the water temperature at the treatment plant exceeds 27˚C (May to October). TOC at the drinking water intake was evaluated daily from May to October using 2042 days from 1992 to 2004, excluding 2000 and 2001. The decline in water level during the drought of 2000 hampered reservoir simulation by decreasing water level to the point of cell “drying”, which was not computationally feasible in the version of EFDC used in this research.
Reservoir water TOC is currently treated with powdered activated carbon (PAC) to minimize DBP formation. The cost for PAC in April 2010 was $1.72 kg ($0.78 lb) and was used in base and future scenario economic analysis. This is a conservative estimate since PAC cost by 2020 is projected to range from $4.25 kg ($1.93 lb) to $5.82 kg ($2.64 lb) [51] .
The least and highest total raw water flows treated between May and October were used to define the upper and lower possible additional treatment cost between 1992 and 2005. The maximum volume treated between May and October was 9501 million gallons in 2000, a severe drought year. The minimum volume treated between May and October was 7860 million gallons in 1995. The treatment volume for 1995 and 2000 was used in cost analyses.
For future scenarios, the population growth projection used by MAWSS was 1% per year. Mobile County population growth projection between 2005 and 2020 was 6.4% [52] . The total daily treatment volume in 2020 was expected to be 7.5% higher than 2005. To calculate an estimated future treatment volume for comparison with base scenarios, the 7.5% increase was applied to the mean daily treatment volume from selected years having the least and highest treatment volume (1995 and 2000, respectively).
MAWSS has found that a finished water TOC concentration of 1.5 mg·L−1 or less reduces the formation of DBPs. The drinking water treatment process at MAWSS typically removes 45% or more of the reservoir water TOC. Occasionally, a removal efficiency of 35% was recorded at lower reservoir water TOC concentrations. Equation 1 represents a TOC removal of 45% during water treatment and a finished water goal of 1.5 mg·L−1 TOC, the reservoir water TOC concentration above which additional treatment is necessary was 2.7 mg·L−1.
 (1)
(1)
The work rate is the ratio of TOC reduction (mg·L−1) to PAC dose (mg·L−1). A work rate of 0.063 for TOC removal with PAC was calculated by MAWSS. Equation 2 identifies the PAC dose necessary for a specified TOC reduction
 (2)
(2)
To calculate the daily cost for additional water treatment, assuming the daily simulated TOC concentration at the drinking water intake was > 2.7 mg L–1, additional treatment cost for base and future scenarios was computed as follows:


The mean daily and annual costs for additional PAC treatment were reported, along with a range of costs for the base scenarios provided by using the minimum and maximum treatment volume in calculations. The mean cost for additional treatment for base scenarios was subtracted from the corresponding cost for future treatment to estimate an increase in cost per day and year due to forest to urban land conversion. The mean annual costs were calculated using minimum and maximum treatment volume to provide a range of expected increased treatment costs due to simulated urbanization.
The dollar value for forested land ecosystem services related to TOC concentrations was reported based upon the necessary increased treatment cost. To simulate urbanization between 1992 and 2020, forest to urban land conversion occurred on 52 km2. The average increase in treatment cost between May and October was divided by the area urbanized to yield cost per km2 per day.
3. Results and Discussion
3.1. Watershed Model Results
Watershed model results are dependent upon the simulated spatial distribution of urbanization in the Converse Watershed. As such, a spatially explicit regional growth model was used to provide the best estimate of urbanization by subwatershed. From 1992 to 2020 simulated urban and suburban growth of 52 km2, which is an increase in total urban area from 3 to 22%, resulted in an increase of >50% in TN and TP total loads (kg) to Converse Reservoir. TN and TP loads increased by 109 and 62%, respectively. LSPC watershed model total flow, direct runoff and base flow calibration and validation NSE and RSR performance ratings ranged from “satisfactory” to “very good” for all streams in the watershed (Table 2) [53] . Nutrient PBIAS performance ratings for calibration and validation were “fair” to “very good”.
Results indicated simulated urban growth generally increased monthly flows by 15%, but resulted in 2.9% lower flows during drought months. An increase in flow following simulated forest to urban land conversion resulted in a 26% increase in TOC loads, despite lower future TOC concentrations (16%). Simulated forest to urban land conversion led to significantly higher TOC loads during June, July and August of the critical period (May to October) for DBP formation in drinking water supplied by Converse Reservoir.
3.2. Reservoir Model Results
Forest to urban land conversion resulted in elevated median TOC concentrations at the MAWSS drinking water intake. Median future TOC concentration increased by 1.1 mg·L−1 (41%) over median base TOC concentration (Table 3). Higher TOC concentration simulated by the reservoir model, despite lower future TOC concentrations from the watershed model, is a result of increased nutrient (N and P) loading following urbanization supporting increased reservoir algae growth. Simulated forest to urban land use change caused monthly median predicted TOC concentrations at the source water intake between May and October to increase by between 33% to 49%. The largest increase occurred in August to October. TOC concentrations between May and October are important since additional drinking water treatment is positively related to elevated water temperatures.
Additional drinking water treatment is necessary when raw water TOC concentration was > 2.7 mg·L−1 between May and October. Using 1992 pre-urbanized land use, additional drinking water treatment with PAC was necessary on 47% of the days since TOC concentrations exceeded 2.7 mg·L−1. Simulated urbanization in the Converse Watershed caused additional drinking water treatment to be continuously necessary.
3.3. Ecosystem Services Valuation
For the 1992 base scenario, average daily PAC treatment cost ranged from $1100 per day with the smaller annual treatment volume to $1360 per day with the larger annual treatment volume (Table 4). The mean future additional PAC treatment cost due to forest to urban land conversion was $6100 d−1. The mean daily cost for additional future PAC to reduce in-reservoir carbon was consistently higher than the mean daily cost for base scenario PAC required to comply with disinfection byproduct rules. Forest to urban land conversion substantially increased
Table 2 . Calibration (1991-2000) and validation (2001-2005) results for monthly total flow, direct runoff and baseflow at Big Creek, Hamilton Creek and Crooked creeks, Mobile County, Alabama. Statistics presented include the coefficient of determination (R2), Nash-Sutcliffe efficiency (NSE), ratio of the root mean square error to the standard deviation of measured data (RSR), and percent bias (PBIAS)..
Table 3. Median total nitrogen (TN), total phosphorus (TP) and total organic carbon (TOC) concentrations using daily simulated data at the drinking water intake on Converse Reservoir, AL, 1992 to 2005 (n = 4292 days).
in-reservoir TOC and water treatment cost in the Converse Watershed.
Following simulated forest-to-urban land conversion, the daily mean increase in treatment cost for PAC addition between May and October for the 1992 scenario comparison was between $4700 and $5000 d−1 (Table 5). The value of the forested watershed in reducing in-reservoir TOC using 1992 forest to urban land conversion
Table 4 . Daily mean powdered activated carbon (PAC) treatment cost by land use scenarios between May and October, Converse Reservoir, AL.
Table 5. Increase in treatment cost per day and increase in treatment cost per day per km2 changed to urban land use between base and post-urbanization land use scenarios at Converse Reservoir, Alabama, 1992 to 2004.
ranged from $91 to $95 per km2 per day.
The mean annual cost for additional treatment with PAC using base 1992 land use during simulations was between $207,000 to $250,000 y−1 depending upon volume treated. The mean annual cost for treatment with PAC following simulated urbanization was $1,120,000, with a range of $740,000 to $1,777,000 y−1. The increase in treatment cost was calculated by subtracting daily base scenario PAC cost from daily future PAC cost. The mean increase in annual treatment cost (n = 11 y) was $870,090 to $912,310 per year. The increase in annual treatment cost ranged from $628,070 to $1,309,720. The mean increase in annual treatment cost per km2 urbanized was $16,730 to $17,540 per km2. The increase in annual treatment costs ranged from $12,080 to $25,190 per km2 per y ($120.80 to $251.90 per ha per year). The value of forest TOC regulation services lost following simulated urbanization was within the values for forest water provision of $61 to $162 per ha reported by [27] and $245 per ha reported by Turner [28] , but higher than the $4 to $66 per ha estimated by Costanza [25] . Since previous estimates encompass all water provision services from the forest and our estimate focused on only one water quality parameter, the total water provision services from forested catchments would likely be larger than both our current estimate and previous estimates.
3.4. Watershed Context and Future Research
This research provides the methodology to determine a cost-based value of forested watersheds for public water supply protection based upon forest to urban land use. This methodology should be applied using different land use shifts to incorporate other changes such as a shift from forest to agricultural land. The methodology should also be applied to other watersheds in other regions to document regional differences in land use change in TOC concentration. An analysis of the spatial variability in the value of forests might be developed as an extension of this work. Finally, drinking water providers struggle with contaminants other than TOC and disinfection byproducts. For example, increased sediment levels or elevated nitrate concentrations following a land use shift would likely cause necessary changes in water treatment at an associated cost. Even if the value of the forest for water quality management is realized in land-use planning and decision making, much of the watershed is privately owned. Urbanization is still occurring in the watershed and likely will continue even though MAWSS has an active program to purchase private forest land in the watershed.
4. Conclusions
The economic value of forested watersheds for source water protection of water quality has long been recognized but rarely quantified in a firmly established cost structure. This study focused on the value of one water quality variable, TOC, to estimate the economic benefits of forest cover in a source water catchment. Watershed model results, which are dependent upon the spatial distribution of urbanization in the watershed, indicated that urbanization increased TN, TP and TOC loads to Converse Reservoir. Reservoir model results indicated future median TOC concentration increased by 1.1 mg·L−1. Between May and October, urbanization increased monthly median TOC concentrations by 33% to 49%. With 1992 pre-urbanized land use, additional treatment was necessary 47% of the days between May and October. Simulation with predicted increase in urban land use by 2020 caused the need for continuous additional treatment between May and October to comply with the DBP rule of the Safe Drinking Water Act.
The estimated ecosystem service values are sensitive to changes in the price of PAC. PAC cost was estimated at $1.72 kg−1. As the price of PAC increases or decreases, the resultant ecosystem services for TOC regulation will also increase or decrease. The ecosystem service valuation methodology utilized may be easily modified to capture the changes in PAC cost.
The cost for additional treatment was estimated using minimum and maximum values for volume treated with simulated TOC concentrations at the source water intake. Daily simulated TOC concentrations for 1992 MRLC land use were compared with simulated TOC concentrations following forest to urban land conversion predicted in the watershed by 2020. Simulated reservoir TOC concentrations required additional treatment with PAC at a mean daily cost of $1100 to $1360 d−1 for base scenarios and $6100 d−1 for future scenarios. Annual PAC treatment costs from May to October were higher following simulated urbanization than the respective base scenario and ranged from $9830 to $844,850 y−1 for base scenario and $740,800 to $1,777,000 y−1 with simulated urbanization by 2020.
The daily mean increase in treatment cost for PAC addition between May and October was $4700 to $5000 per day using the 1992 scenario comparison. This corresponds to a value of $91 to $95 per km2 per day for forest land TOC regulation. Following simulated urbanization, annual treatment costs increased by $628,000 to $1,309,720 per year or $12,080 to $25,190 per·km2 per year.
The increase in annual treatment cost depends upon annual volume of water treated which generally corresponds with precipitation. Consequently, the ecosystem services provided by the forest land in Converse Watershed vary annually, ranging from $120.80 to $251.90 ha·y−1. The estimated mean annual value of forested ecosystem services for reservoir water TOC regulation from the 11 years simulated was $167.30 to $175.40 ha.
Based solely upon the reservoir water TOC related ecosystem services provided by forests in Converse Watershed with an annual value of $167.30 to $175.40 ha, and assuming a 4% discount rate, MAWSS should purchase property for any price up to $4385 per ha. The average purchase price for watershed land in the NYC project was $6745 per ha to capture the suite of watershed protection ecosystem services [22] .
This research isolated the value of one ecosystem service provided by a forested catchment, improved water quality relative to drinking water treatment. Within the arena of public sector decision-making, this research provides a basis for the purchase of watershed land relative to water quality benefits. Other forested ecosystem services, such as water quantity regulation, wildlife habitat, sediment retention and recreational value, have been assessed previously by others and may be added to the water quality benefits reported here to increase the financial feasibility of purchasing watershed land to capture additional ecosystem service benefits. This research starts providing the financial valuations that are necessary to guide effective public sector decision-making, such as purchasing watershed acreage, relative to ecosystem services that yield public values.
While these results are specific to the Converse Reservoir, the methodology can be applied elsewhere to estimate a value for ecosystem services relative to water quality variables. The development of readily accessible watershed and reservoir simulation models and digital information provide the tools necessary to estimate the value of ecosystem services that were previously often avoided in valuation calculations. The value of TOC regulation in the Converse Watershed was within the range of previous values provided for all water provision ecosystem services from a forested catchment, suggesting that previous estimates may need to be increased to incorporate the value of forested catchments for water quality regulation.
Acknowledgements
We thank the Center for Forest Sustainability, Auburn University, for funding this research. We also thank Jamie Childers (TetraTech, Atlanta, GA), Amy Gill, (Alabama United States Geological Survey), and Tony Fisher (Mobile Area Water and Sewer Systems) for their assistance with this research. Thanks to Dr. Al Rango, USDAARS Jornada Experimental Range.
References
- Blaine J.G., Sweeney B.W. and Arscott D.B. (2006) Enhanced Source-Water Monitoring for New York City: Historical Framework, Political Context, and Project Design. Journal of the North American Benthological Society, 25, 851866. http://dx.doi.org/10.1899/0887-3593(2006)025[0851:ESMFNY]2.0.CO
- Singer, P.C. and Chang, S.P. (1989) Correlations between Trihalomethanes and Total Organic Halides Formed during Water Treatment. Journal of the American Water Works Association, 81, 61-65.
- USEPA (2005) Occurrence Assessment for the Final Stage 2 Disinfectants and Disinfection Byproducts Rule. EPA 815-R-05-011.
- USEPA (2012) Stage 2 DBP Rule: Basic Information. http://water.epa.gov/lawsregs/rulesregs/sdwa/stage2/basicinformation.cfm
- American Cancer Society (ACS) (2010) Bladder Cancer Overview. http://www.cancer.org/Cancer/BladderCancer/OverviewGuide/bladder-cancer-overview-key-statistics
- Young, R.A. (2005) Determining the Economic Value of Water: Concepts and Methods. Resources for the Future, Washington DC.
- TEEB (2010) The Economics of Ecosystems and Biodiversity: Mainstreaming the Economics of Nature: A Synthesis of the Approach, Conclusions and Recommendations of TEEB. http://www.teebweb.org
- National Research Council (2005) Valuing Ecosystem Services: Toward Better Environmental Decision-Making. National Academies Press, Washington DC.
- Farber, S., Costanza, R., Childers, D.L., Erickson, J., Gross, K., Grove, M., Hopkinson, C.S., Kahn, J., Pincetl, S., Troy, A., Warren, P. and Wilson, M. (2006) Linking Ecology and Economics for Ecosystem Management. BioScience, 56, 121-133. http://dx.doi.org/10.1641/0006-3568(2006)056[0121:LEAEFE]2.0.CO
- Plummer, M. (2009) Assessing Benefit Transfer for the Valuation of Ecosystem Services. Frontiers in Ecology and the Environment, 7, 38-45. http://dx.doi.org/10.1890/080091
- Randhir T.O., O’Connor, R., Penner, P.R. and Goodwin, D.W. (2001) A Watershed-Based Land Prioritization Model for Water Supply Protection. Forest Ecology and Management, 143, 47-56. http://dx.doi.org/10.1016/S0378-1127(00)00504-1
- Brooks, K., Gregersen, H., Berglund, E. and Tagaa, M. (1982) Economic Evaluation of Watershed Projects: An Overview Methodology and Application. Water Resources Bulletin, 18, 245-250. http://dx.doi.org/10.1111/j.1752-1688.1982.tb03967.x
- Shuhuai, D., Zhihui, G., Gregerson, H., Brooks, K. and Ffolliott, P. (2001) Protecting Beijing’s Municipal Water Supply through Watershed Management: An Economic Assessment. Journal of the American Water Resources Association, 37, 585-595.
- Wilson, M.A. and Carpenter, C.R. (1999) Economic Valuation of Freshwater Ecosystem Services in the US: 1971-1997. Ecological Applications, 9, 772-783.
- Boyle, K.J., Lawson, S.R. and Michael, H.J. (1998) Lakefront Property Owners’ Economic Demand for Water Clarity in Maine Lakes. Maine Agricultural Experiment Station, Orono.
- Morgan, C. and Owens, N. (2001) Benefits of Water Quality Policies: The Chesapeake Bay. Ecological Economics, 39, 271-284. http://dx.doi.org/10.1016/S0921-8009(01)00212-9
- Krupnick, A. (1988) Reducing Bay Nutrients: An Economic Perspective. Maryland Law Review, 47, 453-480.
- Bockstael, N.E., McConnell, K.E. and Strand, I.E. (1989) Measuring the Benefits of Improvements in Water Quality: The Chesapeake Bay. Marine Resource Economics, 6, 1-18.
- Krieger, D.J. (2001) The Economic Value of Forest Ecosystem Services: A Review. The Wilderness Society, Washington DC.
- Sutherland, R.J. and Walsh, R.G. (1985) The Effect of Distance on the Preservation Value of Water Quality. Land Economics, 61, 281-291. http://dx.doi.org/10.2307/3145843
- Elsin, Y.K., Kramer, R.A. and Jenkins, W.A. (2010) Valuing Drinking Water Provision as an Ecosystem Service in the Neuse River Basin. Journal of Water Resources Planning and Management, 136, 474-482. http://dx.doi.org/10.1061/(ASCE)WR.1943-5452.0000058
- Postel, S.L. and Thompson, B.H. (2005) Watershed Protection: Capturing the Benefits of Nature’s Water Supply Services. Natural Resources Forum, 29, 98-108. http://dx.doi.org/10.1111/j.1477-8947.2005.00119.x
- Ernst, C. (2004) Protecting the Source: Land Conservation and the Future of America’s Drinking Water. Trust for Public Land, Washington DC.
- Pearce, D.W. (2001) The Economic Value of Forest Ecosystems. Ecosystem Health, 7, 284-296. http://dx.doi.org/10.1046/j.1526-0992.2001.01037.x
- Costanza, R., Wilson, M., Troy, A., Voinov, A., Liu, A. and D’Agostina, J. (2006) The Value of New Jersey’s Ecosystem Services and Natural Capital. Gund Institute for Ecological Economics. Robinson School of Environment and Natural Resources. University of Vermont, Burlington. 05405. http://njedl.rutgers.edu/ftp/PDFs/4631.pdf
- Costanza, R., d’Arge, R., de Groot, R., Farber, S., Grasso, M., Hannon, B., Limburg, K., Naeem, S., O’Neill, R.V., Paruelo, J., Raskin, R.G., Sutton, P. and van den Belt, M. (1997) The Value of the World’s Ecosystem Services and Natural Capital. Nature, 387, 253-560. http://dx.doi.org/10.1038/387253a0
- Nunez, D., Nahuelhual, L. and Oyarzun, C. (2006) Forests and Water: The Value of Native Temperate Forests in Supplying Water for Human Consumption. Ecological Economics, 58, 606-616. http://dx.doi.org/10.1016/j.ecolecon.2005.08.010
- Turner, M.G., Odum, E.P., Costanza, R. and Springer, T.M. (1988) Market and Non-Market Value of the Georgia Landscape. Environmental Management, 12, 209-217. http://dx.doi.org/10.1007/BF01873389
- Boyer, T. and Polasky, S. (2004) Valuing Urban Wetlands: A Review of Non-Market Valuation Studies. Wetlands, 24, 744-755. http://dx.doi.org/10.1672/0277-5212(2004)024[0744:VUWARO]2.0.CO;2
- Daily, G., Polasky, S., Goldstein, J., Kareiva, P.M., Mooney, H.A., Pejchar, L., Ricketts, T.H., Salzman, J. and Shallenberger, R. (2009) Ecosystem Services in Decision-Making: Time to Deliver. Frontiers in Ecology and the Environment, 7, 21-28. http://dx.doi.org/10.1890/080025
- USDA Natural Resources Conservation Service (2007) National Engineering Handbook Part 630. Hydrologic Soil Groups-Chapter 7, Washington DC.
- Carlson, C.S. and Archfield, S.A. (2009) Hydrogeologic Conditions and a Firm-Yield Assessment for J.B. Converse Lake, Mobile County, Alabama, 1991-2006. US Geological Survey Scientific Investigations Report 2008-5005, 2nd Edition, 21 p.
- Journey, C.A., Psinakis, W.L. and Atkins, J.B. (1995) Streamflow and Water Quality and Bottom Material Analyses of the J.B. Converse Lake Basin, Mobile County, Alabama, 1990-1992. US Geological Survey, Tuscaloosa, Alabama, 95-4106.
- ADEM (1996) ADEM Reservoir Water Quality Monitoring Program Report (1990-1995). Alabama Department of Environmental Management, Ecological Studies Section, Field Operations Division, Montgomery.
- Bayne, D.R., Seesock, W.C. and Reutebuch, E. (1998) Limnological Study of Big Creek Lake. Department of Fisheries and Allied Aquacultures, Auburn University, Auburn.
- Journey, C.A. and Gill, A.C. (2001) Assessment of Water-Quality Conditions in the J.B. Converse Lake Watershed, Mobile County, Alabama, 1990-98. US Geological Survey, Montgomery, Alabama, 01-4225.
- ADEM (2003) Surface Water Quality Screening Assessment of the Escatawpa River, Mobile Bay, and Upper and Lower Tombigbee River Basins-2001. Alabama Department of Environmental Management Aquatic Assessment Unit, Environmental Indicators Section, Montgomery, Alabama.
- Gill, A.C., McPherson, A.K. and Moreland, R.S. (2005) Water Quality and Simulated Effects of Urban Land-Use Change in J.B. Converse Lake Watershed, Mobile County, Alabama, 1990-2003. US Geological Survey, Montgomery, Alabama, 2005-5171.
- Mobile Metropolitan Planning Organization (2005) 2030 Long Range Transportation Plan. South Alabama Regional Planning Commission, Mobile, Alabama, 123.
- Alabama Department of Transportation (ALDOT) (2010) Making Highway 98 Safer for South Alabama’s Families. http://www.safe98.com/
- Wear, D.N. and Greis, J.G. (2002) Southern Forest Resource Assessment. Gen. Tech. Rep. SRS-53. US Department of Agriculture, Forest Service, Southern Research Station, Ashville, 635 p.
- Stein, S.M., McRoberts, R.E., Alig, R.J., Nelson, M.D., Theobald, D.M., Eley, M., Dechter, M. and Carr, M. (2005) Forests on the Edge: Housing Development on America’s Private Forests. PNW-GTR-636, US Department of Agriculture, Forest Service, Pacific Northwest Research Station, Portland.
- USEPA (2010) Loading Simulation Program in C++. http://www.epa.gov/ATHENS/wwqtsc/html/lspc.html
- Stein, S.M., McRoberts, R.E., Nelson, M.D., Theobald, D.M., Eley, M. and Dechter, M. (2006) Forests on the Edge: A GIS-Based Approach to Projecting Housing Development on Private Forests. USDA Forest Service Proceedings RMRS, Denver, 20-24 September 2006, 736-743.
- Runkel, R.L., Crawford, C.G. and Cohn, T.A. (2004) Load Estimator (LOADEST): A FORTRAN Program for Estimating Constituent Loads in Streams and Rivers. USGS Techniques and Methods Book 4, Chapter A5, USGS, Reston, 69 p.
- Elias, E.H., Dougherty, M., Srivastava, P. and Laband, D. (2011) The Impact of Forest to Urban Land Conversion on Streamflow, Total Nitrogen, Total Phosphorus, and Total Organic Carbon Inputs to the Converse Reservoir, Southern Alabama, USA. Urban Ecosystems, 14, 79-107.
- Hamrick, J.M. (1992) A Three-Dimensional Environmental Fluid Dynamcis Computer Code: Theoretical and Computational Aspects. The College of William and Mary, Virginia Institute of Marine Science, Gloucester Point, Special Report 317.
- Hamrick, JM. (1994) Linking Hydrodynamic and Biogeochemical Transport Models for Estuarine and Coastal Waters. Estuarine and Coastal Modeling. Proceedings of the 3rd International Conference, American Society of Civil Engineers, New York, 591-608.
- Wool, T.A., Davie, S.R. and Rodriguez, H.N. (2003) Development of Three-Dimensional Hydrodynamic and Water Quality Models to Support TMDL Decision Process for the Neuse River Estuary, North Carolina. Journal of Water Resources Planning and Management, 129, 295-306. http://dx.doi.org/10.1061/(ASCE)0733-9496(2003)129:4(295)
- Moustafa, M.Z. and Hamrick, J.M. (2000) Calibration of the Wetland Hydrodynamic Model to the Everglades Nutrient Removal Project. Water Quality and Ecosystem Modeling, 1, 141-167. http://dx.doi.org/10.1023/A:1013938700446
- Volkert, Inc. (2010) Powdered Activated Carbon Cost Projections. Report Prepared for Mobile Area Water and Sewer Systems by Volkert Engineering, Planning and Environmental Consulting, Mobile.
- Center for Business and Economic Research (2001) Alabama County Level Population Projections. US Census Bureau and Center for Business and Economic Research, the University of Alabama. http://cber.cba.ua.edu/edata/est_prj.html
- Moriasi, D.N., Arnold, J.G., Van Liew, M.W., Bingner, R.L., Harned, R.D. and Veith, T.L. (2007) Model Evaluation Guidelines for Systematic Quantification of Accuracy in Watershed Simulations. Transactions of the American Society of Agricultural and Biological Engineers, 50, 885-900.