Open Journal of Genetics
Vol.4 No.5(2014), Article ID:48798,12 pages
DOI:10.4236/ojgen.2014.45031
Molecular Characterization on the Early Developmental Stages of the Egyptian Toad Bufo regularis Reuss
Alaa El-Din H. Sayed1, Afaf I. Elballouz1,2, Ekbal T. Wassif1
1Zoology Department, Faculty of Science, Assiut University, Assiut, Egypt
2Zoology Department, Faculty of Science, Misurate University, Misurate, Libya
Email: alaa_h254@yahoo.com
Copyright © 2014 by authors and Scientific Research Publishing Inc.
This work is licensed under the Creative Commons Attribution International License (CC BY).
http://creativecommons.org/licenses/by/4.0/
![]()
![]()

Received 8 May 2014; revised 7 June 2014; accepted 6 July 2014
ABSTRACT
The present study aimed to investigate changes in the protein contents using SDS-PAGE, also using the random amplified polymorphic DNA (RAPD-PCR) assay to identify changes in DNA concentration in the embryos of Egyptian toad Bufo regularis. Our experiment started when tadpoles began to feed. The adapted embryos were divided into 3 large tanks of 200 embryos each, collections of samples started from feeding age every three days. Cluster method was used to indicate the distinct distance between the band patterns of different stages. An increase occurred in the concentration of protein fractions in these tadpoles upon metamorphosis and that when metamorphosis was completed. DNA concentration exhibited an evident low values at the premetamorphic stage 44 (105.85 ± 0.519 ng/µl) compared with the other more advanced developmental stages 55 and 56 (204.056 ± 0.651 ng/µl and 234.55 ± 2.325 ng/µl respectively). In conclusion, acquire information about the changes in the molecular content of Bufo regularis during metamorphosis has been estimated.
Keywords:Genes, Bufo regularis, Protein, DNAs

1. Introduction
Bufonidae represent one of the most anuran families distributed in all parts of the world except for Antarctica [1] . About 300 species was included in the Bufo genus [1] . The common species in Egypt were Bufo regularis, Bufo viridis, Rana bedriagae and Ptychadena mascareniesis [1] . Due to their habitation, Bufonidae was frequently used as important family in experimental biology studies [1] . To our knowledge, the few studies refer to the molecular characterization of this species [2] [3] .
The gene expression profiles show distinctive temporal patterns with most transcript steady-state levels increasing after induction of metamorphosis [4] . Several changes in protein concentrations were measured for different developmental stages to indicate changes in protein expression and activity which lead to the complete remodeling of the organism into a frog [4] -[6] .
Amphibian metamorphosis is a complex process that has been speculated to involve DNA amplification and chromatin rearrangement and therefore the DNA content displayed different values during amphibian development [7] and provides a unique opportunity to study the entire mechanisms underlying apoptosis at the molecular level [8] [9] . Many investigators are interested in rapid assays to detect and quantify apoptosis in cell populations. It is possible to quantify DNA fragmentation during apoptosis [3] [10] .
Among the different techniques used to detect genetic changes is the randam amplified polymorphic DNA (RAPD-DNA), developed by [11] [12] and it is able to detect DNA damage (strand breaks) at tissue level. RAPD is a powerful technique that involves the amplifications of random segments of genomic DNA using PCR and damage to the genomic DNA resulted in changes of the binding site and PCR product, and furthermore altered the electrophoresis pattern [13] -[15] . So these results made this technique possible to use to detect the genetic changes during amphibia metamorphosis. Several studies have indicated the RAPD as useful method for detecting DNA damage in both laboratory and field studies both with aquatic invertebrates and fish [13] [16] - [18] . Many authors reported the RAPD assay to detect genomic DNA alterations induced by several DNA-damaging agents such as, heavy metals [19] [20] , 4-n-nonylphenol [15] [16] chysotile asbestos [21] , UV radiation [22] [23] or x-rays, and radio nuclides [24] .
Sodium dodecyl sulfate polyacrylamide gel electrophoresis (SDS-PAGE) is a technique for separating proteins based on their ability to move within an electrical current, which is a function of the length of their polypeptide chains or of their molecular weight [25] . Also, SDS-PAGE is used to detect the changes in the protein concentration during metamorphosis [26] .
There are many studies on the changes in the proteins [26] -[28] and the molecular changes [29] -[33] during the metamorphosis of various amphibian species. Despite the availability of numerous studies on the electrophoretic analysis of the proteins [27] [28] [34] -[36] in adult amphibians, we still have inadequate knowledge about the changes in the proteins during larval development of uredelan and anuran species [26] [37] -[40] .
The present work aimed to acquire information about the changes in the proteins of Bufo regularis during metamorphosis, also using the random amplified polymorphic DNA (RAPD-PCR) assay to identify changes in DNA contents in the embryos of the Egyptian toad Bufo regularis.
2. Materials and Methods
2.1. Specimens Collection
Couple of male and female of Egyptian Bufo regularis was collected from fresh water pond at 1 km from River Nile at Assiut in July 2012 and transported to Fish Biology Laboratory at Zoology Department, Faculty of Science, Assiut University. After spawning the eggs ribbons placed in a separated glass aquarium filled with decolorized tap water. Close and continuous observations have been carried out during the early stage of cleavage. Our experiment started after hatching and when tadpoles begin to feed. The embryos at beginning of feeding were at stage 44 (4 days age and 6.8 mm length) [41] . Tadpoles were faded on brine shrimp (Artemia franciscana) three times a day and kept together in 50 L rectangular tanks containing decolorized tap water (conductivity 2000 ls/cm; pH 7.5; oxygen 88% - 95% saturation; temperature 27˚C - 28˚C; photoperiod 12:12 light: dark). When metamorphosis approaches, the water level in the aquaria was reduced and large pieces of stones and brackets were placed. The metamorphosing individuals usually hide in between these. These stones also enable the young tadpoles to emerge from the water and begin to breathe atmospheric air.
2.2. Experimental Setup
The adapted embryos were subdivided into 3 large tanks (200 embryos per each): the conditions of the experiment were as that of acclimatization with daily changing all the tap water. Fifteen embryos were randomly selected every three days (The selection every three days depends on the aberrant difference of morphological characters; the data listed below in Table 1), and stored at −80˚C until further analyses of the molecular preparations.
2.3. Total Protein Measurements
Total protein was determined according to [42] using Total protein kit for the “in vitro” determination of Total protein in serum or plasma/Egyptian company for Biotechnology (S. A. E.) Obour city industrial area. Block 20008 piece 19 A-Cairo. Egypt. Using spectrophotometer (Ultrospec 3100 pro, Biochrom Ltd) at 540 nm against reagent blank.
2.4. Protein Analysis by Polyacrylamide Gel Electrophoresis (SDS-PAGE)
Embryos (~0.1 g fresh weight) of each stage were suspended in 1.0 ml lysing buffer, heated at 100˚C for 5 min., centrifuged at 10,000 rpm for 30 min, and 50 μL of each extracted protein treatment was used for protein analysis using SDS-PAGE according to [43] in the first dimension. The low molecular weight standards (Pierce, USA) were run concurrently, and the protein molecular mass was determined using Gel-Pro Analyzer package V3.1 for Windows XP/NT (Media Cybernetica 1993-97).
2.5. DNA Extraction
DNA extracted from embryos using QIA amp DNA mini kit (50) Cat. No. 51304 from GIAGEN Gmbh, D- 40724 Hilden, Germany. 60 mg of the embryos pooling reserved at −80˚C were cutted into small pieces then added to 1.5 ml micro centrifuge tube containing 180 µl PBS. Homogenized using tissue Ruptor then added 100 µl ATL. 20 µl of protekinase K added mixed and incubated at 56˚C until complete lysis. 4 µl RNase added, mixed and incubated for 2 min at room temperature, centrifugation then added 200 µl buffer AL then centrifugation again. 200 µl ethanol (95% - 100%) added to the sample, mixed and centrifuged. The mixture was applied to QIAamp MINI spin column then centrifuged at 8000 rpm for 1 min and the filtrate discared. 500 µl buffer AW for washing added to the column the centrifuged at 8000 rpm and the filtrate discarded. Washing again and centrifuged at 14,000 rpm for 3 min. finally placed the spin column in a clean 1.5 ml microcentrifuge tube and discarded the tube containing the filtrate then 200 µl buffer AE incubated at room temperature for 1 min centrifuged at 8000 rpm for 1 min and the collection tube contained purified DNA. The amount of DNA was estimated using Spectrophotometer Gene Quant 1300 from (Healthcare Bio-Science AB, SE-75184 Uppsala, Sweden). Procedures of DNA extraction according to QIAamp DNA Mini Handbook 11/2007 (tissues part pg. 33-36).
2.6. Rapid-PCR Analysis
Only one primer was suitable and more scoreable bands giving used to determine genetic differences among embryos with sequence (5’-AGCTGGTGCAACGCCG-3’) and MW (g/mol) = 4907. PCR reaction was prepared according to the instructions provided with Go Tag® Green Master Mix; Cat. No. M7122 purchased from Pro

Table 1 Morphological characterization of different developmental stages of Bufo regularis.
mega Co. USA. The RAPD reaction was performed in a total volume of 25 µl [2 µl (20 pmol) primer, 2 µl purified DNA, 12.5 µl master mix and 8.5 µl DNA, RNA free water]. The reaction conditions involved initial denaturation of DNA for 5 minutes at 94˚C, 40 cycles of 1 min denaturation at 94˚C, 1 min annealing at 28˚C, 2 minutes extention at 72˚C and 10 minutes cycle at 72˚C for final extention. 4 µl of the PCR products were separated on 1% agarose gels using 250 bp Ladder DNA marker (250 bp - 4500 bp) purchased from Axygen Biosciences Co. stained with ethedium bromide, run in 1× TBE buffer at a constant voltage of 100 V. The bands were visualized with a UV trans illuminator (IVA-Vilber Lourmat, KAISER RS1, Germany) provided with video camera (CCD module N50, 49 mm, Japan) and documented using an Biodocanalyze (BDA) software ver. 2.64.8.1 (Biometra, D-37079 Göllingen, Germany). RAPD-PCR was done at Molecular Biology Research Unit, Assuit University, Egypt.
2.7. Data Analysis
All gels were analyzed using Gel-Pro Analyzer package (Media Cybernetica 1993-97) and the statistics ver. 8 software. Data were recorded as presence (1) and absence of bands from the PCR gel photographs. This data was then introduced to statistics ver. 8 software package in order to calculate the relationships between different developmental stages. According to the binary values (0, 1) and using Single linkage (Squared Euclidian distances).
2.8. Statistical Analysis
The basic statistics, means, standard divisions and ranges were estimated using the SPSS package [44] .
2.9. Ethical Statement
All experiments were carried out in accordance with the Egyptian laws and University guidelines for the care of experimental animals. All procedures of the current experiment have been approved by the Committee of the Faculty of Science of Assiut University, Egypt.
3. Results
3.1. Total Protein Concentration
Changes in the concentration of the total protein in different developmental stages of B. regularis were shown in Table 2, total protein concentration showed slightly increased in different developmental stages, except in stage 48 (increased in the length of hind limbs) and 55 (Third indentation of the foot paddle) slightly decreased in total proteins concentration was recorded.
3.2. Protein Electrophoresis
As recorded in Table 3, Table 4 and Figure 1, the protein fractions of different embryonic stages (44, 46, 48, 52, 54, 55, 64, and 66) used in the present work was identified in terms of their molecular weight and concentration. The two protein fractions (r1 and r2) were recorded in the stage 64 and stage 66 and disappeared in other developmental stages. Protein fraction, r7 and r9 are the fractions which persist only in the stage 66 with percentage (4.2757% and 8.0036% respectively) of the total protein in each individual. Protein fraction (r8) is appeared in all developmental stages, while protein fraction (r10) is the fraction which persists only in the stage 64 with percentage (7.156%) of the total protein in each individual. Dendrogram of proteins in Figure 2(a) shows the relationship among different developmental stages where protein in stages 55, 64 and 66 are only included since the other stages are similar to stage 55; So are not included in the cluster analysis.
3.3. Total DNA Concentration
Table 5 showed the DNA contents which exhibited an evident low values at the premetamorphic stage 44 (105.85 ± 0.519 ng/µl) compared with the other more advanced developmental stages 55 and 56 (204.056 ± 0.651 ng/µl and 234.55 ± 2.325 ng/µl, respectively).
Table 2. Total protein as mean ± SD (range) in different developmental stages of Bufo regularis.
Table 3. Protein fractions (%) identified in different larval stages of B. regularis.
Table 4. Molecular weight (in kda) identification of protein fractions in different larval stages of B. regularis.
Table 5. Total DNA as mean ± SD (range) in different developmental stages of B. regularis.
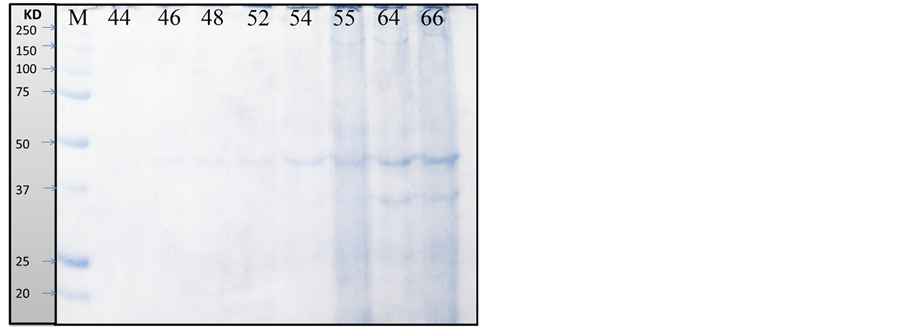
Figure 1. Protein fractions identified in different larval stages of Egyptian toad Bufo regularis, M; unstained protein marker (250 kda), lane 1; stage 44, lane 2; stage 46, lane 3; stage 48, lane 4; stage 52, lane 5; stage 54, lane 6; stage 55, lane 7; stage 64, lane 8; stage 66(staging according to Sedra and Michael, 1961).
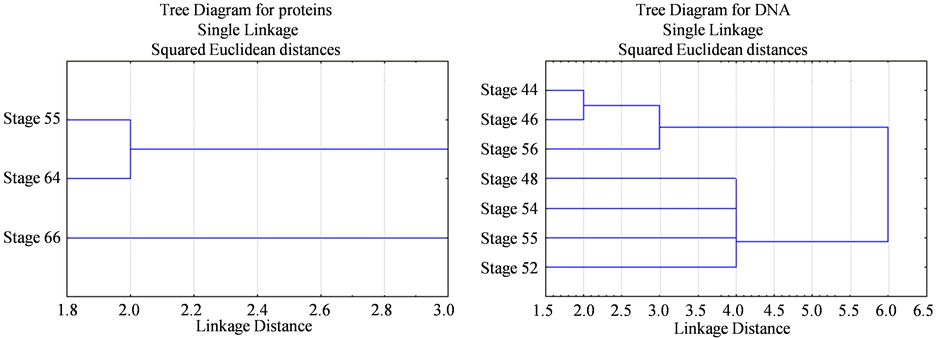 (a) (b)
Figure 2. Dendrogram representing the relationships among different developmental stages of Bufo regularis. (a) SDSPAGE of protein, Stage 55, stage 64, stage 66; (b) RAPD-PCR of DNA, stage 44, stage 46, stage 48, stage 52, stage 54, stage 55, stage 56.
3.4. Genetic Analysis of Developmental Stages
The main changes observed in the RAPD profiles (Figure 3) have resulted both in the appearance and disappearance of different bands with variations of their intensity as well (Table 6, Table 7). The RAPD band patterns produced by the primer with sequence (5’-AGCTGGTGCAACGCCG-3’) were recorded by UV tans illuminator and documented using a Biodoc analyzer software. Figure 2 give an overview of the RAPD band patterns obtained with primer in the different developmental stages. RAPD-PCR profile of a pool genomic DNAs from B. regularis shows different fractions, where the fraction (r1) appeared in all embryos, while the fractions (r2 and r13) disappeared in all of these developmental stages. DNA fractions, r3 appeared in just three stages (52, 54 & 55). Although, DNA fractions (r4 and r8) appeared in all developmental stages except in the stage 56; in contrast, r5 appeared only in the stage 56. While, DNA fractions (r6 and r14) appeared in the four developmental stages (stage 48, 52, 54 and 55), DNA fraction (r7) appeared in four stages (44, 46, 54 & 56). DNA fraction, r9 appeared in the stages (44, 46, 48 & 56) but not appeared in other developmental stages, while DNA fraction, r10 is only appeared in the four developmental stages (44, 46, 55 & 56). While, DNA fraction (r11) appeared in the stages (48, 54 & 55) but not appeared in another developmental stages, DNA fraction (r12) appeared only in
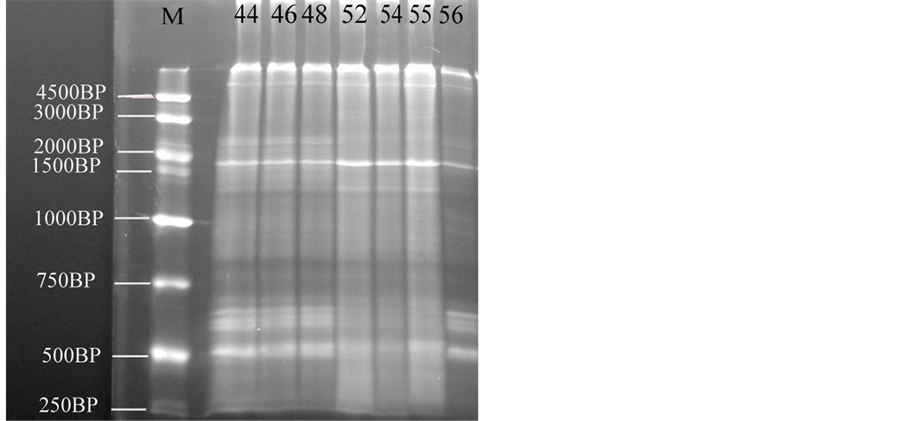
Figure 3. The electrophoresis pattern of the Egyptian toad Bufo regularis tadpoles genomic DNA using RAPD-PCR with single primer. lane 1, stage 44; lane 2, stage 46; lane 3, stage 48, lane 4, stage 52; lane 5, stage 54; lane 6, stage 55; lane 7, stage 56 (staging according to Sedra and Michael, 1961).
Table 6. DNA (%) identified in different larval stages of B. regularis.
Table 7. Molecular weight (in kda) identifications of DNA in different larval stages of B. regularis.
the stage 54 and 55, while DNA fraction (r15) appeared in all developmental stages except in the stage 52. DNA fraction (r16) appeared in all stages except in stage 48 and 54, while DNA fraction (r17) appeared in all stages except in the stage 52 and 55, but DNA fraction (r18) appeared in all developmental stages except in stage 46 disappeared, DNA fraction (r19) appeared only in the stage 46. Dendrogram of DNA in Figure 2(b) shows the pattern of relationship between the early developmental stages.
4. Discussion
In the present study, the potential use of the SDS-PAGE and RAPD-PCR methods for the detection changes on protein and DNA concentration on embryos was demonstrated. [15] [42] [45] has been reported that, the variability in these two parameters (molecular weight and concentration) and number of bands were evident reflecting variations in protein expression, embryonic stages and their interactions.
[42] indicated that the protein make up of an organism is of important diagnostic significance [46] [47] because of protein’s involvement in enzymes, hormones and antibodies as well as osmotic pressure balance and maintaining acid-base balance. In the present study fluctuation in protein concentration during larvae development was recorded. [48] reported that, an apparent down-regulation of gene could be a result of the larval type of cells that express it during tissue remodeling and these presumptive precursor cells might lose the ability to express the gene as they mature into the adult cells.
Electrophoresis (SDS-PAGE) of protein and identification of their fractions by molecular weight, number and concentration were studied in different stages of frog embryos. Our data recorded that a gradual increase was observed in the number of protein fractions in different developmental stages. These similar to [26] where they observed that an increase in the number of blood serum proteins of P. bedriagae especially in the concentrations of albumin and globulin fractions. [49] stated that an increase occurred in the concentration of serum protein fractions in anurans upon metamorphosis and that when metamorphosis was completed, while [50] has reported that the embryo proteins of Bombina variegate [51] , and Ichthyosaura alpestris increased in stages 28 to 36 [52] . Similar results were observed by [53] in L. pipiens. They revealed that the cytoplasmic ribosomes, in which protein synthesis takes place, increased in number with an increase in concentration of proteins. Along the developmental stages, we observed that new protein fraction appeared and this was in according with [50] who stated that the new protein fractions occurring during metamorphosis supposedly are involved in the synthesis of new proteins. Also, significant increases were observed by [54] [55] in the concentrations of serum proteins from the larval to the adult condition with completed metamorphosis in I. alpestris that were electrophoretically examined. [56] found an increase in the concentration of soluble proteins in the course of metamorphosis of P. waltl.
Our results indicated that DNA extracted from Bufo regularis embryos during metamorphosis induced RAPD profiles showed an increase in concentration of DNA from stage 44 (105.85 ± 0.519 ng/µl) to other advanced developmental stages (stage 56, 234.55 ± 2.325 ng/µl). These results were in agreement with [57] where they reported that Xenopuslaevis metamorphosis to be associated with variation in cellular DNA content. It has been reported that as Xenopuslaevis tadpoles developed from stage 35 to stage 57, their nuclear fluorescence as measured by flow cytometry increased significantly from stage 46 - 56 and then started to decrease [57] , they suggested that this increase in DNA could be due to gene amplification during larvae development. Also, they stated that highly significant increase in the DNA content of the premetamorphic stage 50 is possibly correlated to the active proliferation at this stage. In general, apoptosis is one of the most essential phenomena underlying the anuran remodeling from the larval to adult form [58] -[60] . In fact, DNA appeared more or less intact at both the larval stage 50 and the postmetamorphic stage 66. However, the premetamorphic stage 55 displayed limited degree of DNA fragmentation [3] . The DNA concentration increase may be due to due to relationship with growth in B. regularis tadpoles. The hypothesis we suggested about the appearance and disappearance of bands in different development stages may be due the genomic rearrangements structural changes in those embryos. The cluster analysis showed the relationships between the different developmental stages of Bufo regularis in terms of concentration of protein and DNA, and this was accordance with [15] [61] , which they reported that the cluster method is one of the most effective methods in numerical computation. Also, a dendrogram construction based on the hierarchical clustering method can show the relationships of every stage.
5. Conclusion
In conclusion, the result obtained from this study indicates that the amphibian metamorphosis is a complex process that has been speculated to involve DNA amplification and protein contents displayed different values during amphibian development. Also, SDS-PAGE and RAPD-PCR method can be used as an investigation tool for the evaluation of the molecular changes of the Egyptian toad during metamorphosis.
Acknowledgments
This research funded by the Ministry Higher Education from Libyan Government.
References
- Saad, Y.M., Hanaf, M.S., Essa, M.A., Guerges, A.A. and Ali, S.F. (2009) Genetic Signatures of Some Egyptian Clarias gariepinus Populations. Global Veterinaria, 3, 503-508.
- Sakr, S.A. and Shalaby, S.Y. (2012) Effect of Gibberellin-A3 on Metamorphosis in the Egyptian Toad Bufo regularis. Basic & Applied Zoology, 65, 153-156. http://dx.doi.org/10.1016/j.jobaz.2012.01.001
- Sakr, S.A., Badawy, G.M. and El-Borm, H.T. (2014) Ultrastructural and Molecular Changes in the Developing Small Intestine of the Toad Bufo regularis. Scientific World Journal, 2014, 1-13. http://dx.doi.org/10.1155/2014/986784
- Helbing, C.C., Werry, K., Crump, D., Domanski, D., Veldhoen, N. and Bialey, C.M. (2003) Expression Profiles of Novel Thyroid Hormone-Responsive Genes and Proteins in the Tail of Xenopus laevis Tadpoles Undergoing Precocious Metamorphosis. Molecular Endocrinology, 17, 1395-1409. http://dx.doi.org/10.1210/me.2002-0274
- Shi, Y.B. (2000) Amphibian Metamorphosis from Morphology to Molecular Biology. Wiley-Liss, New York.
- Denver, R.J., Pavhi, S. and Shi, Y.B. (1997) Thyroid Hormone-Dependent Gene Expression Program for Xenopus Neural Development. Biological Chemistry, 272, 8179-8188. http://dx.doi.org/10.1074/jbc.272.13.8179
- Freeman, J.L. and Rayburn, A.L. (2004) Metamorphosis in Xenopus laevis Is Not Associated with Large-Scale Nuclear DNA Content Variation. Experimental Biology, 207, 4473-4477. http://dx.doi.org/10.1242/jeb.01304
- Tata, J.R. (1994) Hormonal Regulation of Programmed Cell Death during Amphibian Metamorphosis. Biochemistry and Cell Biology, 72, 581-588. http://dx.doi.org/10.1139/o94-077
- Ishizuya-Oka, A. (2011) Amphibian Organ Remodeling during Metamorphosis: Insight into Thyroid Hormone-Induced Apoptosis. Development, Growth and Differentiation, 53, 202-212. http://dx.doi.org/10.1111/j.1440-169X.2010.01222.x
- Ioannou, Y.A. and Chen, F.W. (1996) Quantitation of DNA Fragmentation in Apoptosis. Nucleic Acids Research, 24, 992-993. http://dx.doi.org/10.1093/nar/24.5.992
- Williams, J., Kubelik, A.R., Livak, K.J., Rafalski, J.A. and Tinger, S.V. (1990) DNA Polymorphisms Amplified by Arbitrary Primers Are Useful as Genetic Markers. Nucleic Acids Research, 18, 6531-6535. http://dx.doi.org/10.1093/nar/18.22.6531
- Welsh, J. and McClelland, M. (1990) Fingerprinting Genomes Using PCR with Arbitrary Primers. Nucleic Acids Research, 18, 7213-7218. http://dx.doi.org/10.1093/nar/18.24.7213
- Savva, D. (1996) Use of DNA Fingerprinting to Detect Genotoxic Effect. Ecotoxicology and Environmental Safety, 41, 103-106. http://dx.doi.org/10.1006/eesa.1998.1674
- Bacerril, C., Ferrero, M., Sanz, F. and Castaño, A. (1999) Detection of Mitomycin C-Induced Genetic Damage in Fish Cells by Use of RAPD. Mutagenesis, 14, 449-456. http://dx.doi.org/10.1093/mutage/14.5.449
- Sayed, A.H., Mahmoud, U.M. and Mekkawy, I.A. (2013) Genotoxicity Induced by 4-Nonylphenol in Adult and Embryos of Clarias gariepinus. Global Advanced Research Journal of Environmental Science and Toxicology, 2, 107-118.
- Atienzar, F.A., Billinghurst, Z. and Depledge, M.H. (2002) 4-n-Nonylphenol and 17-β Estradiol May Induce Common DNA Effects in Developing Barnacle Larvae. Environmental Pollution, 120, 735-738.http://dx.doi.org/10.1016/S0269-7491(02)00184-7
- Atienzar, F.A. and Jha, A.N. (2004) The Random Amplified Polymorphic DNA (RAPD) Assay to Determine DNA Alterations, Repair and Transgenerational Effects in B(a)P Exposed Daphnia magna. Mutation Research/Fundamental and Molecular Mechanisms of Mutagenesis, 552, 125-140. http://dx.doi.org/10.1016/j.mrfmmm.2004.06.009
- Atienzar, F.A. and Jha, A.N. (2006) The Random Amplified Polymorphic DNA (RAPD) Assay and Related Techniques Applied to Genotoxicity and Carcinogenesis Studies: A Critical Review. Mutation Research/Reviews in Mutation Research, 613, 76-102. http://dx.doi.org/10.1016/j.mrrev.2006.06.001
- Cambier, V., Hance, T. and de Hoffmann, E. (2000) Variation of DIMBOA and Related Compounds Content in Relation to the Age and Plant Organ in Maize. Phytochemistry, 53, 223-229. http://dx.doi.org/10.1016/S0031-9422(99)00498-7
- Enan, M.R. (2006) Application of Random Amplified Polymorphic DNA (RAPD) to Detect the Genotoxic Effect of Heavy Metals. Biotechnology and Applied Biochemistry, 43, 147-154. http://dx.doi.org/10.1042/BA20050172
- Yoshida, N., Naka, T., Sengoku, T. and Ogawa, K. (2001) Toxicity and Mutagenesis of Chrysotile Asbestos to Agrobacterium radiobacter. Current Microbiology, 42, 398-402. http://dx.doi.org/10.1007/PL00021058
- Kumar, A., Tyagi, M.B. and Jha, P.N. (2004) Evidences Showing Ultraviolet-B Radiation-Induced Damage of DNA in Cyanobacteria and Its Detection by PCR Assay. Biochemical and Biophysical Research Communications, 318, 1025-1030. http://dx.doi.org/10.1016/j.bbrc.2004.04.129
- Atienzar, F.A., Cordi, B., Donkin, M.E., Evenden, A.J., Jha, A.N. and Depledge, M.H. (2000) Comparison of Ultraviolet-Induced Genotoxicity Detected by Random Amplified Polymorphic DNA with Chlorophyll Fluorescence and Growth in a Marine Macroalgae, Palmaria palmata. Aquatic Toxicology, 50, 1-12.http://dx.doi.org/10.1016/S0166-445X(99)00100-9
- Theodorakis, C.W., Bickham, J.W., Lamb, T., Medica, P.A. and Lyne, T.B. (2001) Integration of Genotoxicity and Population Genetic Analyses in Kangaroo Rats (Dipodomys merriami) Exposed to Radionuclide Contamination at the Nevada Test Site, USA. Environmental Toxicology and Chemistry, 20, 317-326. http://dx.doi.org/10.1002/etc.5620200212
- Sambrook, J., Fritsch, E.F. and Maniatis, T. (1989) A Laboratory Manual. Molecular Cloning, Cold Spring Harbor & Cold Spring Harbor Laboratory Press, New York, 1847-1859.
- Arikan, H. and Çeçek, K. (2011) Changes in Blood-Serum Proteins, Erythrocyte Count, and Size of Pelophylax bedriagae (Camerano, 1882) during Metamorphosis (Anura: Ranidae). Herpetozoa, 24, 3-11.
- Arikan, H., Çevik, E.E., Kaya, U. and Mermer, A. (2001) Anadolu’daki dag kurbagalarinda eritrosit lçümleri. Eskiehir. Anadolu University Journal of science and Technology, 2.
- Tosunowlu, M. and Arikan, H. (2007) A Serological Investigation of Pelodytes caucasicus and Pelobates syriacus (Amphibia, Anura) Populations in Turkey. Turkish Journal of Zoology, 31, 395-398.
- Van Bocxlaer, I., Roelants, K., Biju, S.D., Nagaraju, J. and Bossuyt, F. (2006) Late Cretaceous Vicariance in Gondwanan Amphibians. PLoS ONE, 1, e74.
- van der Meijden, A., Boistel, R., Gerlach, J., Ohler, A., Vences, M. and Meyer, A. (2007) Molecular Phylogenetic Evidence for Paraphyly of the Genus Sooglossus, with the Description of a New Genus of Seychellean Frogs. Biological Journal of the Linnean Society, 91, 347-359. http://dx.doi.org/10.1111/j.1095-8312.2007.00800.x
- Köhler, F. and Günther, R. (2008) The Radiation of Microhylid Frogs (Amphibia: Anura) on New Guinea: A Mitochondrial Phylogeny Reveals Parallel Evolution of Morphological and Life History Traits and Disproves the Current Morphology-Based Classification. Molecular Phylogenetics and Evolution, 47, 363-365.
- Bossuyt, F. and Roelants, K. (2009) Frogs and Toads (Anura). In: Hedges, S.B. and Kumar, S., Eds., The Timertree of Life, Oxford University Press, New York.
- Matsui, M., Hamidy, A., Belabut, D.M., Ahmad, N., Panha, S., Sudin, A., Khonsue, W., Oh, H., Yong, H., Jiang, J. and Nishikawa, K. (2011) Systematic Relationships of Oriental Tiny Frogs of the Family Microhylidae (Amphibia, Anura) as Revealed by mtDNA Genealogy. Molecular Phylogenetics and Evolution, 61, 167-176.http://dx.doi.org/10.1016/j.ympev.2011.05.015
- Özeti, N. and Atatür, M.K. (1979) A Preliminary Survey of the Serum Proteins of a Population of Mertensiella Luschani Finikensis Baoeowlu & Atatür from Finike in Southwestern Anatolia. Istanbul Universitesi Fen Fakültesi Mecmuas, Istanbul, 23-29.
- Arikan, H. (1990) Rana ridibunda (Anura, Ranidae) populasyonlari üzerinde morfolojik ve serolojik aratisrmalar. Turkish Journal of Zoology, 14, 40-83.
- Arikan, H. (1991) Göller Bölgesi Rana ridibunda Pallas (anura, ranidae) populasyonlarinin serolojik ynden incelenmesi. Journal of zoology, 15.
- Hollyfield, J.G. (1966) Erythrocyte Replacement at Metamorphosis in the Frog, Rana pipiens. Journal of Morphology, 119, 1-5. http://dx.doi.org/10.1002/jmor.1051190102
- Benbassat, J. (1970) Erythroid Cell Development during Natural Amphibian Metamorphosis. Developmental Biology, 21, 557-583. http://dx.doi.org/10.1016/0012-1606(70)90078-3
- Davis, A.K. (2008) Ontogenetic Changes in Erythrocyte Morphology in Larval Mole Salamanders, Ambystoma talpoideum, Measured with Image Analysis. Comparative Clinical Pathology, 17, 23-28.http://dx.doi.org/10.1007/s00580-007-0702-2
- Grenat, P.R., Bionda, C., Salas, N.E. and Martino, A.L. (2009) Variation in Erythrocyte Size between Juveniles and Adults of Odontophrynus Americanus. Amphibia Reptilia. Leiden, 30, 141-145.
- Sedra, S.N. and Michael, M.I. (1961) Normal Table of the Egyptian Toad, Bufo regularis Reuss, with an Addendum on the Standardization of the Stages Considered in Previous Publications. Cesk Morfol, 9, 333-351.
- Sayed, A.H., Mahmoud, U.M. and Mekkawy, I.A. (2011) Effects of 4-Nonylphenol on Metabolic Enzymes, Some Ions and Biochemical Blood Parameters of the African Catfish Clarias gariepinus (Burchell, 1822). African Journal of Biochemistry Research, 5, 287-297.
- Laemmli, U.K. (1970) Cleavage of Structural Proteins during Assembly of Head of Bacteriophage-T4. Nature, 227, 680-685.
- SPSS (1998) SPSS for Windows. SPSS Inc., Chicago.
- Mekkawy, I.A.A., Mahmoud, U.M., Osman, A.G. and Sayed, A.H. (2010) Effects of Ultraviolet A on the Activity of Two Metabolic Enzymes, DNA Damage and Lipid Peroxidation during Early Developmental Stages of the African Catfish, Clarias gariepinus (Burchell, 1822). Fish Physiology and Biochemistry, 36, 605-626. http://dx.doi.org/10.1007/s10695-009-9334-6
- Shalaby, S.M., Zakora, M. and Otte, J. (2006) Performance of Two Commonly Used Angiotensin-Converting Enzyme Inhibition Assays Using FA-PGG and HHL as Substrates. Journal of Dairy Research, 73, 178-186.http://dx.doi.org/10.1017/S0022029905001639
- Hadi, H.A.R., Al-Mahmeed, W., Al-Suwaidi, J. and Ellahham, S. (2009) Pleiotropic Effects of Statins in Atrial Fibrillation Patients: The Evidence. Vasc Health Risk Manag, 5, 533-551. http://dx.doi.org/10.2147/VHRM.S4841
- Amano, T., Noro, N., Kawabata, H., Kobayashi, Y. and Yoshizato, K. (1998) Metamorphosis-Associated and Region-Specific Expression of Calbindin Gene in the Posterior Intestinal Epithelial of Xenopus laevis larva. Development. Growth Differentiation, 40, 177-188. http://dx.doi.org/10.1046/j.1440-169X.1998.00007.x
- Herner, A.E. and Frieden, E. (1960) Biochemistry of Anuran Metamorphosis. VII Changes in Serum Proteins during Spontaneus and Induced Metamorphosis. Biological Chemistry, 235, 2845-2851.
- Chen, P.S. (1968) Patterns of Soluble Proteins and Multiple Forms of Dehydrogenases in Amphibian Development. Journal of Experimental Zoology, 168, 337-349. http://dx.doi.org/10.1002/jez.1401680305
- Linnaeus, C. (1758) Systema naturae per regna tria naturae, Secundum Classes, Ordines, Genera, Species, Cum Characteribus, Differentiis, Synonymis, Locis (in Latin). Laurentius Salvius, Stockholm.
- Harrison, R. (1969) Harrison Stages and Description of Normal Development of the Spotted Salamander, Ambystoma punctatum (Linn). In: Wilens, S., Ed., Organization and Development of the Embryo, Yale University Press, New Haven, 44-66.
- Brown, D.D. and Caston, J.D. (1962) Biochemistry of Amphibian Development: I. Ribosome and Protein Synthesis in Early Development of Rana pipiens. Developmental Biology, 5, 412-434.http://dx.doi.org/10.1016/0012-1606(62)90022-2
- Charlemagne, J. (1967) étude par électrophorèse et immunoélectrophorèse des protéines sériques de l’axolot (Ambystoma mexicanum SHAW). Bulletin de la société zoologique de France, 92, 739-748.
- Charlemagne, J. (1967) étude des protéines sériques de l’amphibien urodèle Triturus alpestris LAUR, chez l’adulte et au cours de la métamorphose. Bulletin de la société zoologique de France, 92, 153-160.
- Rakotoarivony, J. and Gasser, F. (1973) Analyse électrophorétique en gel de polyacrylamide des protéines solubles au cours du développement embryonnaire de l’amphibien urodèle Pleurodeles waltlii Michah. Annales d’embryologie et de morphogenèse, 6, 229-242.
- Fritz, B., Fritz, J. and Ulrich, W. (1990) Flow Cytometric Determination of Changes in Cellular DNA Content during Development of Xenopus laevis. In: Olmo, E., Ed., Cytogenetics of Amphibians and Reptiles, World Congress of Herpetology, Canterbury, 129-133.
- Kaltenbach, J., Fry, A., Colpitts, K. and Faszewski, E. (2012) Apoptosis in the Digestive Tract of Herbivorous Rana pipiens Larvae and Carnivorous Ceratophrys ornata Larvae: An Immunohistochemical Study. Journal of Morphology, 273, 103-108. http://dx.doi.org/10.1002/jmor.11010
- Lalremsanga, H. and Hooroo, R. (2012) Remodeling of the Intestine during Metamorphosis of Microhyla Berdmorei (Anura: Microhylidae). International Multidisciplinary Research Journal, 2, 35-40.
- Brown, D. and Cai, L. (2007) Amphibian Metamorphosis. Developmental Biology, 306, 20-33.
- Zhiy, I.R. and Haowen, Y. (2004) A Method for Genotoxicity Detection Using Random Amplified Polymorphism DNA with Danio rerio. Ecotoxicology and Environmental Safety, 58, 96-103. http://dx.doi.org/10.1016/j.ecoenv.2003.09.016