Advances in Biological Chemistry
Vol. 2 No. 3 (2012) , Article ID: 21797 , 11 pages DOI:10.4236/abc.2012.23025
A proteomic approach to investigate the qualitative and quantitative polymorphism of β-lactoglobulin in ovine milk: Inference on gene copy-number variations
![]()
1Institute of Food Science and Technology, National Research Council of Italy (CNR), Avellino, Italy
2Department of Science Agriculture, Food, & Environment (SAFE), University of Foggia, Foggia, Italy
3Department of Food Science, University of Naples “Federico II”, Naples, Italy
4Department of Animal Production, University of Bari, Bari, Italy
Email: Hpicariello@isa.cnr.itH, Ha.diluccia@unigf.itH, Hferranti@unina.itH, Haddeo@unina.itH, *Hllng01ag@agr.uniba.itH, *Helisa.pieragostini@uniba.it
Received 23 April 2012; revised 30 May 2012; accepted 8 June 2012
Keywords: Quantitative Polymorphism; b-Lactoglobulin; HPLC-ESI MS; MALDI-TOF Mass Mapping; Gene Duplication; Gene Arrangements; Copy-Number Variations (CNVs)
ABSTRACT
The rationale of this work is based on recent evidences suggesting that: 1) both qualitative and quantitative β-lactoglobulin (β-LG) polymorphism may be found in bovine milk; 2) quantitative polymorphisms are often the result of expression gradients in multiple copies of a gene; 3) the β-LG gene is duplicated in the dog and bovine genome; 4) mammary genes are highly conserved across Mammalia. Thus, an investigation was conducted on ovine β-LG polymorphism checking phenotypic evidence for copy-number variants of β-LG in sheep. To the purpose, 206 milk samples were collected, during a small-scale survey within sheep farms breeding Southern Italian breeds. PAGIF screening of the samples revealed that approximately 50% individuals exhibited β-LG polymorphism and 4 different quantitative patterns, which were characterized in detail by a proteomic approach relying on combined chromatographic and mass spectrometric techniques. The expected figures based on the expression gradient models were compared with well-established α-globin gene arrangements in sheep. The different phenotypes suggest the presence of both duplicate and triplicate BLG haplotypes. The occurrence of a triplicate haplotype was supported by population data. The current study supports the helpfulness of up-to-date proteomics for inferring copy number polymorphisms through the characterization of the phenotypic expression.
1. INTRODUCTION
β-Lactoglobulin (β-LG) is the major whey protein of ruminants and most mammals, but it is missing in the milk from rodents, lagomorphs and human [1]. According to its amino-acid sequence and 3-dimensional structure, it belongs to the lipocalins, a wide family of proteins that bind small hydrophobic ligands. Although it is well established that β-LG acts as a transporter of hydrophobic as well as other small molecules [2], its biological function is not yet fully understood [3]. In ruminants β-LG consists of a mature polypeptide chain of 162 amino acid residues containing five cysteines, four of which engaged in intramolecular disulphide bridges. A number of allelic variants of β-LG are known for cattle and other species. The detection of A and B genetic variants of β-LG in cow milk was the first evidence of the lactoprotein genetic polymorphism [4]. In ewe milk three genetic variants of β-LG have been described, namely β-LGA, β-LGB [5,6] and β-LGC [7]. Ovine β-LGA and β-LGB differ exclusively for the Tyr20àHis20 exchange [5,8]. β-LGC is a subtype of ovine β-LGA in which Arg148 is replaced by Gln148 [9]. Of the three variants encoded by the alleles at the ovine BLG locus, β-LGA and β-LGB are present in almost all the breeds analyzed, the former generally being the most frequent one, whereas the BLGC allele is rather rare and confined to specific breeds [10].
As far as the quantitative genetic polymorphism is concerned, differential protein expression associated to different nucleotide substitutions in the 5’-flanking region of the BLG gene has been detected [11,12]. According to Dove [13], mutations with impact on gene expression have been identified in various ruminant species. However, available evidence in mammalian genetics suggests that a quantitative polymorphism may also reflect the presence of gene duplication. A recent insight on bovine lactation genome [14] revealed that, compared to other genes, milk-related and mammary genes are more likely duplicated in therians. The most divergent proteins in milk were associated with nutritional and immunological components of milk, whereas proteins involved in secretory processes are highly conserved across Mammalia [3]. Accordingly, it has been recently evidenced that the occurrence of several, differently expressed α-lactalbumin (α-LA) gene products in water buffalo are related to the presence of two tandemly repeated sequences [15]; preliminary results suggest that an analogous duplication should occur both in sheep and cattle [16,17].
With the completion of the Bos taurus genome assembly, bovine milk and lactation data can be linked to other mammalian genomes for the first time, providing additional insight into the molecular evolution of the milk composition and lactating machinery [14]. Both copy number and sequence variation contribute to the diversity of milk protein composition across species. On this basis, Liu et al. [18] found that some cattle copy number variations (CNVs) are likely to arise independently in breeds and contribute to breed differences. Pioneered by the study on α-globin gene clusters, CNV has recently gained considerable interest as a source of genetic variation likely playing a role in phenotypic diversity. By ortholog analysis Lemay and his co-workers [14] provided evidence that the gene for β-LG is duplicated in the dog and bovine [14]. In the bovine genome, the duplicated gene is located at the position of a previously predicted pseudogene [19], confirming Ohno’s inferences [20] according to which all of the new genes arose from redundant copies of the preexisted genes. Thus, the presence of the BLG* pseudogene as the result of a recent gene conversion event was confirmed in bovine, sheep and goat [21].
Tandemly arrayed gene duplicates are often conserved between species [22] and other multigene families such as the olfactory receptor genes [23] and the HOX genes [24,25]. Current evolutionary ideas about gene duplication had their origin in the arrangement of haemoglobin genes. In addition, interest in the haemoglobin genes is fuelled also by the different patterns of α-globin gene expression related to the number and location of genes in the cluster [26,27].
Thus, based on the above considerations and on the fact that systematic surveys of the copy number and expression of whey protein genes within ruminant species have not been performed, this work aimed to investigate the ovine β-LG qualitative and quantitative polymorphism searching for phenotypic evidence of CNVs of BLG in three Mediterranean sheep breeds. Moreover, as quantitation remains a vital analytical component to the initial identification of phenotypic expression, the starting point of this research was the measurement of protein levels, by means of highthroughput technologies. To this purpose, combined identification and quantification of the β-LG variants were achieved by liquid chromatography (LC)-electrospray (ESI)/ mass spectrometry (MS). Protein assignment was confirmed by MALDI-TOF peptide mass mapping.
2. MATERIALS AND METHODS
2.1. Samples and Chemicals
Individual milk samples were collected following a convenience sampling method from 206 ewes belonging to 3 native Southern Italian dairy sheep breeds; in detail, a total of 62 and 72 individual samples were respectively collected from single flocks of over 300 purebred Comisana and Valle del Belice sheep, while as to Laticauda a total of 72 samples were collected by sampling 17, 23 and 32 ewes from three isolated different flocks as small as 25 - 35 head with only one or two rams used per season. Milk samples (100 mL) were manually milked into sterile polystyrene containers. To prevent undesired proteolysis, phenyl-methyl-sulfonyl fluoride (PMSF) was added at the final concentration of 1 mM; milk was immediately frozen and stored at –80˚C until use. Skim milks were obtained by centrifugation at 4000 rpm for 20 min at 4˚C (Labofuge 400R, Heraeus Instruments, Hanau, Germany). After fat removal with a spatula, casein was separated by isoelectric precipitation according to Aschaffenburg and Drewry [28]; 20 mL of skimmed milk were diluted threefold with distilled water, acidified with 1 mL 10% (v/v) acetic acid and adjusted to pH 4.6 with 1 M sodium acetate buffer. Samples were kept for 30 min at 37˚C and then centrifuged (4500 rpm, 4˚C, 10 min). Trifluoroacetic acid (TFA), dithiothreitol (DTT), iodoacetic acid, PMSF, α-cyano-4-hydroxycinnamic acid (4-CHCA) and sinapinic acid were provided by Sigma-Aldrich (Milan, Italy). All chemicals and solvents were analytical grade or better. Ammonium bicarbonate, reagents and HPLC-grade solvents from Carlo Erba (Milan, Italy) were used without any further purification. Sequencing-grade modified trypsin was supplied by Promega (Madison, WI, USA).
2.2. Purification of Whey Proteins
Supernatants (milk whey) were filtered through MillexTM 0.44 µm membranes (Millipore, Badford, MA, USA). To purify whey proteins from saline contaminants and lactose, 3 mL of whey solution were loaded onto Sep-pak C18 cartridges (Waters, Milford, Ma, USA) previously equilibrated in 0.1% TFA (v/v). Proteins were extensively washed with 0.1% TFA (10 mL) and eluted with 70% acetonitrile (v/v) containing 0.1% TFA. Protein solutions were concentrated and finally lyophilized.
2.3. Electrophoretic Analysis
Isoelectric focusing was performed in the presence of carrier ampholytes, the 4.2 - 5.4 pH gradient was obtained by mixing pH 4.2 - 4.9 and 4.5 - 5.4 Pharmalyte (Amersham Bioscience) in a 1:1 volume ratio. Gel stock solution was prepared with 10% acrilammide-bisacrilammide (C = 2.6%), 7.8 M Urea, 6.3% a mixture of 1.2% ammonium persulfate and 0.05% TEMED. Electrode solutions were 1 M phosphoric acid (anode) and 0.1 M. NaOH (cathode). Protein separation was carried out in 0.5 × 10 × 240 mm polyacrylamide gel. Proteins were electrophoresed using Multiphore II (Pharmacia-LKB, Bromma, Sweden) and electrophoresis power supply EPS3501XL Amersham Bioscience. Prefocusing was carried out for 20 minute at 11˚C, 1000 V, 150 mA and 16 W maximum. Whey protein samples (10 µl) were applied near the cathode and focused for 3 hours 11˚C, 1200 V, 150 mA, and 16 W maximum. The gels were fixed in 12% trichloroacetic acid (TCA) for 30 min at 25˚C rinsed with 20% methanol to eliminate residual TCA. The gel were stained with 0.2% Coomassie G-250 in 1 M sulphuric acid for 2 hours and destaining in distilled water.
2.4. HPLC Separation of Whey Proteins
In order to perform further characterization, whey proteins from all the polymorphic samples were isolated by reversed phase-high performance LC (RP-HPLC) performed using an HP 1100 modular system (Agilent Technology, Palo Alto, CA, USA) equipped with a Vydac (Hesperia, CA, USA) C4 column (214TP52, 5 mm, 250 × 2.1 mm i.d.), and then by applying a linear gradient from 35% to 55% of solvent B (0.1% TFA in acetonitrile, v/v) over 60 min at a flow rate of 0.2 mL/min; solvent A was 0.1% TFA in water (v/v). For each analysis approximately 80 mg of whey proteins, dissolved in 0.1% TFA, were injected. Column effluents were monitored by UV detection at 220 and 280 nm. Protein fractions were manually collected and either used for mass spectrometry analysis, directly or after concentration under a vacuum, or lyophilized before enzymatic digestion.
2.5. Quantification of α-LA/β-LG Ratio
The areas under the peaks corresponding to the α-LA and β-LGB (Figure 1) were measured by integration of the l = 220 nm UV-chromatograms (means of three replicate analyses). The percentage values do not include the contribution of the glycosylated a-LA. The sum of the relative areas was set at 100 and then the proportion of α-LA and β-LG estimated. Quantitative values are mean of three replicate analyses.
2.6. Quantification of BLG Polymorphic Phenotypes
Where the sample exhibited two β-LG peaks, the areas under the peaks corresponding to β-LGA and β-LGB were computed and compared following the procedure described in the previous point. Out of the 102 polymorphic samples, six individual whey sera exhibiting aberrant β-LGA/β-LGB ratio as well as two normal ones characterized by the common 1/1 ratio underwent MS and further structural analysis as described next in the pertinent section.
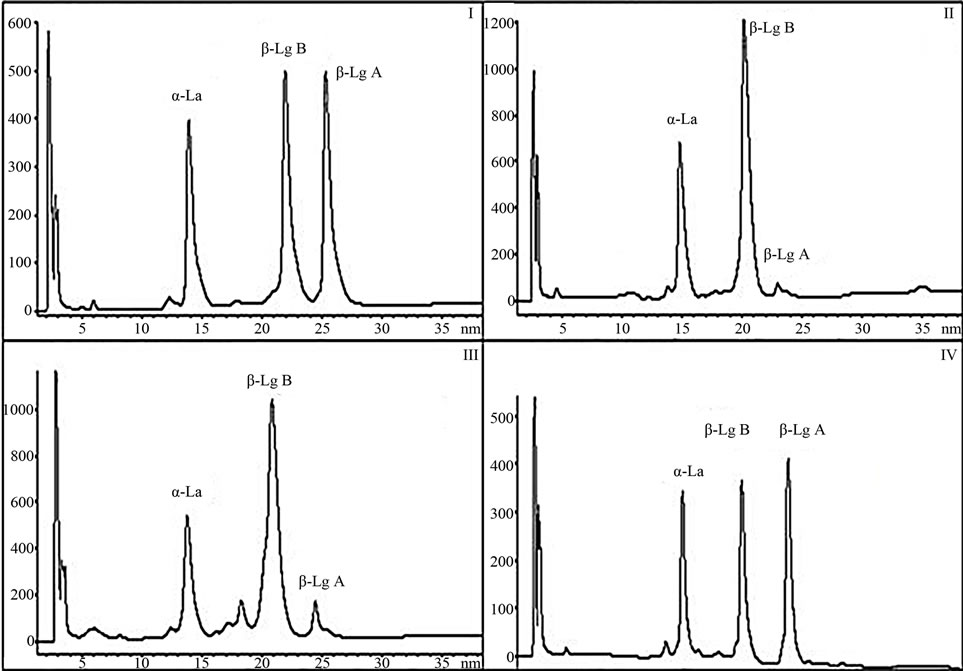
Figure 1. The common BLGAB phenotype (I) characterized by 50/50 ratio is compared by RP-HPLC analysis to the three phenotypes of sample (II), sample (III) and sample (IV) exhibiting respectively the following aberrant ratios: 93.6/6.43, 86.6/13.4 and 56/44.
2.7. HPLC-ESI MS
For HPLC-MS analysis, the whey proteins were fractionated using the same apparatus and the conditions described above. Liquid effluents from the column were directly injected into the ESI source of a VG Platform (Waters/ Micromass, Manchester, UK) single quadrupole mass spectrometer via a 75-μm i.d. fused silica capillary. The ESI mass spectra were scanned from m/z 1800 to 600 at a scan cycle of 4.90 sec/scan and 0.1 sec inter-scan delay. The source temperature was 180˚C and N2 was used as both the drying and nebulizing gas. Spectra were acquired in the positive ion mode; the capillary voltage and the cone voltage were 3.6 kV and 40 V, respectively. Spectra were processed using the MassLynx 2.3 (Waters/Micromass) software furnished with the instrument. The analyses were performed at least in triplicate to check for the repeatability of the HPLC/MS analysis.
2.8. Peptide Mapping of β-Lg
In order to confirm the identity of the two variants, β-Lg A and B were isolated by RP-HPLC, using the same above apparatus equipped with a C4 column, 5-µm 250 × 4.6 mm i.d. (Vydac). For each injection 0.5 mg of whey proteins, dissolved in 0.1% TFA, were separated. In order to collect enough proteins, in the case of samples with an aberrantly low amount of β-LGA (samples II and III) three different HPLC runs were carried out and the peaks at similar retention times pooled. Purified proteins were dried, dissolved in 1 mL of a denaturing/reducent buffer containing 6 M guanidine HCl, 100 mM Tris HCl, 1 mM EDTA and 10 mM DTT at pH 8.0 and incubated 90 min at 56˚C. Cysteines were alkylated with a 3-fold molar excess of iodoacetic acid (5.6 mg) for 45 min at room temperature in the dark. Proteins were desalted by gel filtration through Sephadex PD-10 pre-packed columns (GE Healthcare, Uppsala, Sweden), eluting with 50 mM ammonium bicarbonate, quantified with the Bradford assay and finally freeze-dried. Cys-alkylated β-Lg were subjected to tryptic hydrolysis in 0.2% (w/v) ammonium bicarbonate, pH 8.5, for 6 h at 37˚C with an enzymeto-substrate ratio of approximately 1/100 (w/w).
2.9. Matrix Assisted Laser Desorption Ionization-Time of Flight (MALDI-TOF) Mass Spectrometry
MALDI-TOF MS analyses were performed on a Voyager DE-Pro spectrometer (PerSeptive BioSystems, Framingham, MA, USA) equipped with an N2 laser (l = 337 nm). For the analysis of peptides arising from the hydrolysis of proteins, 4-CHCA was used as the matrix, prepared by dissolving 10 mg in 1 mL of aqueous 50% (v/v) acetonitrile containing 0.1% (v/v) TFA. The instrument operated with an accelerating voltage of 20 kV. External mass calibration was performed with the signal of the matrix dimer at [M + H]+ = 379.05 and with the monoisotopic masses of peptide standards, including angiotensin I ([M + H]+ = 1296.68), ovine αs1-casein 1-23 peptide ([M + H]+ = 2764.55) and bovine insulin ([M + H]+ = 5730.61), achieving an accuracy in the measurement of peptide mass better than 75 ppm. For the analysis of peptides, the mass spectra were acquired in the positive, reflector ion mode using Delay Extraction (DE) technology. In the reflector ion mode, resolution at the full width/half maximum of the peak was normally ≥5000. Raw data were analyzed using the software program furnished by the manufacturer.
2.10. Peptide Recognition
Signals in the mass spectra were associated with the corresponding tryptic peptides based on the expected molecular mass from the ewe a-La and β-Lg sequences, taking into account enzyme specificity using several bioinformatics tools, such as the GPmaw 5.0 software (Lighthouse data, Odense, Denmark) or other online resources. In addition, the peptide assignment was confirmed by MS/MS fragmentation data.
2.11. Data Analysis
The genepop program was used to estimate gene and haplotype frequencies [29] both in each flock and in the whole sample.
2.12. Nomenclature
The COGNOSAG nomenclature guidelines have been followed throughout this paper for naming loci [30]. Thus, the locus name was written in a combination of Latin letters and Arabic numerals indicating the gene position in the cluster, particularly numerals are placed immediately after the gene stem symbol, without any space between the letters and numbers used.
3. RESULTS AND DICUSSION
According to the scientific method the results of the investigation can be described following four steps. First, the observation and description of a phenomenon, namely the presence of four quantitative patterns of β-LGA and β-LGB morphs, observed after phenotyping all samples by PAGIF and RP-HPLC. Second, once the analytical identification of the two molecular species was obtained, the theoretical tools for understanding the phenomenon had to be decided on to formulate a hypothesis for the presence of CNVs at the BLG locus. Third, on the basis of this hypothesis the existence of gene and genotype arrangements had to be inferred and the expected results had to be compared to the observations. Then, based on population data, an analysis was carried out testing Hardy Weinberg and other population parameters to evaluate whether the numbers of the suggested genotype arrangements are consistent with the expected probability. In the following subsections the relevant points in each step are described.
3.1. β-LG Polymorphism
In Figure 1, the common BLGAB phenotype characterized by a 50/50 ratio is compared by RP-HPLC analysis to the three phenotypes exhibiting aberrant expression ratios. As previously described, the six samples showing an aberrant phenotype were analyzed together with two normal one, in order to check whether the molecular species in the aberrant HPLC fractions were to ascribe to those already known or to new β-LG variants.
The protein components were assigned according to the chromatographic order of elution and the identification was confirmed by ESI-MS (Table 1). Based on the relative hydrophobicity of the whey proteins, the pattern of elution showed the a-LA peak, preceded by minor amount of glycosylated a-LA and followed first by β-LGB and second by β-LGA.
The average values of the peak abundances for the major whey proteins, measured by integration of the l = 220 nm UV-chromatograms are reported in Table 2. The percentage values do not include the contribution of the glycosylated a-LA. The relative amount of the two β-LG variants, expressed as the β-LGB/β-LGA ratio, obtained averaging 96 normally polymorphic samples, ranged around 50/50. Unexpectedly, extremely disproportioned β-LGB/β-LGA ratio was observed for the samples II and III (Figure 1), reaching the outermost values of 86.6/ 13.4 and 93.6/6.43 (Table 2), respectively.
Based on these observations attention was focused also to the four samples characterized by a 1.3 ratios ranging around 56/44, the chromatogram of one of which (sample IV) being shown in Figure 1.
The HPLC-ESI MS analysis of the samples II and III, confirmed that the very low abundance peaks occurring at the retention times of the β-LGA contained a protein with the expected MW for the β-LGA.
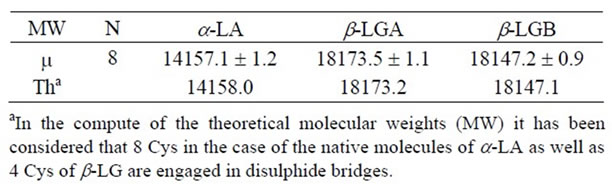
Table 1. Molecular weights (MW) of the a-LA, β-LGA and bLGB obtained averaging the experimental measures (m) of the eight analyzed ovine milk samples compared to the respective theoretical ones (Th); particularly the signals in the mass spectra were associated with the corresponding tryptic peptides based on the expected molecular mass from the ewe a-La and β-Lg sequences.
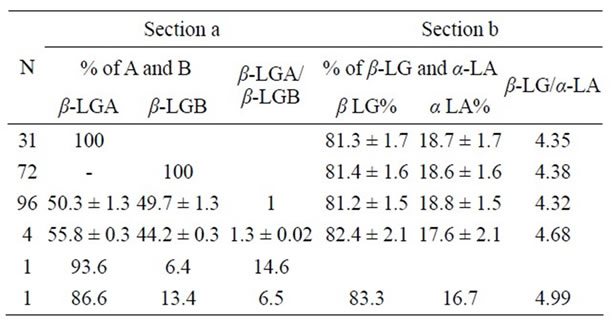
Table 2. Section a: b Lactalbumin output of BLG genes (β-LGA = A and β-LGB = B) based on the area percentage of the corresponding peak in the HPLC chromatogram; in the third column the β-LG A/β-LGB rate values evaluated in ovine β-LG polymorphic samples. Section b: Total Percentage values (%) of β-LG and a-LA as well as the related ratio are shown.
In order to confirm the assignment by MALDI-TOF MS peptide mass mapping, the proteins were isolated through a separate RP-HPLC analysis, reduced, alkylated and digested by trypsin. As an example, Figure 2 shows the MALDI spectra of the tryptic digest of the two β-LG variants isolated from the sample II. The assignment of the peptide ion signals, reported in the Figure 2, confirmed the β-LGA identity, distinct from the B variant exclusively for the single amino acid substitution His20®Tyr20.
The amino acid substitution was evident from the MW shift of the signal m/z 2682.4 in the spectrum of variant B replaced by m/z 2707.2 in the spectrum of variant A (Figure 2). Section (a) in Table 2 then provides the output of BLG genes inferred from the RP-HPLC chromatographic peaks while section (b) shows the β-LG percentage values with respect a-LA evaluated in ovine β-LG polymorphic milk samples.
3.2. Differential Expression of Ovine β-LG Variants in Heterozygous Individuals
The results recorded in the β-LG polymorphic individuals might be justified by a non-allelic polymorphism at the BLG locus. Particularly they suggest one triplicated and two duplicated haplotypes. The pattern of quantitative variations indicate a normal condition of a duplicated gene arrangement composed by two copies of the same gene BLGA or BLGB and a rare triplicate one in which a third gene BLGA follows a couple of BLGB genes.
Table 3 shows the assignment of the individual gene relative position in ovine BLG haplotypes based on the model of expression gradient recorded in the a-globin gene cluster [31,32]. The regulation of expression in multigene families [26] appears to be consistent with the hypotheses of the b-transcriptional regulation of the BLG gene and the presence of the activator protein-2 transcription factor as a modulator of gene expression of β-LG [33,34]. Then the proposed assessment of BLG haplotypes is shown in
Figure 2. The MALDI spectra of the tryptic digest of the two β-LG variants isolated from the sample II and compared one another. The assignment of the peptide ion signals confirmed the β-LGA identity, distinct from the β-LGB variant exclusively for the single amino acid substitution His20®Tyr20. The amino acid substitution was evident from the MW shift of the base peak m/z 2682.4 in the spectrum of variant B replaced by m/z 2707.2 in the spectrum of the A variant.
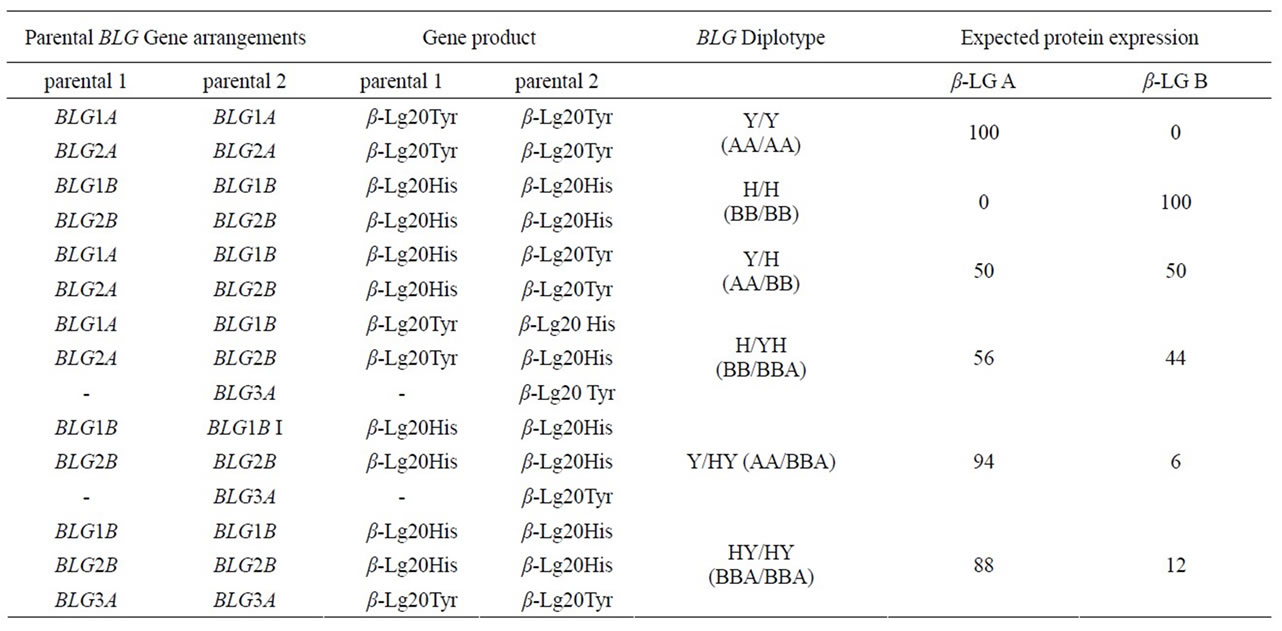
Table 3. BLG haplotypes and diplotypes based on their expression determined by the relative protein proportions.
Figure 3. Moreover, by examination of the data in Section (b) of Table 2, it emerged a seemingly surplus of protein recorded in the triple BLG haplotypes that may suggest an over-expression related to the increased gene dosage. In fact, there are evidence that increased copy numbers of a particular gene enable the synthesis of an additional amount of protein [32,35,36]. Then the association between the number of BLG genes and the β-Lg/a-La ratio values was checked by the regression analysis. The two variables seem to be positively and linearly correlated, though, owing to the small sample size of the BLG extra numeral phenotypes, the regression coefficient appears not significant.
3.3. Nomenclature
Generally speaking, nomenclature is a necessity in organizing information about biodiversity; in the case of CNVs related to functional genes, the problem concerns not so much the single gene arrangements (haplotypes) but rather the diplotypes which risk to be very confusing. In our previous experience with a-globin gene arrangements, for sake of simplicity, the haplotypes have been named according to the single-letter amino acid (a. a.) code referred to the point mutation characterizing the genes in the haplotypes [37]. Similarly, the duplicate BLG arrangements, might been tentatively named Y and H; in fact the former arrangement is composed by two copies of the BLGA gene encoding for the β-LGA which exhibits tyrosine (Y) at position 20 while the latter arrangement is composed by two BLGB genes with histidine (H) at codon 20. Accordingly, the triplicated haplotype being composed by
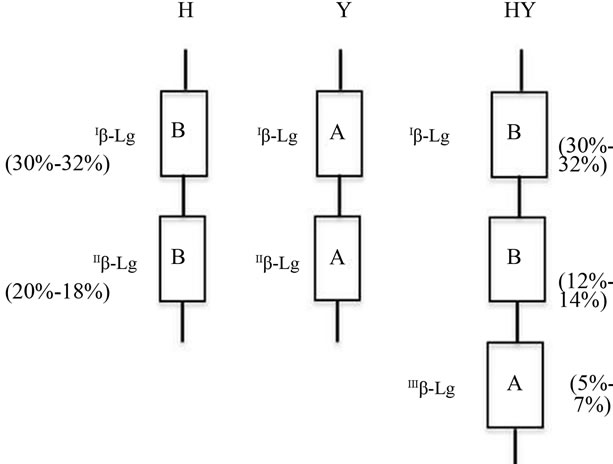
Figure 3. BLG haplotypes as proposed according to the quantitative polymorphism recorded and to the model of expression gradient assessed in the alpha globin gene cluster. The gene efficiency (%) is indicated in parenthesis. b-lactoglobulin genes are indicated by the usual name of the gene products. b-lactoglobulin haplotypes are indicated by the capital letter corresponding to the relevant point mutation of the genes in the cluster (H = His20; Y = Tyr20).
2BLGB + 1BLGA was named HY. Figure 3 represent the suggested three haplotypes while the diplotypes found are listed in Tables 3 and 4.
3.4. BLG Haplotype Frequency
Genotype frequencies at the BLG system in the different flocks and in the whole sample are shown in Table 4. All the flocks were polymorphic as to the BLG system though genotype and haplotype frequency differences between the flocks were observed. Predominance of BLGY haplotype was generally found, the overall frequency being around 0.59%. Remarkable differences in the distribution of the three haplotypes were also evident. As an example, HY frequency ranged from 0.0 to 0.09 in different flocks. As to the overall samples, 37% homozygote for the haplotype H and 15% homozygote individuals for the haplotype Y were found; HY were 47% out of the remaining 51% individuals, exhibiting β-LGA and β-LGB in a 1/1 ratio, while 3% showed different quantitative polymerphism (Table 4). The homozygote samples H/H and Y/Y expressed 100% of β-LG B and 100% of β-LGA respecttively, while the heterozygotes Y/H expressed 50% of β-LGA and 50% of β-LGB. In the triplicated haplotypes, based on the expression gradient [27,32] the ILGB, IILGB and IIILGB genes are expected to exhibit a 30%, 12% and 6% of total β-LG expression respectively (Figure 3). Triplication implies that the HY haplotype β-LGB is encoded by the upstream genes (IBLG and IIBLG) and β-LGA by the downstream gene IIILGB. Then the diplotype arrangements give account for the observed quantitative polymorphism (Table 3).
As to the qualitative polymorphism—that is the occurrence of the β-LG A and B variants in the sheep in this study—the results obtained based on a convenience sampling method are not necessarily representative of the examined breeds. Anyway they are similar to that reported for the Mediterranean dairy sheep populations [38]. Particularly, Valle del Belice frequency values are in agreement with Giaccone et al. [39] and Comisana exhibit similar values to the data reported by Chiofalo et al. [40].
By comparing the data shown in Tables 4 and 5 some discrepancies may be noticed between the observed and expected diplotype frequencies. Particularly, in the Comisana sample as well as in the Valle del Belice only the Y/HY diplotype was found, deviation from Hardy-Weinberg equilibrium being supposedly caused by non-random mating practiced in the field conditions; moreover according to the HY haplotype frequency no homozygotes should have been found; conversely, the HY/HY homozygote present in the Laticauda sample was found together with a H/HY heterozygote in the same small flock suggesting that a possible allele concentration might be the result of the overlapping effects of non-random mating practice and inbreeding.
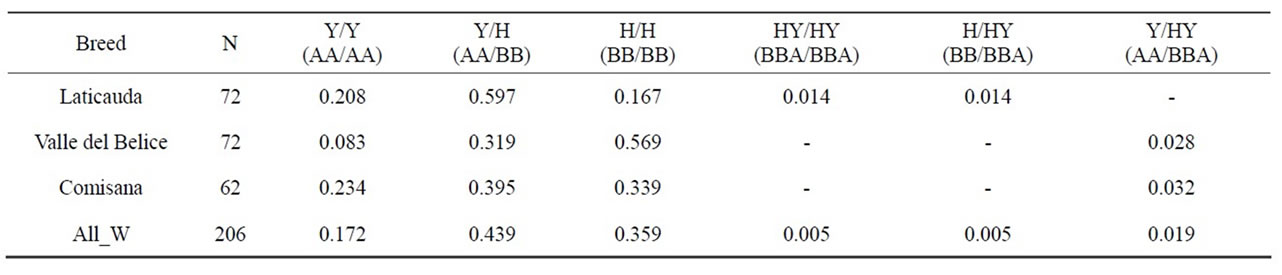
Table 4. Diplotype frequency values recorded in southern Italian sheep. The last row shows the overall weighted frequency (All W) of each diplotype.
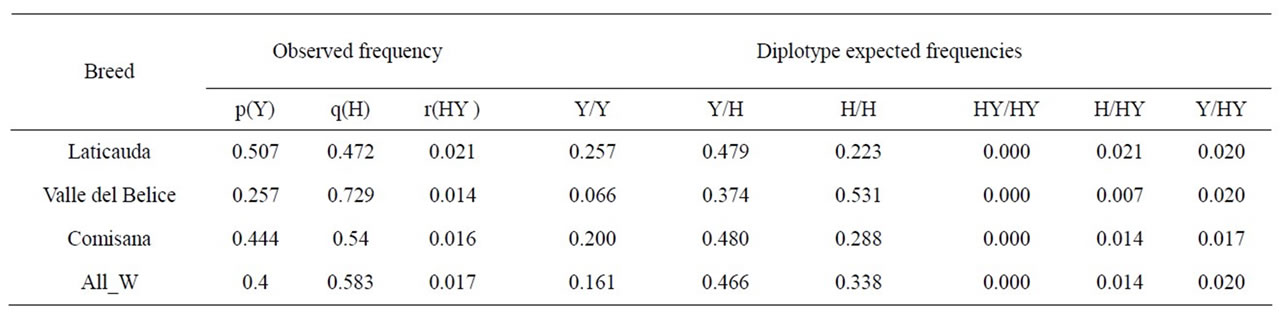
Table 5. Haplotype frequency values recorded in southern Italian sheep and diplotype expected frequencies calculated on the basis of the observed haplotype frequencies. The last row shows overall weighted frequency (All W) of each haplotype or diplotype.
4. CONCLUSIONS
In the introductory section, based on experimental and theoretical considerations, we have formulated the hypothesis that the BLG locus is most likely duplicated. Taken together the results of the investigation performed on the ovine β-LG qualitative and quantitative polymorphism seems to confirm our assumption.
However, in our previous investigations on a-globin gene family in buffalo, cattle, and horse [41-43] the proteomic approach allowed us to detect a range of quantitative phenotypes associated to differently duplicated gene arrangements. Conversely, the phenotypic data in this investigation support the BLG duplication only in the case of strong disproportion between the A and B morphs. The duplicated BLG in sheep might then be tandemly duplicated pair of the same BLG either A or B, resulting in a 1:1 ratio—the same as for alleles—which may be the reason why the BLG has always thought as singleton. Then, the findings related to the quantitative polymorphism almost overlapping the pattern of expression of the a-globin triplicated haplotypes open new vistas on the BLG genetic system. Particularly, we infer that the HY triplicate haplotype do exist, but it is spread in different unrelated populations too.
The results presented in this work and related inferences surf on the wave of recent genomic sequence data that provide a substantial evidence for the abundance of duplicated genes in all organisms examined. Duplication events produce additional copies of genomic information, perhaps including one or more genes. Gene duplication generates functional redundancy. The presence of duplicate genes may also confer a selective advantage simply because extra amounts of protein or RNA products are provided [44]. This applies primarily to strongly expressed genes, which encode high demand products [44], so that BLG may be considered one of them. An analysis of mammalian gene sequences suggested that gene duplication is as important as redundant metabolic networks [45]. Hypothesis explaining how two paralogous genes maintain the same function after duplication generally reflect a history of concerted evolution, mediated by gene conversion and/or unequal crossing over [46-48]. However, the population genetic analysis by Hurst and Smith [49] also suggested that the conditions for gene conversion to be favored selectively are relatively restrictive. In line with these conclusions, Nei and co-workers [50,51], reexamining several large gene families that were previously thought to be under concerted evolution, suggested that purifying selection is much more important than is gene conversion in maintaining common functions of these duplicated genes. To date most mammals have been shown to possess a tandemly duplicated pair of adult aglobin genes that have identical coding sequences and therefore encode identical polypeptides [52,53].
In conclusion, while not underestimating the key importance of molecular genetic approach in detecting and confirming the CNV—whose methods have been recently reviewed by [54]—the phenotypic characterization by advanced proteomic techniques confirm itself a valuable complementary or alternative approach to infer information about the copy number polymorphisms.
![]()
![]()
REFERENCES
- Bawden, W.S., Passey, R.J. and Mackinlay, G. (1994) The genes encoding the major milk-specific proteins and their use in transgenic studies and protein engineering. Biotechnology & Genetic Engineering Review, 12, 89- 137.
- Ferranti, P., Mamone, G., Picariello, G. and Addeo, F. (2011) The “dark side” of β-lactoglobulin: Unedited structural features suggest unexpected functions. Journal of Chromatography A, 1218, 3423-3431. doi:10.1016/j.chroma.2011.03.059
- Kontopidis, G., Holt, C. and Sawyer, L. (2004) Invited review: β-lactoglobulin: Binding properties, structure, and function. Journal of Dairy Science, 87, 785-796. doi:10.3168/jds.S0022-0302(04)73222-1
- Liberatori, J. (1977). β-lactoglobulin: Chemical and structural studies. Folia Veterinaria Latina, 7, 205-222.
- Bell, K. and Mckenzie, H.A. (1967) The whey proteins of ovine milk: β-lactoglobulins A and B. Biochimica et Biophysica Acta, 147, 123-134. doi:10.1016/0005-2795(67)90095-5
- King, J.B.W. (1969) The distribution of sheep beta lactoglobulin. Animal Production, 11, 53-57. doi:10.1017/S0003356100026611
- Erhardt, G. (1989) Evidence for a third allele at the β- lactoglobulin (β-Lg) locus of sheep milk and its occurrence in different breeds. Animal Genetics, 20, 197-204. doi:10.1111/j.1365-2052.1989.tb00857.x
- Gaye, P., Hue-Delahaie, D., Mercier, J.C., Soulier, S., Vilotte, J.L. and Furet, J.P. (1986) Ovine beta-lactoglobulin messenger RNA: Nucleotide sequence and mRNA levels during functional differentiation of the mammary gland. Biochimie, 68, 1097-1107. doi:10.1016/S0300-9084(86)80184-5
- Erhardt, G., Godovac-Zimmermann, J. and Conti, A. (1989) Isolation and complete primary sequence of a new ovine wild-type b-lactoglobulin C. Biological Chemistry Hoppe-Seyler, 370, 757-762. doi:10.1515/bchm3.1989.370.2.757
- Amigo, L., Recio, I. and Ramos, M. (2000) Genetic polymorphism of ovine milk proteins: Its influence on technological properties of milk-a review. Dairy Journal, 10, 135-149. doi:10.1016/S0958-6946(00)00034-0
- Ehrmann, S., Bartenschlager, H. and Geldermann, H. (1997) Polymorphism in the 5’-flanking region of the bovine β-lactoglobulin-encoding gene and its association with β-lactoglobulin in the milk. Journal of Animal Breeding and Genetics, 114, 49-53. doi:10.1111/j.1439-0388.1997.tb00491.x
- Kaminski, S. and Zabolewicz, T. (2000) Associations between bovine beta-lactoglobulin polymorphism within coding and regulatory sequences and milk performance traits. Journal of Applied Genetics, 41, 91-99.
- Dove, P. (2002) Genetic polymorphisms in milk protein genes and their impact on milk composition. Advances in Experimental Medicine and Biology, 480, 225-230. doi:10.1007/0-306-46832-8_28
- Lemay, D.G., Lynn, D.J., Martin, W.F., et al. (2009) The bovine lactation genome: Insights into the evolution of mammalian milk. Genome Biology, 10, R43. doi:10.1186/gb-2009-10-4-r43
- Rullo, R., Di Luccia, A., Chianese, L. and Pieragostini, E. (2010) Hot topic: Gene duplication at the α-lactalbumin locus: Finding the evidence in water buffalo (Bubalus bubalus L.). Journal of Dairy Science, 93, 2161-2167. doi:10.3168/jds.2009-2627
- Rullo, R., Di Luccia, A., Alloggio, I. and Pieragostini, E. (2010a) Duplicazione al locus dell’alfa lattoalbumina nei ruminanti: Evidenze negli ovini. Proceedings of National Congresso of the Italian Society of Sheep and Goat Pathology and Production (SIPAOC), Pesaro, 22-25 September 2010.
- Rullo, R., Di Luccia, A. and Pieragostini, E. (2010) Evidence of gene duplication at the alpha-lactalbumin locus in cattle (Bos bovis, L.). Proceedings of the 26th World Buiatrics Congress, Santiago, 14-18 November 2010.
- Liu G.E., Hou, Y., Zhu, B., et al. (2010) Analysis of copy number variations among diverse cattle breeds. Genome Research, 20, 693-703. doi:10.1101/gr.105403.110
- Passey, R.J. and Mackinlay, A.G. (1995) Characterisation of a second, apparently inactive, copy of the bovine betalactoglobulin gene. European Journal of Biochemistry, 233, 736-743. doi:10.1111/j.1432-1033.1995.736_3.x
- Ohno, S. (1984) Birth of a unique enzyme from an alternative reading frame of the pre-existed, internally repetitious coding sequence, Proceedings of the National Academy of Sciences USA, 81, 2421-2425. doi:10.1073/pnas.81.8.2421
- Folch, J.M., Colla, A., Hayesb, H.C. and Sànchez, A. (1996) Characterization of a caprine β-Lactoglobulin pseudogene, identification and chromosomal localization by in situ hybridization in goat, sheep and cow. Gene, 177, 87-91. doi:10.1016/0378-1119(96)00276-4
- Hatje, K. and Kollmar, M. (2011) Predicting tandemly arrayed gene duplicates with WebScipio. In: Friedberg, F. Ed., Gene Duplication, InTech, Rijeka, 59-76. doi:10.5772/24240
- Aloni, R., Olender, T. and Lancet, D. (2006) Ancient genomic architecture for mammalian olfactory receptor clusters. Genome Biology, 7, R88. doi:10.1186/gb-2006-7-10-r88
- Garcia-Fernandez, J. (2005) The genesis and evolution of homeobox gene clusters. Nature reviews. Genetics, 6, 881-892. doi:10.1038/nrg1723
- Zhang, J. and Nei, M. (1996) Evolution of Antennapediaclass homeobox genes. Genetics, 142, 295-303.
- Proudfoot, N.J. (1986) Transcriptional interference and termination between duplicated alpha-globin gene constructs suggests a novel mechanism for gene regulation. Nature, 322, 562-565. doi:10.1038/322562a0
- Vestri, R., Pieragostini, E., Yang, F., Di Gregorio, P., Rando, A. and Masina, P. (1991) Expression of triplicated and quadruplicated alpha globin genes in sheep. British Journal of Haematology, 77, 110-116. doi:10.1111/j.1365-2141.1991.tb07956.x
- Aschaffenburg, R. and Drewry, J. (1959) New procedure for the routine determination of the various non-casein proteins of milk. Proceedings of the 15th International Dairy Congress, London, 29 June-3 July 1959, 1631- 1637.
- Raymond, M. and Rousset, F. (1995) GENEPOP (v 1.2): A population genetics software for exact tests and ecumenicism. Journal of Heredity, 86, 248-249.
- Broad, T.E., Dolling, C.H.S., Lauvergne, J.J. and Millar, P. (1999) Revised COGNOSAG guidelines for gene nomenclature in ruminants. Genetic Selection Evolution, 31, 263-268. doi:10.1186/1297-9686-31-3-263
- Vestri, R., Pieragostini, E. and Ristaldi, M.S. (1994) Expression gradient in sheep alpha alpha and alpha alpha alpha globin gene haplotypes: mRNA levels. Blood, 83, 2317-2322.
- Pieragostini, E., Petazzi, F. and Di Luccia, A. (2003) The relationship between the presence of extra alpha-globin genes and blood cell traits in Altamurana sheep. Genetic Selection Evolution, 35, S121-S133. doi:10.1186/1297-9686-35-S1-S121
- Lum L.S., Dovc, P. and Medrano, J.F. (1997) Polymorphisms of bovine beta-lactoglobulin promoter and differences in the binding affinity of activator protein-2 transcription factor. Journal of Dairy Science, 80, 1389-1397. doi:10.3168/jds.S0022-0302(97)76068-5
- Braunschweig M.H. and Leeb, T. (2006) Aberrant low expression level of bovine beta-lactoglobulin is associated with a C to A transversion in the BLG promoter region. Journal of Dairy Science, 89, 4414-4419. doi:10.3168/jds.S0022-0302(06)72488-2
- Karim, S.A., Barrie, J.A., McCulloch, M.C., et al. (2007) PLP overexpression perturbs myelin protein composition and myelination in a mouse model of Pelizaeus-Merzbacher disease. Glia, 55, 341-351. doi:10.1002/glia.20465
- Regis, S., Grossi, S., Corsolini, F., Biancheri R. and Filocamo, M. (2009) PLP1 gene duplication causes overexpression and alteration of the PLP/DM20 splicing balance in fibroblasts from Pelizaeus-Merzbacher disease patients. Biochimica et Biophysica Acta, 1792, 548-554. doi:10.1016/j.bbadis.2009.04.002
- Pieragostini, E., Alloggio, I. and Petazzi, F. (2010) Insights into hemoglobin polymorphism and related functional effects on hematological pattern in mediterranean cattle, goat and sheep. Diversity, 2, 679-700. doi:10.3390/d2040679
- Cubric-CuriK V., Feligini, M., Lukac-Havranek, J., Curik, I. and Enne, G. (2002) Genetic polymorphism of β-lactoglobulin in native sheep from the island of Pag. Food Technology and Biotechnology, 40, 75-78.
- Giaccone, P., Di Stasio, L., Fiandra, P. and Finocchiaro, R. (1997) Effetto della β-lattoglobulina sulla produzione quanti-qualitativa del latte. Proceedings of the XII the National Congress of Scientific Association of Animal Production (ASPA), Pisa, 23-26 June 1997, 271-272.
- Chiofalo, L., Micari, P. and Girmenia, A.M. (1986) Polimorfismo genetico del locus β-lattoglobulina nella razza ovina Comisana allevate in Sicilia. Zootecnica e Nutrizione Animale, 12, 73-80.
- Iorio M., Vincenti, D., Annunziata, M., Rullo, R., Bonamassa, M., Di Luccia, A. and Pieragostini, E. (2004) Biochemical and molecular investigations on qualitative and quantitative Hb polymorphism in the river buffalo (Bubalus bubalis L.) population reared in Southern Italy. Genetics and Molecular Biology, 27, 167-173. doi:10.1590/S1415-47572004000200007
- Scaloni, A., Pieragostini, E., Malorni, A., Ferrara, L. and Di Luccia, A. (1998) Bovine hemoglobin alpha-globin chain polymorphism: Primary structure determination of two new genetic variants by mass spectrometry and amino acid sequencing. Biochimie, 80, 333-338. doi:10.1016/S0300-9084(98)80076-X
- Pieragostini, E., Di Luccia, A., Rullo, R. and Bottiglieri, C. (2002) Hemoglobin phenotypes in Murgese horse. Italian Journal of Animal Science, 1, 159-163.
- Sugino R. and Innan H. (2006) Selection for more of the same product as a force to enhance concerted evolution of duplicated genes. Trends in Genetics, 22, 642-644. doi:10.1016/j.tig.2006.09.014
- Zhang, J. (2003) Evolution by gene duplication: An update. Trends in Ecology and Evolution, 18, 292-298. doi:10.1016/S0169-5347(03)00033-8
- Zimmer, E.A., Martin, S.L., Beverley, S.M., Kan, Y.W. and Wilson, A.C. (1980) Rapid duplication and loss of genes coding for the α-chains of hemoglobin. Proceedings of the National Academy of Sciences USA, 77, 2158- 2162. doi:10.1073/pnas.77.4.2158
- Lam, K.-W. L. and Jeffreys, A. (2006) Processes of copynumber change in human DNA: The dynamics of α-globin gene deletion. Proceedings of the National Academy of Sciences USA, 103, 8921-8927.
- Hoffmann, F.G., Opazo J.C. and Storz, J.F. (2008) Rapid rates of lineage-specific gene duplication and deletion in the α-globin gene family. Molecular Biology and Evolution, 25, 591-602. doi:10.1093/molbev/msn004
- Hurst, L.D. and Smith, N.G.C. (1998) The evolution of concerted evolution. Proceedings of the Royal Society B: Biological Sciences, 265, 121-127. doi:10.1098/rspb.1998.0272
- Nei, M., Rogozin, I.B. and Piontkivska, H. (2000) Purifying selection and birth-and-death evolution in the ubiquitin gene family. Proceedings of the National Academy of Sciences USA, 97, 10866-10871. doi:10.1073/pnas.97.20.10866
- Piontkivska, H., Rooney, A.P. and Nei, M. (2002) Purifying selection and birth-and-death evolution in the histone H4 gene family. Molecular Biology and Evolution, 19, 689-697. doi:10.1093/oxfordjournals.molbev.a004127
- Higgs D.R., Vickers M.A., Wilkie A.O., Pretorius, I.M., Jarman, A.P. and Weatherall, D.J. (1989) A review of the molecular genetics of the human alpha-globin gene cluster. Blood, 73, 1081-1104.
- Hardison, R.C. (2008) Globin genes on the move. Journal of Biology, 7, 35. doi:10.1186/jbiol92
- Schrider, D.R. and Hahn, M.W. (2010) Gene copy-number polymorphism in nature. Proceedings of the Royal Society B: Biological Sciences, 277, 3213-3221. doi:10.1098/rspb.2010.1180
NOTES
*Corresponding author.