Open Journal of Inorganic Chemistry
Vol.2 No.1(2012), Article ID:16973,5 pages DOI:10.4236/ojic.2012.21001
Synthesis of NaA zeolite using PTMAOH (phenyltrimethylammoniumhydroxide): Hydrothermal and microwave heating methods and comparison of their XRD patterns
![]()
Analytical Division, Faculty of Chemistry, University of Mazandaran, Babolsar, Iran
Email: *azizi@umz.ac.ir
Received 21 September 2011; revised 10 October 2011; accepted 15 October 2011
Keywords: Zeolite NaA; PTMAOH; Microwave Heating; Hydrothermal
ABSTRACT
Ion exchanging is one of the characteristics of the zeolites. Zeolites have octahedral and tetrahedral holes to trap ions and molecules. They also can exchange many ions in solution because of the size of the attendant ions. As a matter of fact, the property of the ion-exchanged zeolites depends on the ligands involved in the ion exchanging solutions. Ion exchanged zeolites are used as catalyst for studying the anodic oxidation of methanol in an acidic medium to investigate their suitability for use in direct methanol fuel cells (DMFCs). Some of the zeolites that have exchanged ions are shown to have redox and catalytic properties [1-3]. As an example A. Itadani et al., have reported the preparation of copper ion exchanged ZSM-5 for calorimetric study of N2 adsorption on Cu-ZSM-5 zeolite [4]. In another study, A. Ribera et al. have reported the characterization of redox properties and application of Fe-ZSM-5 catalysts [5]. In this research we prepared silicate solutions by dissolving silica in sodium hydroxide. Aluminosilicate solutions with different Al/Si ratios were prepared by mixing appropriate quantities of sodium silicate solutions with freshly prepared sodium aluminate solutions and the NaA zeolites were made by hydrothermal method. Then, their XRD patterns and IR spectra were also considered. Obviously, those zeolites which have Al-OH and Si-OH groups can lose their protons in basic solutions. In this way zeolites can adsorb many ions with positive charge. We investigated ion exchange property of Fe3+, Cu2+, Ni2+ and Hg2+ in systems with pH equals to 2, 4, 6 and 8. We found that the aluminosilicate with Si/Al = 1, has greatest exchange capacity for all of the ions studied in this work.
1. INTRODUCTION
Wastewater contaminated with heavy metals is produced in many industrial activities, such as tanneries, metalplating facilities, and mining operations [6]. Hg2+, Cu2+, Fe3+, and Ni2+ are among the most common metals found in many industrial wastewater. These heavy metals which are not biodegradable and tend to accumulate in organisms cause numerous diseases and disorders.
The understanding of the nature of micro porous solid acid catalysts, which have many important applications in commercial processes, is of great interest. Two of the most commonly studied types of materials in this category are zeolites (aluminosilicates) and silicoaluminophosphates (SAPOs). Such negatively charged defect sites can be counterbalanced by the presence of a proton leading to the formation of Bronsted-acid sites which are believed to be the active sites for catalysis [7].
Zeolites are micro porous crystalline aluminosilicates with frameworks made of SiO4 and AlO4 tetrahedral (these tetrahedral atoms are often referred to as T atoms). Insertion of trivalent Al3+ in place of tetrahedral coordinated Si4+ creates negative charge on the lattice, which is compensated by extra framework cations. If the charge compensating cation is H+ a bridged hydroxyl group (Si-O(H)-Al) is formed which functions as a strong Bronsted-acid site. Due to these acid sites, zeolites are solid acids and are used as catalysts. The catalytic activity of zeolites is often related to strength of the acid sites, which depends on chemical composition and topology of zeolite frameworks [8]. The formation of many different zeolites is shown in Figure 1.
The crystallization process usually proceeds via the solution phase. Therefore, the composition and the structure of the silicate and silicoaluminate species in the so-
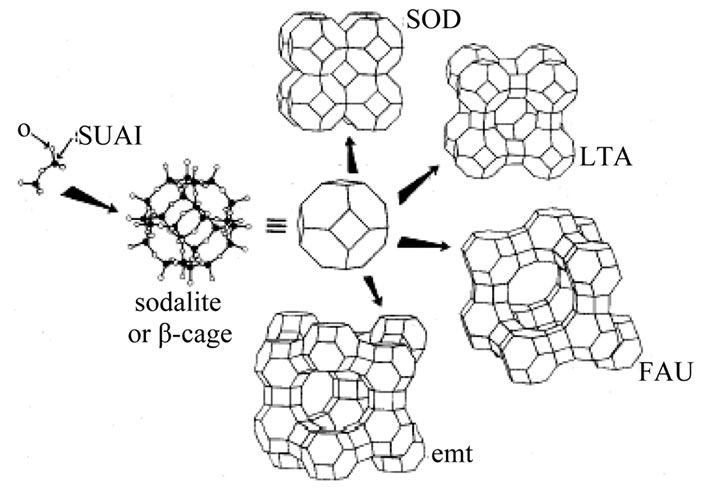
Figure 1. Building up zeolite structures.
lution phase are of importance in the crystallization process. In many experiments, the Si/Al ratio and the rate constant of the growth were studied based on the composition of the solution phases. The Si/Al ratio as an important parameter in application of zeolites is responsible for their thermal and hydrothermal stability as well as acidity. For the planning of a synthesis procedure for a special zeolite, exact information on the possibilities of adjustment of the Si/Al ratio using the experimental conditions is, therefore, of vital importance. Among the Various available treatment processes, ion exchange is considered to be more cost effective if low cost ion exchangers such as zeolites are used [6].
The selectivity of the exchanger for the higher valence ions increases with increasing dilution. The SiO4 and AlO4 are shown in Figure 2.
The present study is an attempt to investigate the selectivity series of Pb2+, Fe3+, Cu2+ and Ni2+ using single solutions, for three sample of zeolites with different Si/Al ratios.
2. EXPERIMENTAL
2.1. Materials
Sodium hydroxide; Aluminum foil and NiCl2·6H2O were purchased from Merck; SiO2 was synthesized in our laboratory; silicon tetrachloride (99.8%) was purchased from Janssen chemical Co; ferric chlorid, CuSO4·5H2O and Hg(OAc)2 were obtained from Fluka; and water was purified using a homemade instrument.
2.2. Preparation of Pure SiO2
Pure silica was produced by hydrolysis of silicon tetrachloride using doubly distilled water. The precipitate was filtered and washed many times with doubly distilled water to remove the whole acid. It was then dried at 105˚C for 48 h. The chemical reaction is quite simple:

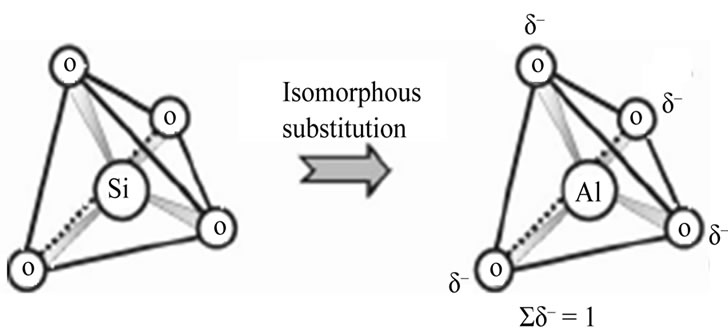
Figure 2. Figure of silicate and aluminate groups.
2.3. Making Silicate Solution
Aqueous silicate solution was prepared in plastic bottle by dissolving 1.5 gr. SiO2 in sodium hydroxide solution 2 M. The dissolution of the silica was very slow at room temperature, therefore the sample was heated in an oven at 70˚C to help the dissolution process.
2.4. Making Aluminosilicate Solutions
Aqueous sodium aluminate solution was prepared by dissolving of 2 gr. aluminum foil in NaOH solution (5 M). Aluminosilicate solutions were then obtained by mixing the freshly prepared sodium aluminate and sodium silicate solution with the following initial ratios:
Sample No. 1, SiO2:Al2O3:4Na2O:2PTMAOH:100H2O
Sample No. 2, 2SiO2:Al2O3:4Na2O:2PTMAOH:100H2O
Sample No. 3, 4SiO2:Al2O3:4Na2O:2PTMAOH:100H2O
2.5. Synthesis of Zeolite
The above mixtures were placed in hydrothermal vessel and then placed in an oven at 90˚C for 42 hours. The precipitate was filtered and washed with doubly distilled water and then dried at 105˚C for 48 h.
3. RESULTS AND DISCUSSION
3.1. XRD Pattern
In zeolite systems, perturbations in the framework structure, crystal morphology, extra framework material, phase purity, crystallite size, and the setting and occupation of cation sites can produce differences in the X-ray diffraction patterns. The first requirement is having a good and clean crystalline material that yields very high-resolution patterns. This results in a considerable improvement of the X-ray diffraction pattern, intensity and resolution. It also increases the ability to characterize the zeolite.
The characteristic of XRD patterns for the prepared zeolites are presented in Figure 3 for three samples. The X-ray diffraction analysis indicated that all of the zeolites have crystalline structure.
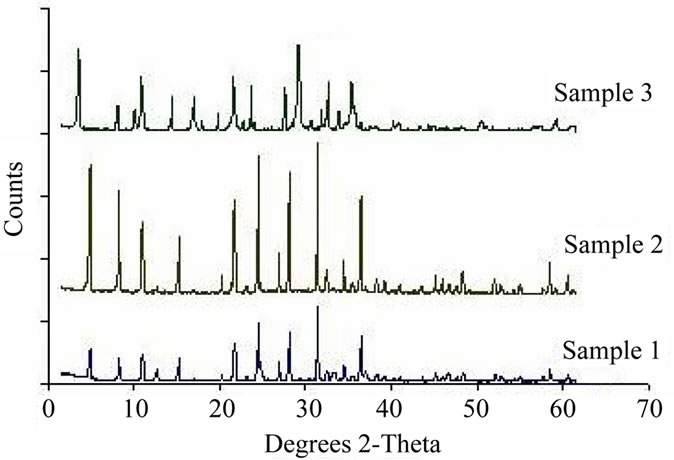
Figure 3. The XRD patterns of the obtained samples.
3.2. IR Spectra
Complementary information concerning the structure of the prepared zeolites was obtained through further research using IR spectroscopy. The bands occurring in the spectra of zeolites can be divided into two groups: bands connected with the internal vibrations of either SiO4 and AlO4 tetrahedra or Si-O-Si and Si-O-Al bridges, depending on the model used. Bands arising from the external vibrations of tetrahedra form the SBU and fragments of aluminosilicate framework. Each of the zeolites exhibits a typical IR pattern, which can be observed in Figure 4.
The results obtained from IR spectroscopy which present the characteristic spectral frequencies of zeolites are in agreement with other data reported in the literature [9].
The band at ca. 635 cm–1 observed in the spectra of the minerals of the D6R group (double six-membered rings) can be due to the presence of six-membered rings in the
three-dimensional zeolites structure (Figure 2).
According to the literature, the increase of the number of ring members leads to the shift of the characteristic ring band to the higher wave numbers [10]. Thus, one can expect the presence of the 4-membered ring band in the region of 700 - 740 cm–1. According to the previous paper [11], the two bands related to the Si-O-Si and Al-O-Si bridges can be expected in the region of 690 - 800 cm–1. At the same time, the position of the most intensive band in the region of 950 - 1200 cm–1 arising from the Si(Al)-O stretching vibrations depends on the Al:Si ratio in zeolites. It shifts to the lower wave numbers with the increase of Al contents [12]. The comparison of the intensity of pseudo lattice bands in the region of 550 - 650 cm–1 with the intensity of internal bending bands in the region of 410 - 470 cm–1 can be used to determine the degree of amorphization in zeolites [13]. The bands occurring in the first region are connected to the inter tetrahedral bonds typical for the ordered crystal structure, while the intensity of the band at about 410 - 470 cm–1 does not depend on the degree of crystallization.
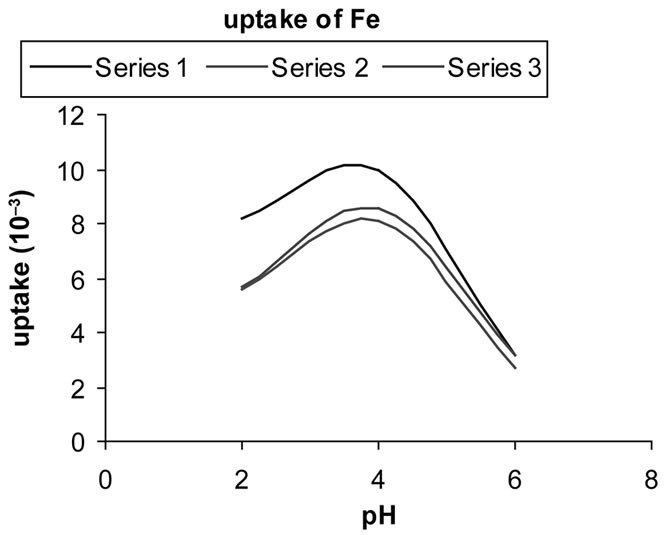
3.3. Selectivity Determination
Uptake of metals (q) is calculated with the equation:
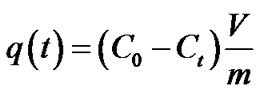
where C0 and Ct are the initial and final metal concentration in solution (in mol·l–1) after time t , V is solution volume (in l), and m is zeolite mass (in g). Figures 5(a)-(d) show metal uptake for three samples of synthesized zeolites.
The above charts show the decrease of the concentra-
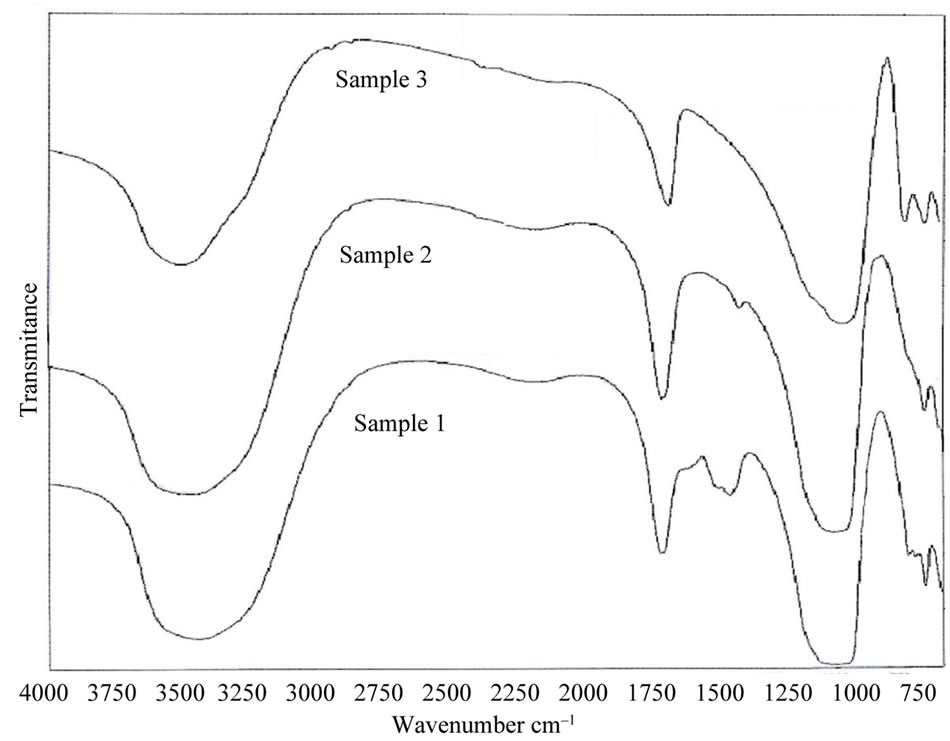
Figure 4. The IR spectra of obtained zeolites.
 (a)
(a)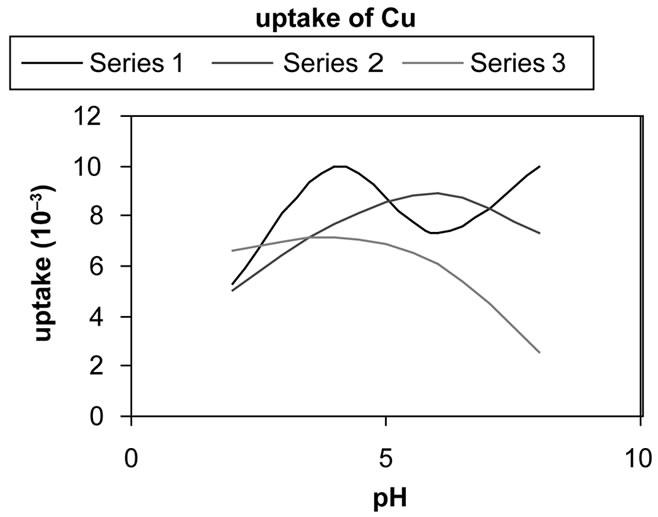 (b)
(b) (c)
(c) (d)
(d)
Figure 5. The uptake of metal ions in the different pH = 2 - 8 for three synthesized zeolite. In these charts series 1, 2 and 3 refer to samples 3, 2 and 1 respectively.
tion of metal ions.
4. CONCLUSIONS
The results indicate that sample 2 has higher exchange capacity than the other ones. It is mainly due to its higher Al substitution of Si that provides a negative framework favorable to superior ion exchange capability. It Also indicates that exchange capacity of samples 1 and 2 are approximately similar.
5. ACKNOWLEDGEMENTS
This project was carried out at the analytical laboratory in University of Mazandaran. Authors acknowledge Dr. Haghighi and Mr. Feyzi for their cooperation in preparing IR spectra.
REFERENCES
- Samant, P.V. And Fernandes, J.B. (2004) Enhanced activity of Pt(HY) and Pt-Ru(HY) zeolite catalysts for electrooxidation of methanol in fuel cells. Power Source, 125, 172-177. doi:10.1016/j.jpowsour.2003.07.013
- Hadjiivanov, K., Ivanova, E. and Dimitrov, L. (2003) FTIR spectroscopic study of CO adsorption on RhZSM-5: Detection of Rh+-CO species. Molecular Structure, 459, 661-662.
- Yamashita, H. and Takada S. (2003) Experimental study and ab initio molecular orbital calculation on the photolysis of n-butyrophenone included within the alkali metal cation-exchanged ZSM-5 zeolite. Journal of Photochemistry and Photobiology A: Chemistry, 160, 37-42. doi:10.1016/S1010-6030(03)00218-1
- Itadani, A., Kumashiro, R., Kuroda, Y. and Nagao M. (2004) Calorimetric study of N2 adsorption on copper-ion-exchanged ZSM-5 zeolite. Thermochimica Acta, 416, 99-104. doi:10.1016/j.tca.2002.12.001
- Ribera A., Arends, I.W.C.E., de Vries, S., Pérez-Ramirez, J. and Sheldon, R.A. (2000) Preparation, characterization, and performance of FeZSM-5 for the selective oxidation of benzene to phenol with N2O. Journal of Catalysis, 195, 287-297. doi:10.1006/jcat.2000.2994
- Inglezakis, V.J., Loizidou M.D. and Grigoropoulou, H.P. (2003) Ion exchange of Pb2+, Cu2+, Fe3+ and Cr3+ on natural clinoptilolite: Selectivity determination and influence of acidity on metal uptake. Journal of Colloid and Interface Science, 261, 49-54. doi:10.1016/S0021-9797(02)00244-8
- Shah, R., Gale, J.D. and Paynea, M.C. (1997) Comparing the acidities of zeolites and SAPOs from first principles. Chemical Communications, 1, 131-132. doi:10.1039/a605200b
- Bekkum H., Flanigen, E.M. and Jansen, J.C. (1991) Introduction to zeolite science and practice. Elsevier, Amsterdam.
- Azizi, S.N. and Yousefpour, M. (2010) Synthesis of zeolites NaA and analcime using rice husk ash as silica source without using organic template. Journal of Materials Science, 45, 5692-5697. doi:10.1007/s10853-010-4637-7
- Sitarz, M., Mozgawa, W. and Handke, M. (1997) Synthesis of zeolites NaA and analcime using rice husk ash as silica source without using organic template. Journal of Molecular Structure, 404, 193-197. doi:10.1016/S0022-2860(96)09381-7
- Handke, M. and Mozgawa, W. (1993) Vibrational spectroscopy of the amorphous silicates. Vibrational Spectroscopy, 5, 75-84. doi:10.1016/0924-2031(93)87057-Z
- Mozgawa, W., Sitarz, M. and Rokita, M. (1999) Spectroscopic studies of different aluminosilicate structures. Journal of Molecular Structure, 251, 511-512.
- Ciciszwili, G.W., Andronikaszwili, T.G., Kirov, G.N. and Filizowa, L.D. (1990) Zeolity Naturalne. WNT, Warszawa.
NOTES
*Corresponding author.