Advances in Entomology
Vol.07 No.03(2019), Article ID:93005,24 pages
10.4236/ae.2019.73005
The Potential Role of Environment in Structuring the Microbiota of Camponotus across Parts of the Body
Manuela Oliveira Ramalho1,2,3*, Corrie Saux Moreau2,3, Odair Correa Bueno1
1Departamento de Biologia e Centro de Estudos de Insetos Sociais, Instituto de Biociências, Campus Rio Claro, Universidade Estadual Paulista “Júlio de Mesquita Filho” (UNESP), Rio Claro, Brasil
2Department of Science and Education, Integrative Research Center, Field Museum of Natural History, Chicago, IL, USA
3Department of Entomology, Cornell University, Ithaca, NY, USA

Copyright © 2019 by author(s) and Scientific Research Publishing Inc.
This work is licensed under the Creative Commons Attribution International License (CC BY 4.0).
http://creativecommons.org/licenses/by/4.0/


Received: April 29, 2019; Accepted: June 11, 2019; Published: June 14, 2019
ABSTRACT
Several studies have attempted to understand what may influence the bacterial community of a host, but studies examining whether different bacterial species are found in different parts of the body of insects are limited. In the present study, we address the following questions: 1) How are bacterial communities distributed across different parts of the body (head, mesosoma, gaster) of Camponotus and 2) Is the diversity found explained by the environment in which these ants were collected? Our results were able to differentiate the bacterial communities present in the different parts of the body and can be explained in the following way: each part of the body has unique organs with different functions; and the complex proventriculum of Camponotus may be acting as a filter and structuring the bacterial community found in the gaster. In addition, an unexpected finding of the present study was the high diversity found associated with the head and mesosoma, and our findings were able to confirm that this diversity is associated with the environment where the ants were collected. Knowing more about the factors that can influence bacterial communities may reveal more about the importance of these associations in nature.
Keywords:
Camponotini, Blochmannia, Wolbachia, Sodalis

1. Introduction
Symbiotic microbes can influence the host and provide direct benefits through nutrition, defense, or even environmental tolerance [1] - [6] . Little is known about the factors that may affect or drive bacterial community membership [7] [8] [9] , although several studies have attempted to tease this apart including its relation to the geography and phylogeny of the host [7] [9] [10] [11] . In addition, few studies have investigated the bacterial community within a colony comparing different stages of development (ontogeny) [11] [12] [13] and examined whether different bacterial species are found in different parts of the body of insects [14] [15] .
There are several ways of acquiring microbes, and clearly the path of acquisition is a determining factor in the structure and composition of the bacterial community, and consequently, can influence host biology. These include: 1) environmental acquisition, 2) social transmission, or 3) specialized maternal transmission [16] . Acquiring microbes from the environment, also called horizontal transfer or secondary interaction, is usually facultative. These bacteria have part or all of their life cycle outside the host and can be transient in the host compared to those vertically transmitted by the mother [17] . Socially transmitted microbiota may represent the transition between free living and inherited bacteria, a factor that may be common among social insects such as ants. Specialized associations often characterize this third primary interaction where the phylogenetic trees of the symbionts are often congruent with their hosts across long periods in evolutionary time. This suggests high levels of host fidelity. Lastly for microbes that have specialized maternal transmission, the symbiont may become localized in a specialized organ inside the host [18] [19] .
With a worldwide distribution, and commonly known as carpenter ants, Camponotus Mayr, 1861 is a well known genus for having symbiotic bacteria localized in specialized organs as bacteriocytes, found between the epithelial cells of the midgut and also in the ovary of the queens, which guarantees maternal (vertical) transmission of the endosymbiont [20] [21] [22] [23] . It is considered a hyper-diverse genus and has generalized feeding and nesting habits. Their diet is derived from the exudate of plants and phytophagous insects and can include scavenged prey [24] [25] [26] . Another striking feature is the absence of the metapleural gland in the vast majority of species of Camponotus. Antimicrobials, chemical defense, odor recognition and territorial marking are some of the possible functions of this gland [27] .
Recently Brown and Wernergreen [16] evaluated the gut microbiota of Camponotus chromaiodes Bolton, 1995, and they found that 95% - 98% of the reads were dominated by the bacteria Blochmannia and Wolbachia. Even within Camponotus textor Forel 1899, a Neotropical species, these bacteria are predominant [23] . Another study involving colonies of Camponotus planatus Roger, 1863 and Camponotus floridanus (Buckley, 1866) also reported high prevalence of these bacteria in addition to other less-abundant bacterial taxa, but observed variation across the different stages of development [11] . These studies corroborate that these bacteria are highly associated with Camponotus, but these studies have included entire workers or only the digestive tract.
The present study intends to characterize the microbiota of different Camponotus species and to answer the following questions: 1) How are bacterial communities distributed across different parts of the body (head, mesosoma and gaster)? 2) Is the diversity found explained by the environment in which these ants were collected, suggesting these microbes are being picked up in the environment? Addressing these questions will advance our knowledge of the natural variation of insect-associated microbiota and may reveal important aspects of host biology that contribute to these associations.
2. Results
1) Bacterial communities distributed across different parts of the body
A total of 163 samples were successfully sequenced (54 heads, 56 mesosoma and 53 gasters) resulting in 107,112 reads and 2686 OTUs. From the heads we obtained 28,871 reads and 1881 OTUs. In the mesosoma we obtained 26,283 reads and 1616 OTUs. The gaster as expected was the most abundant in quantity with 51,958 reads and 381 OTUs. A summary of relative abundance of OTUs recovered across samples can be found in Figure 1.
Across the different sampled body parts, there was a clear differentiation of the bacterial communities with the gaster, despite having the largest abundance of reads has fewer OTUs in comparison to the head and mesosoma samples. For this study, we expected that the head and mesosoma had a greater diversity than the gaster, based on the findings of Lanan et al. [14] , analyzing Cephalotes. But what we did not expect is that this diversity was four times higher in the head and mesosoma. As expected for the gaster most of the bacteria were from Blochmannia, followed by Wolbachia [16] , being 84.10% from Blochmannia, and 7.10% from Wolbachia of the relative abundance. In the gaster we also found Enterobacteriaceae (2%), Sodalis (1.7%), Lactobacillus (1.0%). For the head we obtained Wolbachia (25%), Candidatus Blochmannia (5.4%), Sodalis (5.1%), Lactobacillus (4.5%), Enterobacteriaceae (4%), Acinetobacter (2.5%), Nocardia (1.9%), Acetobacteraceae (1.8%), followed by others in smaller abundance. For the mesosoma we obtained Wolbachia (32%), Candidatus Blochmannia (6.7%), Sodalis (4.3%), Enterobacteriaceae (3.9%), Streptococcus (3.4%), Corynebacterium (1.9%), Acetobacteraceae (1.8%), Nocardia (1.5%), Acinetobacter (1.5%), followed by others in smaller abundance. Taxa that accounted less than 0.8% in a sample are summarized in a category termed “Other.” (Figure 1).
The diversity found in the gaster of Camponotus is not high compare to Cephalotes [14] [15] and rarefaction curves confirm that our sequencing was sufficient to recover most of the diversity of the bacterial community associated with this genus. However, despite sequencing thousands of reads, the rarefaction curves (measure observed OTUs and Shannon) of several samples did not reach a plateau (Additional File 3), while this is not likely problematic for the gaster-associated communities, the head and mesosoma appeared much more variable and this could be due to undersampling. The PCoA was calculated with the

Figure 1. Summary graph of bacterial OTUs found in Camponotus samples with 16S rRNA amplicon sequencing. A. Bacterial communities from head, mesosoma and gaster samples. Bar graphs for each library show the percentage of sequence reads classified to selected 97% OTUs. Each color represents a distinct bacterium. B. Summary of all OTUs found in this study in each part of the body analyzed with legend ordered in proportion of reads found across all 131 samples. Taxa that accounted less than 0.8% in a sample are summarized in a category termed “Other”.
weighted distance values of the beta diversity and suggest heads and mesosoma samples almost completely overlap and there is separation from the gaster samples (Figure 2(A)). This can also be observed by the NMDS analysis (Figure 2(B)).
Our statistical analyses support our findings that the bacterial communities differ across different parts of the ant’s body (Adonis, unweight R2 = 0.16769 and P = 0.001, weight R2 = 0.3619 and P = 0.001; Anosim, unweight R2 = 0.49622 and P = 0.001, weight R2 = 0.58026 and P = 0.001; RDA, unweight Pseudo F =

Figure 2. Beta diversity of head, mesosoma and gaster samples of Camponotus (depth of 400 reads). (A) PCoA plots (weighted UniFrac method) of bacterial communities grouped according to different sample type with 95% ellipses. Note that there are a clustered of gaster samples, and a mix of head and mesosoma samples. This suggests that different parts of the body play an important role in structuring the bacterial community. (B) Nonmetric multidimensional scaling (NMS) plot illustrating bacterial community structure among different body parts, Bray-Curtis, Axis 1: 0.9524, Axis 2: 0.017 and stress 0.051. The dots were colored according to the sample type (red = head, blue = mesosoma and green = gaster).
9.5275 and P = 0.001, weight Pseudo F = 25.287 and P = 0.001). This corroborates our findings as visualized by sample type (Figure 1), PCoA and NMDS analyses (Figure 2) and the network analysis (Additional File 4), which shows clear separation of the different bacterial communities across of the ant’s body, mainly the head and the mesosoma in comparison with the gaster. What we did not expect, and indeed is the most striking is the highest diversity is found in the head and mesosoma.
No significant changes in the composition of the bacterial community (Sorensen index) were observed across all samples (R = −0.0367 and P = 1). This may be explained because the main bacteria are the same across the different parts of the body, but in varying relative abundance. However, when we analyzed the total bacterial community structure (Bray-Curtis index) we obtained significant results (R = 0.6015 and P = 0.0001), and when analyzing each part of the body of the ant we found that head (R = 0.6609 and P = 0.0001) and mesosoma (R = 0.7363 and P = 0.0001) are different from the gaster.
In each part of the body the most common bacteria are responsible for structuring bacterial communities; this was reinforced by the SIMPER (Additional File 5) analysis. This analysis found that the bacterial communities from the head and the mesosoma are more similar to each other (89.39%), compared to the gaster. For the head and mesosoma Wolbachia (multiple OTUs) and Sodalis represent 42% of the bacterial community, with Blochmannia accounting for less representation in these sampled body regions. For the gaster, several Blochmannia OTUs are present representing more than 40% of the reads (multiple OTUs).
In the heatmap analysis the bacteria responsible for structuring bacterial communities present in each part of the body was investigated (Figure 3). In each part of the body, we grouped the samples according to the quantity and type of associated bacteria. Through this analysis it is possible to visualize the presence of individuals with multiple OTUs of Wolbachia and Blochmannia in each part of the ant’s body.

Figure 3. Heatmap of the different sample types—(A) head, (B) mesosoma and (C) gaster of Camponotus. The colors in the heatmap indicate variation in the relative abundance of different bacteria in different sample types. We choose to show only OTUs with more than 100 reads, for easy viewing. Dendrograms were generated from Bray-Curtis distance matrices.
2) Role of the environment in the diversity found in the head and mesosoma
To test what might be contributing to the high diversity found in the head and mesosoma (together, since according to SIMPER analysis these regions are highly similar), we tested whether these bacteria were being acquired from the local environment in which the ant was collected potentially through horizontal transfer by feeding. Our data confirmed this hypothesis, but only when we did not consider abundance (unweight) (Adonis, unweight R2 = 0.24019 and P = 0.006; RDA, unweight Pseudo F = 1.314 and P = 0.003). As the main bacteria of the mesosoma and head are Wolbachia and less-abundant other bacterial taxa, tests that take into account abundance may not be appropriate, as is the case of weight measurements. Therefore, unweight measures seem to be appropriate to test for significant differences across the different localities. Outside of Wolbachia it is likely that the diversity of the head and the mesosoma comes partly from the acquisition of these potentially transient bacteria from the host’s diet and environment.
3. Discussion
We found that the gasters of ants in the genus Camponotus have very dense bacterial communities, but these were simple communities dominated by Blochmannia and Wolbachia. We did find much higher diversity in the head and mesosoma, but in lower abundance. When we examined the similarity of communities based on host collection location we found that locality did explain similarity of samples suggesting that many of the bacteria, especially for the head and thorax, are likely acquired in the environment or through the food they ingest. In other words, the main route of transmission of bacterial communities from head and mesosoma may be environmental acquisition and social transmission. However we cannot rule out that some of these bacteria still play important functional roles for the host.
In two previous studies Kautz et al. [15] and Lanan et al. [14] examined different parts of the digestive tract of two different species of an herbivorous ant, Cephalotes, and found different bacterial communities across digestive compartments. In addition, Lanan et al. [14] identified a possible anatomical filter— called the proventriculus that hinders the passage of bacteria transferred horizontally, and guarantees the specificity of the vertically transferred bacterial community.
In general, the present study was able to differentiate the bacterial communities present in the different parts of the body of the ant. This is likely explained because each part of the body has different organs with unique functions. Additionally, anatomical filters have been observed for Cephalotes [14] and could also be a factor structuring bacterial communities in other ant species and the proventriculus found in Camponotus (see Additional File 6) has four hair-lined, sclerotized channels [28] , which may also play a role in filtering. The gaster is the part of the body that contains the largest number of bacteria, although with low diversity.
As expected, the main bacteria found in this study were Blochmannia and Wolbachia [11] [16] (with multiples OTUs), and these are acquired via specialized maternal transmission [29] . Besides the bacteria already well-known as associates of Camponotus, our study also recovered Enterobacteriaceae, Sodalis and Lactobacillus in large abundance.
Enterobacteriaceae is the bacterial family that Blochmannia belongs to and has been found in high abundance in recent studies of the bacteria associated with Camponotus, Colobopsis and Polyrhachis [8] [11] . As this bacterium can have a high mutational rate [30] this could explain our inability to assign most “Enterobacteriaceae” to lower taxonomic categories. Therefore, it possible that these Enterobacteriaceae may actually be OTUs of Blochmannia [11] .
Although not documented in high abundance before in Camponotus, we commonly recovered Sodalis, which may act as facultative or obligate endosymbiont in other organisms [31] [32] . It has been found in several insect hosts including tsetse flies [33] , aphids [34] and beetles [35] , but the role of this bacterium in these associations is not yet clear.
Another bacterium that has recently become commonly identified as one of the major bacteria found in ant microbiomes, and also was also evident in our samples is Lactobacillus. This bacteria has been identified in Cephalotes turtle ants [9] [14] [36] , leaf-cutting ants [37] [38] , and also in other Camponotini ants such as Polyrhachis [8] . Its function in these groups is still being discussed, but it is believed that this bacterium could bring benefits to nutrition, or confer defenses against other microorganisms, altering PH with the production of lactic acid [14] [38] .
Although, we acknowledge that the head and mesosoma communities are possibly undersampled after filtering to a depth of 400 reads (leaving only 30 heads and 19 mesosoma) and this may have affected our results. The microbial diversity found in the head and mesosoma of ants may be explained by the horizontal acquisition of microbes with ingested food [39] or the local environment and our results showed a relationship of the bacterial community to the environment where the ants were collected. These microbes are being picked up in the environment or their local diet, and therefore are less stable, relative to the host.
4. Conclusion
Our results showed that bacterial communities are distinct in the different parts of the ant’s body and the reason for this could be each part of the body has unique organs with different functions. In addition, the structure of the bacterial community found in the gaster may be explained by the complex proventriculum of Camponotus acting as a filter as seen in other ants. Regarding the high diversity found associated with the head and mesosoma, our findings confirm that this diversity is associated with the environment where the ants were collected. Many studies to date have analyzed the bacterial community of the insect gut and found it is less diverse than that found in vertebrates [3] [40] [41] [42] [43] [44] . However, it is already known that several factors can contribute to the gut bacterial community such as diet, physiology, immunity and physical barriers [45] [46] [47] [48] . Although uncovering the functional role, if any, in host-associated microbial communities is critical to understanding how they may influence aspects of host biology, documenting the diversity of microbial communities associated with hosts and across body parts is an important first step.
5. Methods
1) Sample collection and determination of the different stages of development
The 58 specimens used in this study were collected in several locations from South and North America from 2014-2015. (Additional File 1). The samples were collected and immediately preserved in 95% ethanol and stored at −20˚C before DNA extraction. The head, mesosoma and gaster were dissected and included separately totaling 174 samples (Additional File 2). The taxonomic identifications for the USA ants follow keys to species in the southeastern US (available from: http://mississippientomologicalmuseum.org.msstate.edu//Researchtaxapages/Formicidaepages/Identification.Keys.htm#.WE7qIH31-3H—from Creighton 1950, Snelling 1988; Mark Deyrup, pers. comm.; William MacKay’s Camponotus website). Ants from South America were identified to the genus following Baccaro et al. [49] and by using the collections at the University of São Paulo (USP) Zoology Museum. All vouchers were deposited in the collection of the USP Zoology Museum in São Paulo, Brazil.
2) DNA Extraction and Bacterial DNA Sequencing
Total DNA was extracted from the head, mesosoma and gaster separately with Qiagen DNeasy Tissue kit following the manufacturer’s recommendations with slight modifications following Moreau [50] and we did not use the modification of the Quigen DNeasy kit for gram-positive bacteria. We amplified the bacterial region of 16S rRNA through primers described in Caporaso et al. [51] , following the Earth Microbiome Project protocol (515f primer and 806r; for details see: http://www.earthmicrobiome.org/emp-standard-protocols/16s/). PCR was performed in triplicate, each 25 µl PCR reaction contained 12 µl of MO BIO PCR Water (Certified DNA-free), 10 µl of 5 Prime HotMasterMix (1×), 1 µl of forward primer (5 mM concentration, 200 final pM), 1 µl Golay barcode tagged reverse primer (5 mM concentration, 200 pM final) and 1 µL of template DNA, under the following thermal cycler conditions 94˚C for 3 min with 35 cycles at 94˚C for 45 s, 50˚C is 60 s, and 72˚C for 90 s, with a final of 10 min at 72˚C. After amplification as described above, the triplicate reactions were combined.
The samples were quantified via qPCR and Qubit (Thermo Fisher Scientific), and only then pooled with different samples after controlling for volume. For purification, only 100 µL of each pool was cleaned using the UltraClean PCR Clean-Up Kit (MO BIO), following the manufacturer’s recommendations. After quantification, the molarity of the pool was determined and diluted down to 2 nM, denatured, and then diluted to a final concentration of 6.1 pM with a 10% PhiX for sequencing on the Illumina MiSeq. A MiSeq run using MiSeq V2 Reagent Kit 300 Cycles (150 × 150) was performed using the custom sequencing primers and procedures described in the supplementary methods in Caporaso et al. [51] on the Illuminia MiSeq at the Field Museum of Natural History, Chicago, IL, USA. All raw sequence data is available publicly in Figshare [https://figshare.com/s/290531bea3dee984444e] and NCBI SRA accession number SRR5136256 and study SRP095836.
3) Bacterial Quantification
We measured the quantity of bacterial DNA present with quantitative PCR of the bacterial 16S rRNA gene using 515f (5’-GTGCCAGCMG CCGCGGTAA) and 806r (5’-GGACTACHVGGGTWT CTAAT) universal bacterial primers of the EMP (http://www.earthmicrobiome.org/emp-standard-protocols/16s/). All qPCRs were performed on a CFX Connect Real-Time System (Bio-Rad, Hercules, CA) using SsoAdvanced 2X SYBR green supermix (Bio-Rad) and 2 µL of DNA. Standard curves were created from serial dilutions of linearized plasmid containing inserts of the E. coli 16S rRNA gene and melt curves were used to confirm the absence of qPCR primer dimers. The resulting triplicate quantities were averaged before calculating the number of bacterial 16S rRNA gene copies per microliter of DNA solution (Additional File 2).
4) Bioinformatic Analysis
The sequences were analyzed in QIIME 1.9.1 [52] . The forward and reverse sequences were merged through SeqPrep, which showed better results for the present study. Demultiplexing was completed with the split_libraries_fastq.py command. QIIME defaults were used for quality filtering of raw Illumina data. For defining OTUs, we chose the pick_open_reference_otus.py command, which has an additional de novo OTU picking approach, against the SILVA 128 reference database at 97% identity [53] [54] and UCLUST to create the OTU table. Chimera checking was performed in QIIME and PyNAST (v1.2.2) was used for sequence alignment [55] . The summarize_taxa_through_plots.py command was used to create a folder containing taxonomy summary files. The relative abundance of the bacterial community was calculated for each part of the ant body.
At a sequencing depth of 400, 99 samples passed this cutoff (some samples did not have high quality DNA to succeed in sequencing) and were included in downstream analyses, including 30 from the head, 19 from the mesosoma and 50 from the gaster (Additional File 7). Alpha diversity was quantified using observed species richness, Shannon diversity to create the rarefaction curve, following the commands available in QIIME. A matrix of community pairwise distances were used to cluster samples by principal coordinates analysis (PCoA). We used Analysis of Similarity (ANOSIM) to test whether two or more predefined groups of samples are significantly different, and Adonis [56] to determine sample grouping all calculated by compare_categories.py command in QIIME. The input for these analyzes were Unweighted UniFrac distance matrices [57] , which uses phylogenetic information to calculate community similarity, were produced through the QIIME pipeline. These beta diversity metrics were used to compare community level differences sample type (head, mesosoma and gaster) to address question 1, that bacterial communities are different across parts of the ant’s body (head, mesosoma and gaster).
To illustrate the relationship between ecological communities [58] [59] , we implemented the analysis of multidimensional nonmetric scaling (NMDS) and related statistics in the PAST3 software package [60] . Sorensen (Dice coefficient) and Bray-Curtis similarity indices [58] were used to test the composition and the structure of the bacterial community, respectively. The samples were grouped according to the sample type and host localities, and after viewing the plots, analyzes of similarity (ANOSIM) with Bonferroni correction was used to determine statistical significance [58] [59] . The SIMPER analysis was conducted to verify the contribution of each OTU responsible for the structure found in different body parts [59] .
A heatmap was constructed with only the OTUs that are responsible for structuring (Bray Curtis) of the bacterial communities in the different parts of the ant body that were evidenced in the analysis of SIMPER, using heatmap.2 and the vegan package [61] in R [62] . The dendrogram of the samples shown in the heatmap was created with Bray-Curtis dissimilarity hierarchical clustering of bacterial communities in hclust.
Beta diversity metrics (Unweighted UniFrac distance matrices) [57] and Adonis [56] were used to compare community level differences between host localities (city)—with the bacterial communities of the head and the mesosoma combined to address question 2 of this manuscript, that if the diversity found is explained by the environment in which these ants were collected.
Funding
M.O.R. thanks CAPES Foundation (process no. 007343/2014-00), and the Ministry of Education of Brazil, (Brasília DF 70.040-020) for their financial support. C.S.M. acknowledges the National Science Foundation (DEB-1900357).
Authors’ Contributions
MOR, CSM and OCB designed the experiments, analyzed the data and wrote the manuscript. MOR performed the experiments. CSM and OCB assists in data analysis and discussions. All authors read and approved the final manuscript.
Acknowledgements
We would like to thank all those who helped us by sending specimens (all the names are in additional file table 1). We also thank the Museum of Zoology of USP and Rodolfo Probst for help in identifying and depositing the material in the collection. We thank Gabriel Amaral, Manuela L. Calmanovici, Matt Boot, Kevin Feldheim, Estefany Romero, Andrea Thompson, Max Winston, Brian Wray, and Erica Zahnle, for their invaluable assistance in this study. For advice regarding the experimental design and analyses we thank Sarah Owens, Benjamin Rubin, Jon Sanders, Max Winston and Brian Wray. We thank all members of the Moreau Lab for various advice and help. All work was completed in the Pritzker Laboratory for Molecular Systematics and Evolution at the Field Museum of Natural History, Chicago, Illinois, USA. We thank Bruce and René Lauer and the Lauer Foundation for Paleontology, Science and Education NFP for generous support of the Pritzker Laboratory, which made this research possible.
Conflicts of Interest
The authors declare no competing interests.
Cite this paper
Ramalho, M.O., Moreau, C.S. and Bueno, O.C. (2019) The Potential Role of Environment in Structuring the Microbiota of Camponotus across Parts of the Body. Advances in Entomology, 7, 47-70. https://doi.org/10.4236/ae.2019.73005
References
- 1. Charlat, S., et al. (2003) Evolutionary Consequences of Wolbachia Infections. Trends in Genetics, 19, 217-223. https://doi.org/10.1016/S0168-9525(03)00024-6
- 2. Engelstädter, J. and Hurst, G.D.D. (2009) The Ecology and Evolution of Microbes that Manipulate Host Reproduction. Annual Review of Ecology, Evolution, and Systematics, 40, 127-149. https://doi.org/10.1146/annurev.ecolsys.110308.120206
- 3. Feldhaar, H. (2011) Bacterial Symbionts as Mediators of Ecologically Important Traits of Insect Hosts. Ecological Entomology, 36, 533-543. https://doi.org/10.1111/j.1365-2311.2011.01318.x
- 4. Oliver, K.M., et al. (2010) Facultative Symbionts in Aphids and the Horizontal Transfer of Ecologically Important Traits. Annual Review of Entomology, 55, 247-266. https://doi.org/10.1146/annurevento-112408-085305
- 5. Stouthamer, R., et al. (1999) Wolbachia pipientis: Microbial Manipulator of Arthropod Reproduction. Annual Review of Microbiology, 53, 71-102. https://doi.org/10.1146/annurev.micro.53.1.71
- 6. Werren, J.H. (1997) Biology of Wolbachia. Annual Review of Entomology, 42, 587-609. https://doi.org/10.1146/annurev.ento.42.1.587
- 7. Ley, R.E., et al. (2008) Evolution of Mammals and Their Gut Microbes. Science, 80, 320. https://doi.org/10.1126/science.1155725
- 8. Ramalho, M.O., et al. (2017) Microbial Composition of Spiny Ants (Hymenoptera: Formicidae: Polyrhachis) across Their Geographic Range. BMC Evolutionary Biology, 17, 96. https://doi.org/10.1186/s12862-017-0945-8
- 9. Sanders, J.G., et al. (2014) Stability and Phylogenetic Correlation in Gut Microbiota: Lessons from Ants and Apes. Molecular Ecology, 23, 1268-1283. https://doi.org/10.1111/mec.12611
- 10. Linnenbrink, M., et al. (2013) The Role of Biogeography in Shaping Diversity of the Intestinal Microbiota in House Mice. Molecular Ecology, 22, 1904-1916. https://doi.org/10.1111/mec.12206
- 11. Ramalho, M.O., et al. (2017) Species-Specific Signatures of the Microbiome from Camponotus and Colobopsis Ants across Developmental Stages. PLoS ONE, 12, e0187461. https://doi.org/10.1371/journal.pone.0187461
- 12. Rubin, B.E.R., et al. (2014) DNA Extraction Protocols Cause Differences in 16S rRNA Amplicon Sequencing Efficiency But Not in Community Profile Composition or Structure. Microbiologyopen, 3, 910-921. https://doi.org/10.1002/mbo3.216
- 13. Saraithong, P., et al. (2017) Midgut Bacterial Communities in the Giant Asian Honeybee (Apis dorsata ) across 4 Developmental Stages: A Comparative Study. Insect Science, 24, 81-92. https://doi.org/10.1111/1744-7917.12271
- 14. Lanan, M.C., et al. (2015) A Bacterial Filter Protects and Structures the Gut Microbiome of an Insect. The ISME Journal, 10, 1866-1876.
- 15. Kautz, S., et al. (2013) Surveying the Microbiome of Ants: Comparing 454 Pyrosequencing with Traditional Methods to Uncover Bacterial Diversity. Applied and Environmental Microbiology, 79, 525-534. https://doi.org/10.1128/AEM.03107-12
- 16. Brown, B.P. and Wernegreen, J.J. (2016) Deep Divergence and Rapid Evolutionary Rates in Gut-Associated Acetobacteraceae of Ants. BMC Microbiology, 16, 140. https://doi.org/10.1186/s12866-016-0721-8
- 17. Salem, H., et al. (2015) An Out-of-Body Experience: The Extracellular Dimension for the Transmission of Mutualistic Bacteria in Insects. Proceedings of the Royal Society B, 282, Article ID: 20142957. https://doi.org/10.1098/rspb.2014.2957
- 18. Munson, M.A., et al. (1991) Evidence for the Establishment of Aphid-Eubacterium Endosymbiosis in an Ancestor of Four Aphid Families. Journal of Bacteriology, 173, 6321-6324. https://doi.org/10.1128/jb.173.20.6321-6324.1991
- 19. Baumann, P. (2005) Biology of Bacteriocyte-Associated Endosymbionts of Plant Sap-Sucking Insects. Annual Review of Microbiology, 59, 155-189. http://www.annualreviews.org/doi/abs/10.1146/annurev.micro.59.030804.121041 https://doi.org/10.1146/annurev.micro.59.030804.121041
- 20. Wernegreen, J.J., et al. (2009) One Nutritional Symbiosis Begat Another: Phylogenetic Evidence That the Ant Tribe Camponotini Acquired Blochmannia by Tending Sap-Feeding Insects. BMC Evolutionary Biology, 9, 292. https://doi.org/10.1186/1471-2148-9-292
- 21. Sameshima, S., et al. (1999) Phylogenetic Comparison of Endosymbionts with Their Host Ants Based on Molecular Evidence. Zoological Science, 16, 993-1000. https://doi.org/10.2108/zsj.16.993
- 22. Feldhaar, H., et al. (2007) Nutritional Upgrading for Omnivorous Carpenter Ants by the Endosymbiont Blochmannia. BMC Biology, 5, 48. https://doi.org/10.1186/1741-7007-5-48
- 23. Ramalho, M.O., et al. (2017) Intracellular Symbiotic Bacteria of Camponotus textor, Forel (Hymenoptera, Formicidae). Current Microbiology, 74, 589-597. https://doi.org/10.1007/s00284-017-1201-6
- 24. Blüthgen, N., et al. (2003) Disentangling a Rainforest Food Web Using Stable Isotopes: Dietary Diversity in a Species-Rich Ant Community. Oecologia, 137, 426-435. https://doi.org/10.1007/s00442-003-1347-8
- 25. Cook, S.C. and Davidson, D.W. (2006) Nutritional and Functional Biology of Exudate-Feeding Ants. Entomologia Experimentalis et Applicata, 118, 1-10. https://doi.org/10.1111/j.1570-7458.2006.00374.x
- 26. Davidson, D.W., et al. (2003) Explaining the Abundance of Ants in Lowland Tropical Rainforest Canopies. Science, 80, 300. https://doi.org/10.1126/science.1082074
- 27. Yek, S.H. and Mueller, U.G. (2011) The Metapleural Gland of Ants. Biological reviews of the Cambridge Philosophical Society, 86, 774-791. https://doi.org/10.1111/j.1469-185X.2010.00170.x
- 28. Eisner, T. and Wilson, E. (1952) The Morphology of the Proventriculus of a Formicine Ant. Psyche (New York), 59, 47-60. https://doi.org/10.1155/1952/14806
- 29. Ramalho, M.O., et al. (2018) Transovarian Transmission of Blochmannia and Wolbachia Endosymbionts in the Neotropical Weaver Ant Camponotus textor (Hymenoptera, Formicidae). Current Microbiology, 75, 866-873. https://doi.org/10.1007/s00284-018-1459-3
- 30. Degnan, P.H., et al. (2004) Host-Symbiont Stability and Fast Evolutionary Rates in an Ant-Bacterium Association: Cospeciation of Camponotus Species and Their Endosymbionts, Candidatus Blochmannia. Systematic Biology, 53, 95-110. https://doi.org/10.1080/10635150490264842
- 31. Snyder, A.K., et al. (2011) The Phylogeny of Sodalis-Like Symbionts as Reconstructed Using Surface-Encoding Loci. FEMS Microbiology Letters, 317, 143-151. https://doi.org/10.1111/j.1574-6968.2011.02221.x
- 32. Heddi, A., et al. (1998) Molecular Characterization of the Principal Symbiotic Bacteria of the Weevil Sitophilus oryzae: A Peculiar G + C Content of an Endocytobiotic DNA. Journal of Molecular Evolution, 47, 52-61. https://doi.org/10.1007/PL00006362
- 33. Dale, C. and Maudlin, I. (1999) Sodalis gen. nov. and Sodalis glossinidius sp. nov., a Microaerophilic Secondary Endosymbiont of the Tsetse Fly Glossina morsitans morsitans. International Journal of Systematic Bacteriology, 49, 267-275. https://doi.org/10.1099/00207713-49-1-267
- 34. Burke, G.R., et al. (2009) Evolution and Diversity of Facultative Symbionts from the Aphid Subfamily Lachninae. Applied and Environmental Microbiology, 75, 5328- 5335. https://doi.org/10.1128/AEM.00717-09
- 35. Grünwald, S., et al. (2010) Microbial Associations in Gut Systems of Wood- and Bark-Inhabiting Longhorned Beetles [Coleoptera: Cerambycidae]. Systematic and Applied Microbiology, 33, 25-34. https://doi.org/10.1016/j.syapm.2009.10.002
- 36. Hu, Y., et al. (2014) Correlates of Gut Community Composition across an Ant Species (Cephalotes varians) Elucidate Causes and Consequences of Symbiotic Variability. Molecular Ecology, 23, 1284-1300. https://doi.org/10.1111/mec.12607
- 37. Vieira, A.S., et al. (2017) Microbial Communities in Different Tissues of Atta sexdens rubropilosa Leaf-Cutting Ants. Current Microbiology, 74, 1216-1225. https://doi.org/10.1007/s00284-017-1307-x
- 38. Kellner, K., et al. (2015) Bacterial Community Composition and Diversity in an Ancestral Ant Fungus Symbiosis. FEMS Microbiology Ecology, 91, pii: fiv073. https://doi.org/10.1093/femsec/fiv073
- 39. Pernice, M., et al. (2014) Towards an Integrated Understanding of Gut Microbiota Using Insects as Model Systems. Journal of Insect Physiology, 69, 12-18. https://doi.org/10.1016/j.jinsphys.2014.05.016
- 40. Hosokawa, T., et al. (2006) Strict Host-Symbiont Cospeciation and Reductive Genome Evolution in Insect Gut Bacteria. PLOS Biology, 4, e337. https://doi.org/10.1371/journal.pbio.0040337
- 41. McFall-Ngai, M. (2007) Adaptive Immunity: Care for the Community. Nature, 445, 153-153. https://doi.org/10.1038/445153a
- 42. Moran, N.A., et al. (2008) Genomics and Evolution of Heritable Bacterial Symbionts. Annual Review of Genetics, 42, 165-190. https://doi.org/10.1146/annurev.genet.41.110306.130119
- 43. Engel, P., et al. (2012) Functional Diversity within the Simple Gut Microbiota of the Honey Bee. Proceedings of the National Academy of Sciences of USA, 109, 11002- 11007. https://doi.org/10.1073/pnas.1202970109
- 44. Jing, X., et al. (2014) The Bacterial Communities in Plant Phloem-Sap-Feeding Insects. Molecular Ecology, 23, 1433-1444. https://doi.org/10.1111/mec.12637
- 45. Muegge, B.D., et al. (2011) Diet Drives Convergence in Gut Microbiome Functions across Mammalian Phylogeny and within Humans. Science, 332, 970-974. https://doi.org/10.1126/science.1198719
- 46. Kwong, W.K. and Moran, N.A. (2015) Evolution of Host Specialization in Gut Microbes: The Bee Gut as a Model. Gut Microbes, 6, 214-220. https://doi.org/10.1080/19490976.2015.1047129
- 47. Hegedus, D., et al. (2009) New Insights into Peritrophic Matrix Synthesis, Architecture, and Function. Annual Review of Entomology, 54, 285-302. https://doi.org/10.1146/annurev.ento.54.110807.090559
- 48. Nyholm, S.V. and Graf, J. (2012) Knowing Your Friends: Invertebrate Innate Immunity Fosters Beneficial Bacterial Symbioses. Nature Reviews Microbiology, 10, 815-827. https://doi.org/10.1038/nrmicro2894
- 49. Baccaro, F.B., et al. (2015) Guia para os gêneros de formigas do Brasil. Editora INPA, Manaus.
- 50. Moreau, C.S. (2014) A Practical Guide to DNA Extraction, PCR, and Gene-Based DNA Sequencing in Insects. Halteres, 5, 32-42.
- 51. Caporaso, J.G., et al. (2012) Ultra-High-Throughput Microbial Community Analysis on the Illumina HiSeq and MiSeq Platforms. The ISME Journal, 6, 1621-1624. https://doi.org/10.1038/ismej.2012.8
- 52. Caporaso, J.G., et al. (2010) QIIME Allows Analysis of High-Throughput Community Sequencing Data. Nature Methods, 7, 335-336. https://doi.org/10.1038/nmeth.f.303
- 53. Quast, C., et al. (2013) The SILVA Ribosomal RNA Gene Database Project: Improved Data Processing and Web-Based Tools. Nucleic Acids Research, 41, D590- D596. https://doi.org/10.1093/nar/gks1219
- 54. Yilmaz, P., et al. (2014) The SILVA and “All-Species Living Tree Project (LTP)” Taxonomic Frameworks. Nucleic Acids Research, 42, D643-D648. https://doi.org/10.1093/nar/gkt1209
- 55. Caporaso, J., et al. (2010) PyNAST: A Flexible Tool for Aligning Sequences to a Template Alignment. Bioinformatics, 26, 266-267.
https://doi.org/10.1093/bioinformatics/btp636
http://bioinformatics.oxfordjournals.org/content/26/2/266.short - 56. McArdle, B.H. and Anderson, M.J. (2001) Fitting Multivariate Models to Community Data: A Comment on Distance-Based Redundancy Analysis. Ecology, 82, 290- 297. https://doi.org/10.1890/0012-9658(2001)082[0290:FMMTCD]2.0.CO;2
- 57. Lozupone, C. and Knight, R. (2005) UniFrac: A New Phylogenetic Method for Comparing Microbial Communities. Applied and Environmental Microbiology, 71, 8228-8235. https://doi.org/10.1128/AEM.71.12.8228-8235.2005
- 58. McCune, B. and Grace, J.B. (2002) Analysis of Ecological Communities. MJM Software Design, Gleneden Beach.
- 59. Clarke, K.R. (1993) Non-Parametric Multivariate Analyses of Changes in Community Structure. Austral Ecology, 18, 117-143. https://doi.org/10.1111/j.1442-9993.1993.tb00438.x
- 60. Hammer, Ø., Harper, D.A.T. and Ryan, P.D. (2001) PAST: Paleontological Statistics Software: Package for Education and Data Analysis. Palaeontologia Electronica, 4, 1-9.
- 61. Oksanen, J., et al. (2007) The Vegan Package. https://www.researchgate.net/profile/Gavin_Simpson/publication/228339454_The_vegan_package/links/0912f50be86bc29a7f000000.pdf
- 62. R Development Core Team (2015) R: A Language and Environment for Statistical Computing. http://www.R-project.org
Additional File
Additional File 1. Camponotus specimens used for the development of this study.

Additional File 2. Bacterial quantification through 16S rRNA gene (qPCR) of all Camponotus samples—separated into head, mesosoma and gaster. Each sample was analyzed in triplicate therefore follows the values of average and standard deviation of each sample.
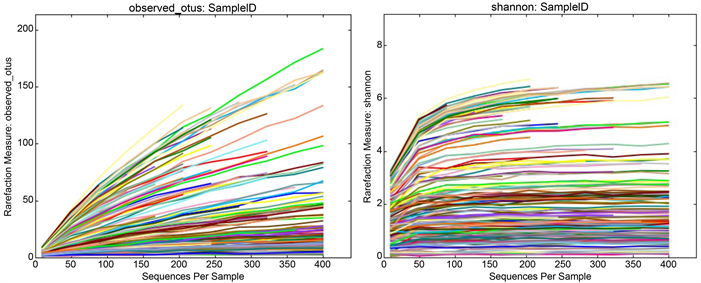
Additional File 3. Rarefaction curves were used to estimate richness in the observed OTUs. The vertical axis shows the observed bacterial OTUs and Shannon measure. The number of sequences per sample is shown on the horizontal axis. Note that although sequencing covers thousands of Illumina reads, some samples have not reached the plateau. Each sample is represented by a different color in these graphs.
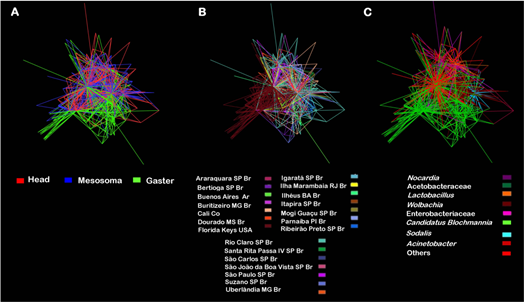
Additional File 4. Network analysis of Camponotus samples with edges representing the main community bacterial members using the spring-embedded edge-weighted algorithm. OTUs with less than 100 reads were hidden. In this analysis each vertices is represented by a host and the edges are the shared bacterial communities, colored with different categories. (A) The edges were colored according to the different sample type: head, mesosoma and gaster of Camponotus. (B) The edges were colored according to the different localities. (C) The edges were colored according to the different bacteria. Note that it is the same image, but colored according to the different sample type, localities and bacteria. For the former, it is easy to see structuring. For the locality, it is not possible to find a pattern easily, outside of the samples from the Florida Keys, USA. And for the identity of the bacteria, it is perceived that there is a certain overlap of Blochmannia associated with the gaster.
Additional File 5. SIMPER analyses indicating the contribution of specific operational taxonomic units (OTUs) to the observed differences in community structure among different sample type of Camponotus.
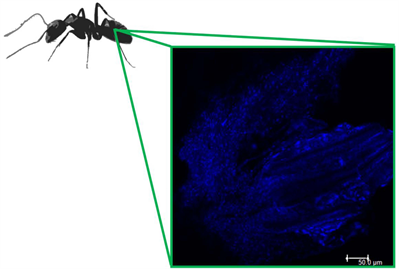
Additional File 6. The complex proventriculum of Camponotus with the nucleus stained in blue (DAPI). Confocal Microscopy. Workers gasters were dissected in 1X PBS (Figure 1(A)). The midgut was separated and fixed in 4% (w/v) paraformaldehyde in PBS at room temperature for two hours. Subsequently, they were washed in 50%, 70% and 100% ethanol baths for 3 min each. The material was placed on StarFrost slides (Knittel Glass, Germany), and dried at room temperature. The DAPI (Molecular Probes, USA) (1:500) which stains host nuclei blue, was placed directly into midgut for 5 min, and then washed 3x in miliQ water. Prolong Gold (Thermo Fisher Scientific, USA) was used to mount the slide, which was overlaid with cover slip and sealed with clear nail polish. For the whole-mount laser the Leica TCS SP5II confocal microscope was used to obtain the photomicrographs (lasers 405 nm) and Leica TCS SP5II software was used for the confocal analysis using maximum projection.
Additional File 7. Final samples used for downstream analysis after the depth of 400 reads.
MOR0009h: 406.0
MOR0005h: 420.0
MOR0014h: 430.0
MOR0013h: 482.0
MOR0022h: 489.0
MOR0006h: 519.0
MOR0053h: 535.0
MOR0074h: 538.0
MOR0056h: 542.0
MOR0070h: 551.0
MOR0075h: 561.0
MOR0045h: 566.0
MOR0011h: 569.0
MOR0017h: 582.0
MOR0010h: 596.0
MOR0033h: 602.0
MOR0081h: 606.0
MOR0052h: 617.0
MOR0041h: 687.0
MOR0015h: 693.0
MOR0038h: 827.0
MOR0039h: 857.0
MOR0021h: 872.0
MOR0034h: 941.0
MOR0020h: 963.0
MOR0028h: 1066.0
MOR0035h: 1132.0
MOR0003h: 1233.0
MOR0095h: 1311.0
BDB241h: 2524.0
MOR0062m: 408.0
MOR0010m: 438.0
MOR0029m: 569.0
MOR0011m: 575.0
MOR0035m: 590.0
MOR0014m: 590.0
MOR0033m: 595.0
MOR0006m: 615.0
MOR0053m: 629.0
MOR0039m: 632.0
MOR0040m: 828.0
MOR0020m: 874.0
MOR0021m: 878.0
MOR0032m: 897.0
MOR0008m: 939.0
MOR0095m: 1221.0
MOR0057m: 1364.0
MOR0075m: 1645.0
BDB241m: 2764.0
MOR0052g: 405.0
MOR0031g: 408.0
MOR0028g: 421.0
MOR0023g: 446.0
MOR0062g: 456.0
MOR0057g: 460.0
MOR0035g: 477.0
MOR0038g: 498.0
MOR0030g: 501.0
MOR0059g: 502.0
MOR0075g: 510.0
MOR0012g: 594.0
MOR0032g: 607.0
MOR0026g: 645.0
MOR0007g: 662.0
MOR0040g: 662.0
MOR0074g: 680.0
MOR0016g: 740.0
MOR0002g: 772.0
MOR0004g: 773.0
MOR0053g: 789.0
MOR0073g: 794.0
MOR0013g: 795.0
MOR0056g: 824.0
MOR0001g: 827.0
MOR0037g: 855.0
MOR0019g: 914.0
MOR0082g: 996.0
MOR0034g: 1003.0
MOR0036g: 1021.0
MOR0070g: 1036.0
MOR0027g: 1068.0
MOR0006g: 1119.0
MOR0014g: 1138.0
MOR0025g: 1143.0
MOR0033g: 1174.0
MOR0069g: 1180.0
MOR0022g: 1222.0
MOR0015g: 1304.0
MOR0020g: 1306.0
MOR0045g: 1320.0
MOR0011g: 1442.0
MOR0010g: 1511.0
MOR0017g: 1519.0
MOR0041g: 1587.0
MOR0021g: 1667.0
MOR0024g: 1672.0
MOR0009g: 2316.0
BDB241g: 2351.0
MOR0095g: 3586.0