Open Journal of Microphysics
Vol.3 No.2(2013), Article ID:31500,5 pages DOI:10.4236/ojm.2013.32005
Checking of XRF Observations with Matrix Terms Involved in Sample Analysis
Nuclear Science Laboratories, Physics Department, Punjabi University, Patiala, India
Email: rmsingla@yahoo.com
Copyright © 2013 Meenakshi Bansal et al. This is an open access article distributed under the Creative Commons Attribution License, which permits unrestricted use, distribution, and reproduction in any medium, provided the original work is properly cited.
Received January 2, 2013; revised February 4, 2013; accepted February 11, 2013
Keywords: XRF Observations; Matrix Terms; Sample Analysis
ABSTRACT
In X-Ray Fluorescence (XRF) studies of samples, the relative absorption terms for an analyte in a sample with respect to its standard (the analyte itself or its compound) have been empirically related to analyte amount as well as to next enhanced element amount in the sample. The terms along with these empirical relations have been used to cross check the XRF observations for the analysis work. One such an attempt has been made in the present work for bulk measurements on rice saplings and a disparity in observations has been caught.
1. Introduction
X-ray fluorescence has been a powerful analytical tool since the beginning of its application to elemental analysis. The working principle of XRF analysis is the measurement of energy and intensity of the X-rays emitted from the sample. The energies of the emitted X-rays are the characteristic of elements present in the sample and thus provide the knowledge about the composition of sample, hence form the basis of qualitative analysis. Whereas the measurement of the intensities of the X-rays provides information about the concentration of the elements present, thereby forms the basis of quantitative analysis. In XRF analysis of samples, the presence of substrate matrix effects (absorption and enhancement) disturbs the proportionality between the elemental characteristic X-ray intensity and its amount [1-4]. For the correction and compensation of these effects, different analytical methods [5-10] exist in literature. While evaluating the absorption and enhancement terms, Bansal [11] established that the relative absorption and enhancement terms for an analyte in a sample with respect to its standard (the analyte itself or its compound) are related to analyte amount in the sample and its characteristic X-ray counts under the photo peak in each sample and standard spectra respectively. The absorption terms were empirically related to the determined analyte amounts irrespective of its X-ray counts. Similarly, the enhancement terms for the analyte were empirically related, in turn, with the analyte amount and with enhancer amount [12]. For a specific category of substrate, these relations give absorption and enhancement terms direct from the known amounts of analyte and enhancer elements or vice versa i.e. with known absorption and enhancement terms and the amount of enhancer element, the analyte amount can be predicted. Moreover, these empirical relations along with the terms can cross check the XRF observations of the analysis. In the present work, the bulk measurements on rice saplings have been checked following the said procedure for absorption terms.
2. Methodology
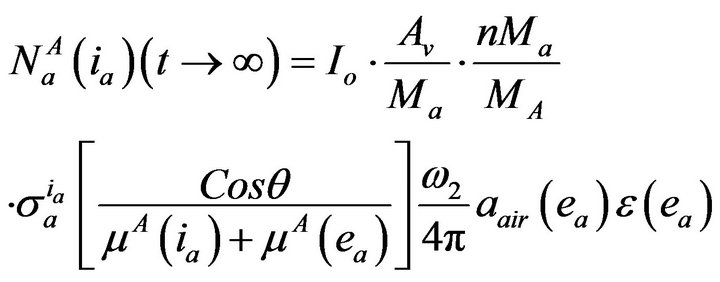
In a sample S, if X-rays of an analyte a excite the X-rays of other element c, it causes the absorption of a X-rays and enhancement of c X-rays called matrix effects that disturb the linearity between the analyte X-ray intensity and analyte amount. When S is irradiated with photons ia from a source for selective excitation of a and the resulting a X-rays are counted in a detector (Figure 1), the
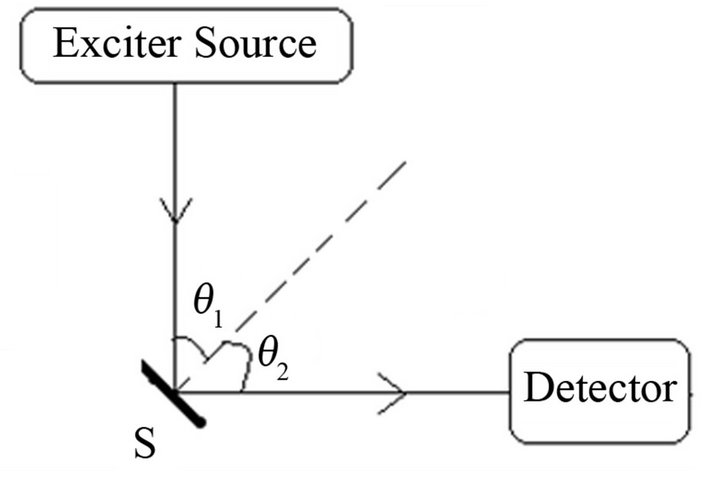
Figure 1. Arrangement of source, sample S and detector.
counts “ ” under the X-ray photo peak of analyte a from the sample can be expressed in terms of basic and the experimental set up parameters as [11]:
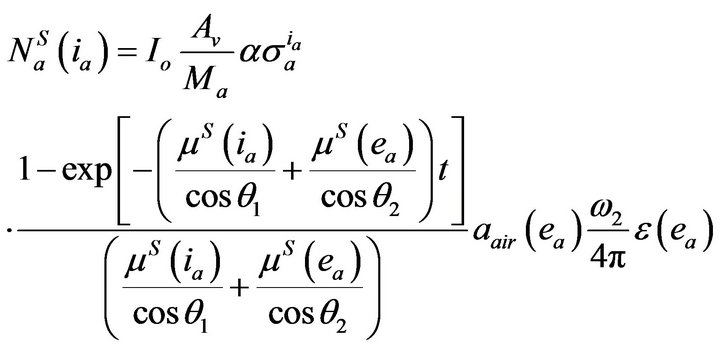 (1)
(1)
where, the number of incident photons at the sample surface Io, solid angle of target with detector , air absorption correction
  at emitted (ea) X-ray energies and detector efficiency
  of detector at emitted X-ray energy are experimental setup parameters. The X-ray production cross-section of a X-rays at incident energy ia,
  , Avogadro’s number Av, atomic weight of analyte element Ma (g) and the factor
(effective thickness), 
in terms of absorption coefficients, m’s (cm2/g), of sample S at incident (ia) and emitted (ea) photon energies and sample thickness t (g/cm2) are basic parameters. a is the fractional analyte amount in target material.
In case of symmetrical geometry (θ1 = θ2 = θ) and for thick samples , the Equation (1) reduces to
 (2)
(2)
Similarly, if the S is replaced by standard A, a compound of analyte a with its molecular weight MA that comprises n atoms of a and the relation (2) reduces to
 (3)
(3)
Absorption Effects
Under selective excitation of analyte, a, absorption term of sample, S, relative to that of first standard, A, i.e.
 in terms of analyte amount a and X-ray counts under the analyte photo peak in S and A comes as
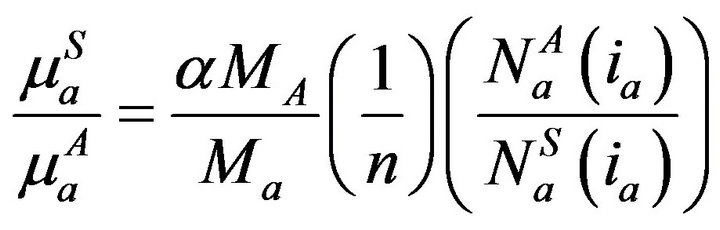 (4)
(4)
where  and
and  are sum of absorption coefficients for S and A at incident ia and emitted ea photons i.e.
 .
.
3. Empirical Relations
For empirical relations of matrix terms in rice saplings, the earlier rice sapling measurements [13] for Ca were used in relation (4). In the measurements, material of first standard was CaCO3 for Ca detection.
For selective excitation of calcium K X-rays with Ti K X-rays in double reflection set-up [13], the absorption term  was evaluated with Equation (4) using the observed counts of analyte (Ca) X-rays and determined amounts of the analyte in different samples of rice saplings. The derived terms were empirically related to the calcium amounts irrespective of their X-ray counts. Judged from the pattern of absorption term variations with determined amounts, different order polynomial fits were tried to find the closeness of generated terms with the actual ones. The polynomial fits in amounts of aCa
were tried for  term to evaluate polynomial relations as
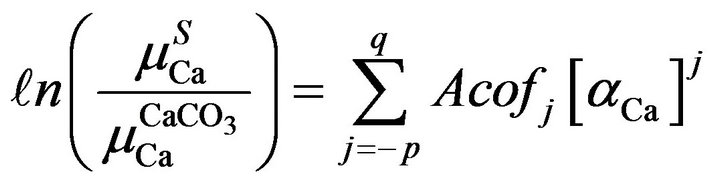 (5)
(5)
where Acofj’s are coefficients of fit for absorption terms. For the fit, care was taken that the number of values to be fitted must be greater than the number of Acofj’s that ensured optimization of the coefficients. Moreover, the uniqueness of the relations [14] was checked with different permutations and combinations of a data set so that the same closeness of fitted values with the actual ones was there for each combination.
For the derived relation, the mean absolute percent deviation Dp is measure of the analysis error. It was calculated according to the relation
 (6)
(6)
where Ci and  are the evaluated and actual weight fractions and Cim is the mean of Ci’s. The calculated Dp values for the relation is also listed in Table 1.
4. Results and Discussion
From the studies of effect of KCl and CaSO4 fertilizers
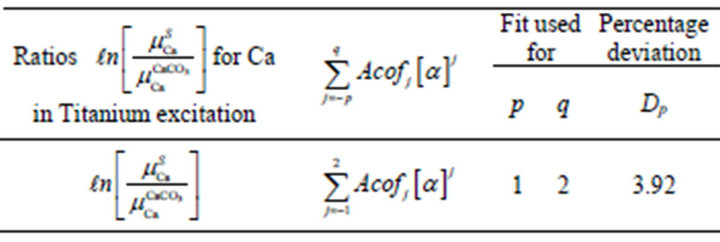
Table 1. Listing of relative absorption terms in selective excitation of Ca, its empirical relation with analyte amounts and mean absolute percent deviation Dp in rice saplings.
on the contents of K and Ca in rice plants [13], the data for nine pot samples is considered, where a pot numbered 1 was left untreated. Four pots (numbered 2 - 5) were treated with CaSO4 solutions; 50, 100, 150 and 200 mg/200 ml of water. The remaining four pots (numbered 6 - 9) were treated with KCl solutions; 50, 100, 150 and 200 mg of KCl per 200 ml of water.
In the processing for absorption terms for rice saplings, a polynomial in analyte Ca amount with its power varying for p = 1 and q = 2 was found appropriate for the nine sample data. The percentage deviation of fitted values from the actual ones is shown in the Table 2(a). Here the deviation is <10% for most of the samples except for one with fractional analyte amount 0.041, it is 19%. To reduce the overall error, that particular sample was excluded for the polynomial fitting. It was observed (in Table 2(b)) that by excluding the sample, the deviation reduced to a remarkable extent.
To certify these findings, the data on evaluated amounts of potassium in 9 samples [13] were tried for empirical relations of Ca absorption terms with potassium amounts as potassium in rice plants leads to strong absorption of Ca K X-rays. The absorption term ratios  and K fractional amounts, b, were found to represent a polynomial with p = 2 and q = 3 for the nine samples (Table 3).
Again a large deviation for the same sample was observed and with exclusion of the data of same troubling sample, the deviation reduces significantly (Tables 4(a) & (b)).
In order to find the reason behind this disparity,
 values are plotted against
  and
and  values (Figure 2). From the plot, the determined value of
  =
=
0.041 gives the value of  as 1.058. This value of relative absorption term ratio corresponds to
  value ~0.196 and vice-versa i.e. the determined
  value 0.197 corresponds to
  value ~1.058.
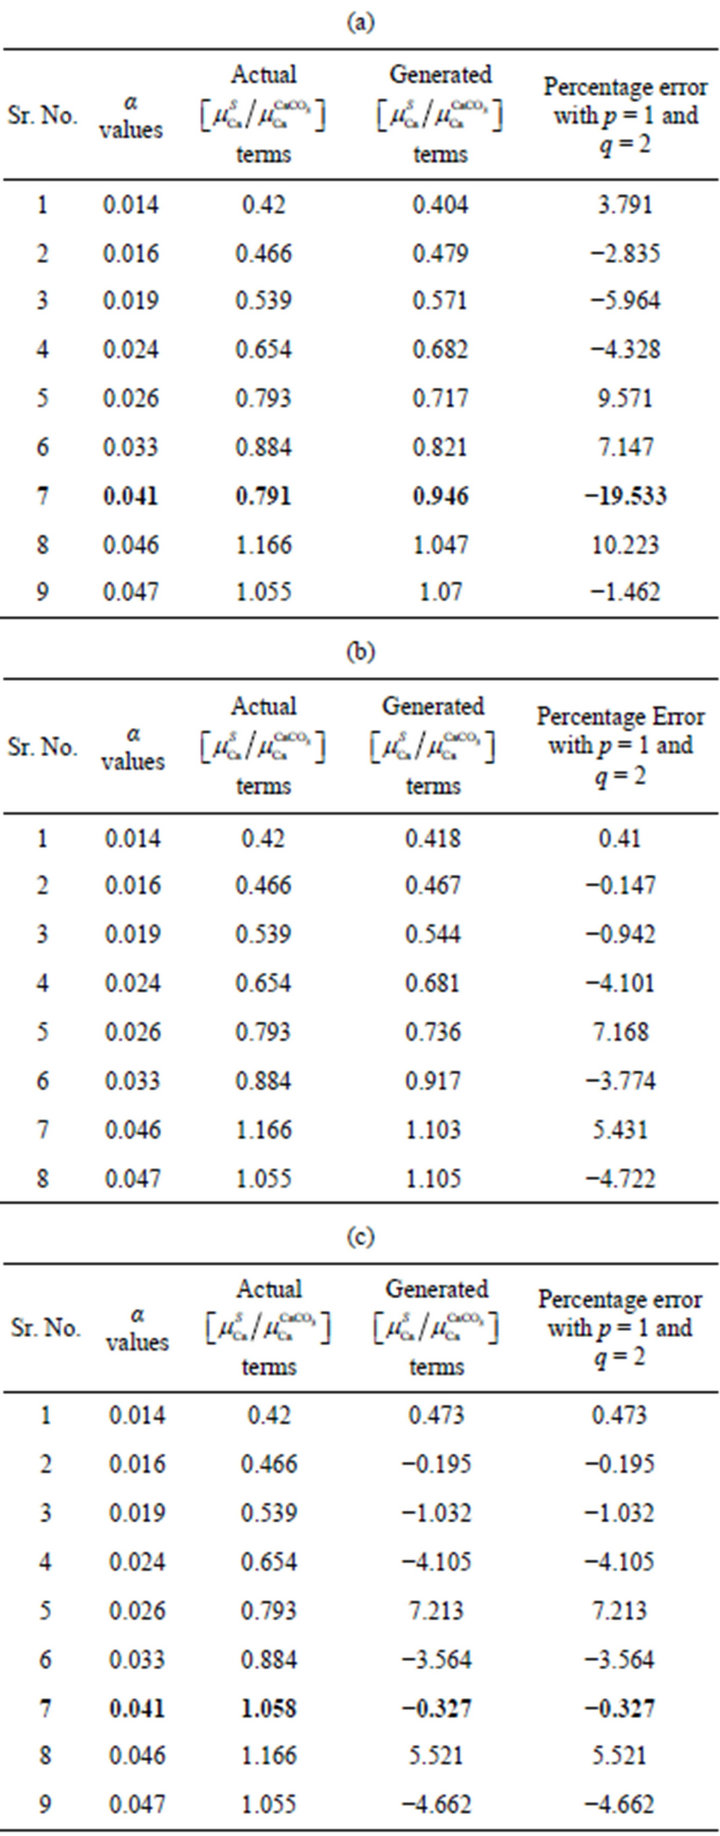
Table 2. Comparison of empirically generated relative absorption terms with the actual ones: (a) including data for pot 6 in the fitting data; (b) excluding data for pot 6 in the fitting data; (c) Fit with corrected data (taking into account generated pot 6 values).
Now, if  and
and  values are considered to be correct, then there arises some problem in absorption term value. On minute scanning of the earlier calculated values of absorption terms, it is found that in this particular case, its value is quite large and is not matching with other samples’ values which signal to a flaw with the
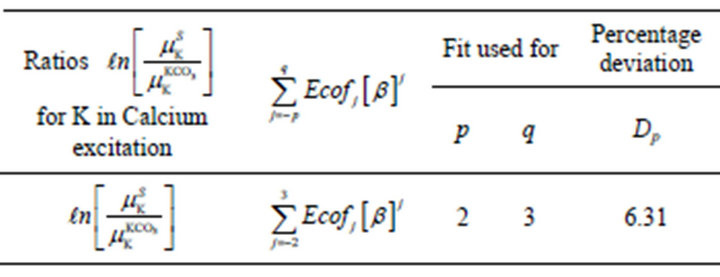
Table 3. Listing of relative absorption terms for Ca K X-rays, their empirical relations with potassium amounts, b, and mean absolute percent deviation Dp in rice saplings.
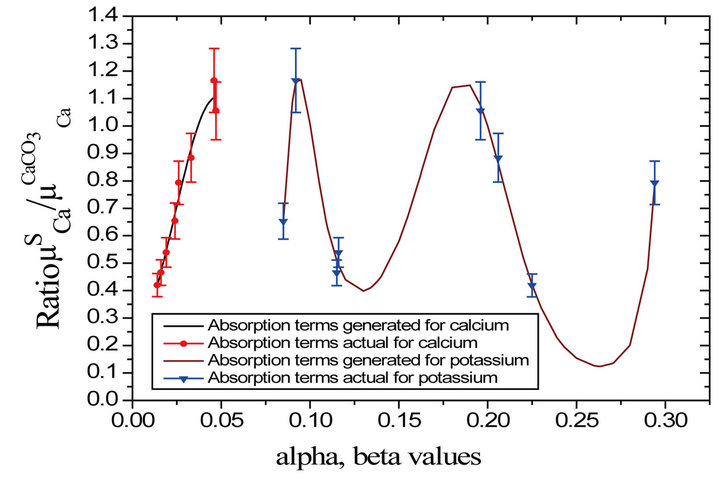
Figure 2. Plot of relative absorption terms versus concentration a and b in rice saplings.

Table 4. Comparison of empirically generated relative enhancement terms with the actual ones: (a) including data for pot 6 in the fitting data; (b) excluding data for pot 6 in the fitting data; (c) fit with corrected data (taking into account generated pot 6 value).
number of X-ray counts selected under the peak. This shows that with this method of fitting, the disparity in the observations can be combat for.
After rectifying the odd, the generated absorption term ratios for both the cases are found to be within the error < 1%.
5. Acknowledgements
The financial assistance from BRNS, Government of India in the form of project grant (ref No. 2007/37/ 6/BRNS) for this work and from DST in the form of Inspire fellowship to Ms. Kanan Deep is highly acknowledged.
REFERENCES
- B. J. Mitchell, “Encyclopedia of Spectroscopy,” Reinhold, New York, 1960.
- B. J. Mitchell, “Encyclopedia of X-Rays and Gamma Rays,” Reinhold, New York, 1963.
- R. Jenkins, “An Introduction to X-Ray Spectrometry,” Heyden, London, New York, 1976.
- R. Jenkins, R. W. Gould and D. Gedcke, “Quantitative X-Ray Spectrometry,” Marcel Dekker, New York, 1995.
- J. W. Criss and L. S. Birks, “Calculation Methods for Fluorescent X-Ray Spectrometry, Empirical Coefficients vs Fundamental Parameters,” Analytical Chemistry, Vol. 40, No. 7, 1968, pp. 1080-1086. doi:10.1021/ac60263a023
- S. D. Rasberry and K. F. J. Heinrich, “Calibration for Inter Element Effects in X-Ray Fluorescence Analysis,” Analytical Chemistry, Vol. 46, No. 1, 1974, pp. 81-89. doi:10.1021/ac60337a027
- R. Mittal, K. L. Allawadhi and B. S. Sood, “Quantitative Analysis of Binary Mixtures Using a Simple X-Ray Fluorescence Technique,” X-Ray Spectrometry, Vol. 16, No. 1, 1987, pp. 37-39. doi:10.1002/xrs.1300160109
- R. Mittal, K. L. Allawadhi, B. S. Sood, N. Singh, A. Kumar and P. Kumar, “Determination of Potassium and Calcium in Vegetables by X-Ray Fluorescence Spectrometry,” X-Ray Spectrometry, Vol. 22, No. 6, 1993, pp. 413- 417. doi:10.1002/xrs.1300220609
- H. K. Bandhu, J. S. Shahi, S. Puri, D. Mehta, M. L. Garg, N. Singh, P. C. Mangal and P. N. Trehan, “Analysis of Aerosol Samples from Chandigarh, Using EDXRF Technique,” Proceedings of National Symposium on Radiation Physics (NSRP), Patiala, October 1995, pp. 247-249.
- R. Plesch, “X-Ray Secondary Fluorescence in Matrix Correction,” X-Ray Spectrometry, Vol. 8, No. 3, 1979, pp. 114-116. doi:10.1002/xrs.1300080307
- M. Bansal, “Studies of X-Ray Fluorescence for Its Analytical Applications,” Ph.D. Thesis, Punjabi University, Patiala, 2008.
- M. Bansal, K. Deep and R. Mittal, “Matrix Effect Studies with Empirical Formulations in Maize Saplings,” Applied Radiation and Isotopes, Vol. 70, No. 10, 2012, pp. 2525- 2533. doi:10.1016/j.apradiso.2012.07.011
- Vandana and R. Mittal, “Matrix Effects during Potassium and Calcium Determinations in Rice Saplings Using XRay Spectrometry,” Applied Radiation and Isotopes, Vol. 54, No. 3, 2001, pp. 377-382. doi:10.1016/S0969-8043(00)00284-0
- M. Bansal and R. Mittal, “Parameterization and Generation of Photon Induced K Cross-Sections,” Radiation Physics and Chemistry, Vol. 79, No. 5, 2010, pp. 583-593. doi:10.1016/j.radphyschem.2009.12.015