Open Journal of Geology
Vol.09 No.05(2019), Article ID:92324,12 pages
10.4236/ojg.2019.95017
Interlayer Prediction Method for Braid River Reservoirs in Offshore Oil Field
Wei Wang*, Peng Meng, Jie Tan, Dongdong Yang, Dong Zhang
Bohai Oilfield Research Institute of CNOOC Ltd.—Tianjin Branch, Tianjin, China

Copyright © 2019 by author(s) and Scientific Research Publishing Inc.
This work is licensed under the Creative Commons Attribution International License (CC BY 4.0).
http://creativecommons.org/licenses/by/4.0/


Received: April 2, 2019; Accepted: May 7, 2019; Published: May 10, 2019
ABSTRACT
The interlayer structure of braid river reservoirs is complex and the interwell prediction is difficult in offshore oil field. Taking CFD11-1 oilfield of NgⅢ sand as an example, based on layer contrasting, the interlayer is divided into muddy interlayer, clay boulder interlayer, and physical interlayer according to lithology. Under the guidance of sedimentary model, we use the geology statistical inversion method to predict the clay boulder interlayer, consistent with the dynamic characteristics of oil production which is used for the prior quality control. The results of this study can objectively reveal the characteristics of interlayer space distribution. Compared with the traditional multi-well comparison and stochastic simulation model, this method is applied to the offshore oil field which is character with wide well space, sparse well network, which has very high application value in predicting the interlayer and deploying of inter-well encryption in the similar oilfield.
Keywords:
Braid River, Clay Boulder Interlayer, Inter-Well Predicting, Geology Statistical Inversion

1. Introduction
The braided river reservoir is one of the most important reservoir types in clastic rock reservoir. Its sedimentary types are various. Miall classifies braided river into gravel and sandy according to the different sediments [1] . Among them, sandy Braided River reservoirs are usually characterized by high porosity and permeability, and often become high-quality reservoirs. Many different types of interbeds are often developed in sandy braided river reservoirs, and their shapes, stages and spatial distribution are different. With the oilfield with sandy braided river reservoir as the main production layer entering the later stage of development, it is particularly urgent to study the control effect of interlayer in sand body on the distribution of remaining oil [2] [3] [4] [5] [6] . For the development of such oilfields, the description and prediction of interlayer is the key content of the fine description of reservoir in the later stage of development. To formulate the later stage development plan, guide the study of tapping potential of remaining oil and adjusting wells. It is of great significance.
Researchers at home and abroad mostly focus on using dense well pattern to dissect the core beach configuration [7] [8] or to explore its sedimentary model [9] - [14] . The related research is limited to studying the characteristics of interlayer distribution [15] [16] [17] , density and drilling rate through modern sedimentation, outcrop and well data, or using numerical simulation, physical simulation and other means to analyze interlayer residual. The controlling role of residual oil distribution [18] [19] [20] , or the study of interlayer by stochastic simulation based on core, mud logging and logging data [21] [22] [23] [24] , mainly focuses on qualitative research of interlayer distribution pattern and scale, and lacks quantitative research on sandy braided river interlayer. Especially for offshore oilfields with a sparse well pattern, large well spacing and well spacing beyond the width of interbeds [25] [26] , how to quantitatively characterize the distribution pattern and mechanism of interbeds between wells in sandy Braided River reservoirs have not been studied in depth. Due to the limitation of seismic frequency band, the vertical resolution of inversion results is low, and it is often difficult to identify the reservoir distribution with thicker thickness, and even more difficult to identify internal interbeds. The background of less drilling and penetration of oil wells in the offsea is geostatistical inversion method. Geostatistical inversion technology was introduced in China in the 1990s. This technology is a random acoustic impedance inversion method. By implementing the geostatistical inversion algorithm, multiple equal probability impedance can be generated. Compared with other methods, it synthesizes the advantages of seismic inversion and reservoir stochastic modeling. Although this method has strong multi-solution, it is very effective in fine-scale interpolation of small well spacing, very close to deterministic modeling, and can improve the resolution of conventional inversion results, thus generating small-scale heterogeneity characterization of lithologic data volume, such as sandstone and mudstone interface, but for sparse reservoir. Well pattern, especially horizontal well pattern, has certain challenges. Many probabilistic models need to be further demonstrated. So it is seldom seen at home and abroad to study the internal interbeds of thick reservoirs by this research method. It is a good research direction to use a small number of blind well tests and dynamic information of horizontal wells. Taking the layered conglomerate intercalation in the braided river reservoir as an example, under the guidance of geological model, the conglomerate distribution is identified by using the inversion model algorithm of geostatistical and the blind well data for testing, avoiding the matching, interference and determination of influencing factors of model section, and expecting to achieve breakthrough knowledge.
After more than ten years of development, the comprehensive water cut of Caofeidian 11-1 oilfield in the Bohai Sea has reached more than 95%. Development practice has proved that in the late stage of high water cut, there are still rich in remaining oil areas in the interlayer development area. Therefore, the remaining oil potential tapping controlled by interlayer has become the main goal of oilfield development adjustment. However, the qualitative description of interlayer research is difficult to meet the needs of infilling adjustment in high water cut oilfield. Caofeidian 11-1 oilfield has abundant logging and mud logging data, good quality of three-dimensional seismic data, and good conditions for interlayer research. Taking the N1g III sandy braided river reservoir as an example, based on the analysis of the characteristics of different types of interlayer and their sedimentary mechanism, the relationship between interlayer lithology and geophysical elastic parameters is established [27] , supplemented by the sedimentary model. Geostatistical inversion method is expected to quantitatively characterize sandy braided river reservoir interbeds and provide effective guidance for comprehensive adjustment projects of oilfields. The novelty of this paper is to break through the limitation of resolution of conventional seismic data. Starting from a small number of drilling holes to reveal conglomerate interbeds, inversion algorithm is used to depict the distribution range of interbeds between wells with great difficulty. At present, there are few examples of using seismic data to depict interbeds in huge thick reservoirs at home and abroad. This study provides a good method for oilfields with similar reservoir structure.
2. Interlayer Correlation and Sedimentary Model
Guantao Formation is mainly braided river deposit, which is a set of clastic deposits formed in the early Neogene after long-term depositional discontinuity and denudation and leveling. In the early stage, the core beach facies overlapped with silt layers and silty sandwiches; in the late stage, the channel sediments gradually dominated, and the muddy interlayers, fine grains and interdam interlayers developed within the channel [21] [28] . The flooding muddy sediments only occurred locally; the interlayers of braided river thick sand layers were mainly divided into two types: one was floodplain between single sand bodies, and the other was retained intercalation at the bottom of the channel. Layer, both appear vertically. The other is silt-fall layer, mudstone between dams and trench filling. According to the early exploration wells, the detained interbeds at the bottom of the river show the characteristics of high GR, high resistance and high density along the logging curve. The most obvious sign is that the density curve shows a peak shape. As shown in Figure 1, at least a number of conglomerate interbeds have been developed longitudinally with different thicknesses. The conglomerate interbeds in the middle of the reservoir are the most obvious, showing mud gravel in the core and logging, and some igneous rocks. Block, sub-angular-sub-circular, poor sorting, shale cementation, and some calcareous cementation are serious. It is worth noting that the resistivity above the

Figure 1. Log curve and core picture in Ng.
conglomerate interlayer is obviously different from that below the conglomerate. The upper resistivity is mainly 2.1 - 4 ohms of low resistivity. The logging permeability averages 600 mD, and the lower resistivity is normal, and the logging permeability reaches 4000 mD. Because the drilling and drilling wells reveal that this set of conglomerate intercalation is relatively stable, the sedimentary mechanism of the conglomerate at the bottom of the river is analyzed from the lateral connection of the conglomerate at the plane formation of a layered rock layer, formed in the zone of no flowing water or relatively slow flowing water. It is speculated that the reason for the poor permeability of the conglomerate layer caused by the interception of some fine sediments from the infiltration flood and the fine-grained material at the top of the early deposition (Figure 2).
3. Physical Characteristics of Interbedded Rocks and Seismic Response Law
Petrophysics is a bridge between well logging reservoir characteristics and seismic elastic characteristics. In order to better identify interbeds and distinguish stable interbeds and upper physical interbeds, it is necessary to carry out petrophysical analysis for target interbeds. The Guantao Formation of Caofeidian 11-1 Oilfield is shallowly buried. The clay minerals are mainly illite and the sandstone is loose. The sandstone is high porosity and permeability. According to the longitudinal wave impedance curve of exploration wells, the high impedance response characteristics of stable mudstone-conglomerate interlayer can be clearly seen. The mudstone interlayer is Subhigh impedance response. The impedance of sandstone is low as a whole. The physical characteristics of different types of reservoirs and interlayers are obvious different.

Figure 2. Sedimentary mode of conglomerate in Ng formation.
Because there are more uncertainties in the distribution of underground interlayer, which are embodied in the thickness range and gradual change characteristics of interlayer. In order to make better spatial prediction of mud-gravel intercalation, before reservoir intercalation prediction, according to the following mud-gravel top structure model, theoretical geological model is designed, and convolution equation is forward modeled, and compared with actual drilling, typical seismic response characteristics of relatively stable mud-gravel intercalation in the region are demonstrated. The three forward models represent the stable distribution, gradual distribution and local distribution of 3M thick interbeds respectively. The forward results are compared with the actual drilling, so as to restore the real underground seismic response characteristics and provide more reasonable variation function parameters for later geostatistical inversion.
Model A (3 m thick mud-gravel intercalation): Forward modeling results show that the actual seismic reflection is weaker than forwarding modeling results, indicating that the thickness of mud-gravel intercalation is gradually changing in space (Figure 3).
Model B (Mud-gravel Interlayer with Gradual Thickness): Compared with model A, the correlation between forward seismic modeling of model B and actual seismic is obviously improved, but the local reflection is different, which indicates that the thickness of local sand body of model B has deviated from the actual formation (Figure 4).
Model C (global continuity, partial underdevelopment): The matching degree between forwarding earthquake and actual earthquake is good, which shows that the actual mud-gravel intercalation is relatively continuous, and has obvious shielding effect in oil and gas migration; but the serious migration erosion results in less retained mud-gravel and the seepage channel is formed in the undeveloped area of local mud-gravel. Therefore, model C is in line with the real underground situation. The following interlayer prediction based on geostatistical inversion is mainly based on the development model (Figure 5).

Figure 3. Positive results of a model A with stable thickness of clay boulder interlayer.

Figure 4. Positive results of clay boulder interlayer with gradual thickness change of model B.
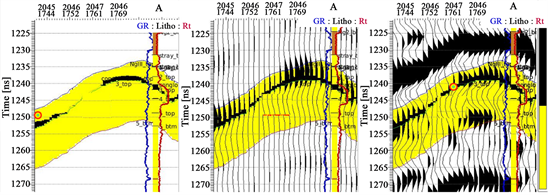
Figure 5. Positive results of stable clay boulder interlayer with local seepage in model C.
4. Interlayer Prediction by Geostatistical Inversion
In view of the large and dispersed well spacing of offshore oil and gas fields, the key of research work lies in the prediction of reservoir parameters between wells. Spatial prediction methods of geostatistical parameters mainly include stochastic simulation, target-based modeling, multi-point geostatistical modeling and, geostatistical inversion. Among them, geostatistical inversion technology has the highest utilization rate of seismic data and reservoir parameters. Forecasting is widely used and gradually becomes the mainstream technology solution.
In the process of geostatistical inversion, the sedimentary characteristics of sand bodies in the work area have a great influence on the final simulation results, such as the width and thickness of the river channel, and the length, width and thickness of the core beach dam, which directly determine the selection range of some parameters. Based on the analysis of sedimentary characteristics of Caofeidian 11-1 oilfield, parameters of various lithofacies scales are obtained, which can guide the simulation of geostatistical inversion.
4.1. Quantitative Empirical Formula of Braided River Mud-Gravel Intercalation
According to the logging data of the target formation wells that have been drilled, single well facies analysis is carried out to obtain the vertical thickness of the river channel and dam body scale. As offshore oil and gas fields, the well pattern is relatively sparse and the sample points are relatively small, the scale of the braided river reservoir is deduced with the help of predecessors understanding of the scale and empirical formula on the plane.
Scholars at home and abroad attach great importance to the quantitative study of the geometry and scale of braided river reservoirs, summarize a large number of empirical formulas, which have good correlation and have important guiding significance for quantitative characterization of the size of sandstone body in underground braided river core beach bar.
On the basis of Kelly, the quantitative formula of reservoir interbeds is optimized by measuring the thickness and plane attributes of the strata drilled at the well point to measure the channel scale:
Wb = 11.413hc1.41182, R2 = 0.91;
Lb = 4.9517Wb0.9676, R2 = 0.96;
Wc = 0.299Wb1.0125, R2 = 0.91;
Wb: Single beach width, hc Thickness of Xintan Dam;
Lb: Single beach length, Wc: Braided channel width.
According to the quantitative empirical formula, on the basis of traditional well-seismic information statistics, geological information is quantitatively integrated into the statistical engine, thus reducing the deviation of statistical characteristic parameters, especially statistical variogram function.
4.2. Sandwich Prediction
In this study, Markov chain-Monte Carlo inversion technique is used to predict interbeds, and some wells are used to participate in the calculation of blind well inspection. Firstly, according to the probability distribution statistics of the lithology and physical parameters on the well, the correct random sample distribution in statistical sense is obtained, and the global optimal solution is achieved by incremental adjustment similar to the optimization algorithm. Thus, the simulation results have the characteristics of making full use of the high predictability of earthquakes horizontally and the high resolution of wells vertically.
The sedimentary environment of Caofeidian 11-1 oilfield is analyzed, and the statistical inversion parameters and optimization process are defined. Firstly, according to the log interpretation results of drilling wells, the proportion of sand and mud is calculated. Because of the strong heterogeneity in the work area, the proportion of sand and mud should be considered as a whole. According to statistics, the proportion of sand and mud in the target formation is about 8.8:1, which serves as the basis for the proportion of sand and mud in the simulation results. Secondly, a reasonable variation function is selected to obtain the plane channel through the empirical formula of river facies summarized by predecessors. The size and direction of the dam body are taken as the basis of lag distance, long range, short range and vertical range of the variation function, and further adjustment is made on this basis to obtain the data search ellipsoid of the final variation function.
By establishing various probability density distribution functions to analyze the distribution characteristics of rock physical parameters of various lithologies, such as porous sand, non-reservoir and P-wave impedance, P-S wave velocity ratio, density statistical characteristics, etc., the probability distribution functions of actual logging data are used to constrain the distribution patterns of P-wave impedance attributes of different lithologies for seismic solution, and more wells are added gradually. Material is optimized and the final reasonable probability density function is determined by repeated upstream and downward floating tests.
The signal-to-noise ratio of pre-stack deterministic inversion of P-wave impedance for seismic data in the statistical work area is used to optimize the parameter selection in the inversion process. The signal-to-noise ratio of post-stack deterministic inversion of P-wave impedance is 14 dB, so the signal-to-noise ratio resolution of this statistical inversion is 14 HZ. In addition, in the process of statistical prediction research, the prediction results of different signal-to-noise ratios can be compared comprehensively, so that the parameters of signal-to-noise ratio can be selected for optimization, so that the inversion results not only follow the law of lateral variation of seismic, but also match the vertical law of wells.
4.3. Geostatistical Inversion for Predicting Interlayer Results
Figure 6 is based on the plane distribution of stable mud-conglomerate strata inverted by statistics from three evaluation wells. It is obvious that the seemingly layered mud-conglomerate is relatively stable. Its stability and scale are consistent with the origin of this set of interbeds mentioned above. The remaining five blind wells are consistent with the characterization results. From the production performance of horizontal wells above stable conglomerate interbeds, nine wells are obviously affected by stable mud-conglomerate interbeds. Water rises slowly. Water cut of three wells rises to 90% after three months of operation. The coincidence rate between dynamic response and seismic prediction is 75%. This shows that the prediction results are relatively stable and reliable.
5. Effect Application
Geostatistics includes a variety of statistical algorithms and random models. By combining seismic data with logging data and using data interpolation, the geostatistical inversion technology using Markov chain-Monte Carlo algorithm

Figure 6. The distribution map of stable clay boulder interlayer.
has been well applied in practice. Previously, it was considered that the conglomerate interbeds in this oilfield are very stable and similar to the interbeds. This time, the distribution range of the interbeds is very wide. Good characterization, a good characterization of the heterogeneity of the oil field, and in the horizontal well development practice has been a very good application. The result of this characterization has achieved very good results in the comprehensive adjustment project. Because the physical properties of interbeds in the first and second layers present scattered distribution characteristics, the spatial distribution characteristics of interbeds are complicated. In the area with high degree of superimposition of stable mudstone and conglomerate, the bottom water flows around the lower part of interbeds [29] , and the horizontal wells in the first layer are in the long-term low aquifer facies. For the characteristics of low fluid volume, 10 adjustment wells are deployed between wells, and the average cumulative production of single well is over 100,000 square meters through three years of “thin water and long flow”. The water cut of individual wells such as L4 well reaches 90% after putting into production, which reflects the correctness of this description dynamically. Under the barrier of stable interbeds, the remaining oil in three small layers develops, and seven horizontal production wells are deployed boldly under the conglomerate interbeds. Alternate production is formed vertically. Although water cut rises rapidly, the cumulative production has reached 150,000 square meters in the short period of nearly three years by “driving oil production with large liquid volume” (Figure 7).

Figure 7. Fusion Map of Stabilized Conglomerate Thickness Interpolated by Well Point and Conglomerate Range Characterized by seismic.
6. Conclusion
Aiming at the disadvantage of large well spacing and sparse well pattern in offshore oilfields, the interlayer of sandy braided river reservoir was characterized by means of geostatistical inversion. Compared with traditional geostatistical inversion, which mainly uses seismic data and well points to calculate characteristic parameters, this method breaks through the limitations of well pattern density and sample size. Starting from core identification and genetic analysis, and based on quantitative empirical formulas established by a large number of satellite maps, preliminary analysis of the scale of braided river reservoir interbeds in this area is made to optimize statistical parameters for offshore sparse well pattern oil and gas fields. A new idea is provided, which has high application value for interlayer prediction and infill well location deployment in similar oilfields.
Conflicts of Interest
The authors declare no conflicts of interest regarding the publication of this paper.
Cite this paper
Wang, W., Meng, P., Tan, J., Yang, D.D. and Zhang, D. (2019) Interlayer Prediction Method for Braid River Reservoirs in Offshore Oil Field. Open Journal of Geology, 9, 245-256. https://doi.org/10.4236/ojg.2019.95017
References
- 1. Miall, A.D. (1985) Architectural Elements Analysis: A New Method of Facies Analysis Applied to Fluvial Eposits. Earth Science Review, 22, 261-308. https://doi.org/10.1016/0012-8252(85)90001-7
- 2. Yu, X. (2008) A Review of Development Course and Prospect of Petroleum Reservoir Characterization and Stochastic Modeling. Earth Science Frontiers, 15, 1-15.
- 3. Bai, Z., Xing, F. and Li, H. (2012) Sedimentary Features of Fluvial-Dominated Delta in the Kepingtage Fm in Keping Outcrop Area and Their Significance for Petroleum Exploration. Oil and Gas Geology, 33, 217-224.
- 4. Wu, S., Ji, Y., Yue, D., et al. (2013) Discussion on Hierarchical Scheme of Architectural Units in Clastic Deposits. Geological Journal of China Universities, 19, 12-22.
- 5. Feng, C., Bao, Z., Shan, Q., et al. (2012) Single Sand Body Identification in Compound Distributary Channel of Delta Plain: A Case Study from the Fourth Member of Quantou Formation in the Southern Part of Central Fuyu Oilfield. Oil and Gas Geology, 33, 77-83.
- 6. Zeng, X. (2010) Application of Reservoir Structure Research in the Fine Exploitation of Oilfields. Petroleum Exploration and Development, 37, 483-489.
- 7. Liu, Y., Hou, J., Wang, L., et al. (2009) Architecture Analysis of Braided River Reservoir. Journal of China University of Petroleum (Edition of Natural Science), 33, 7-10.
- 8. Liu, Y., Hou, J., Song, B., et al. (2011) Characterization of Interlayers within Braided-River Thick Sandstones: A Case Study on the Lamadian Oilfield in Daqing. Acta Petrolei Sinica, 32, 836-840.
- 9. Liao, B., Zhang, W., Li, L., et al. (1998) Study on Modern Deposit of a Braided Stream and Facies Model: Taking the Yongding River as an Example. Acta Sedimentologica Sinica, 16, 34-38.
- 10. Liu, B., Zhao, H., Li, G., et al. (2002) Reservoir Identification of Sandy Braided River: Taking PI2 Zone, Maladian-Saertu Oilfield in Daqing as an Example. Acta Petrolei Sinica, 23, 43-46.
- 11. He, S., Lan, C. and Men, C. (2005) New Braided River Model in Sulige Gas Field of Ordos Basin. Acta Petrolei Sinica, 26, 26-29.
- 12. Shu, Q. (2006) Interlayer Characterization of Fluvial Reservoir in Guantao Formation of Gudao Oilfield. Acta Petrolei Sinica, 27, 100-103.
- 13. Li, D., Jiang, Z. and Li, J. (2003) Sedimentary Study of Braided River Delta in Guantao Formation, East Jiyang. Journal of the University of Petroleum, China (Edition of Natural Science), 27, 10-14.
- 14. Ren, H., Liu, J., Yang, S., et al. (2008) Sandstone Reservoir Microscopic Characteristics of Braiddelta of Hongtai Area in Tuha Basin. Journal of China University of Petroleum (Edition of Natural Science), 32, 12-15.
- 15. Yu, X., Ma, X., Mu, L., et al. (2004) Reservoir Geology Model and Analysis of Hierarchy Surface. Petroleum Industry Press, Beijing.
- 16. Lynds, R. and Hajek, E. (2006) Conceptual Model for Predicting Mudstone Dimensions in Sandy Braided River Reservoirs. AAPG Bulletin, 90, 1273-1288. https://doi.org/10.1306/03080605051
- 17. Zhang, C., Yin, T., Zhang, S., et al. (2004) Hierarchy Analysis of Mudstone Barriers in Shuanghe Oilfield. Acta Petrolei Sinica, 25, 48-52.
- 18. Wang, G., Yang, S., Liao, F., et al. (2009) Hierarchical Structure of Barrier Beds and Interbeds in Braided River Reservoirs. Natural Gas Geoscience, 20, 378-383.
- 19. Li, S., Song, X., Jiang, Y., et al. (2011) Architecture and Remaining Oil Distribution of the Sandy Braided River Reservoir in the Gaoshangpu Oilfield. Petroleum Exploration and Development, 38, 474-482.
- 20. Chen, B., Yu, X., Wang, T., et al. (2014) Sedimentary Response to Interaction between Alongslope and Downslope Currents in Daihai Lake, North China. Earth Science—Journal of China University of Geosciences, 39, 399-410.
- 21. Sun, T., Mu, L. and Zhao, G. (2014) Classification and Characterization of Barrier-Intercalation in Sandy Braided River Reservoirs: Taking Hegli Oilfield of Muglad Basin in Sudan as an Example. Petroleum Exploration and Development, 41, 112-120. https://doi.org/10.1016/S1876-3804(14)60015-X
- 22. Liu, Y., Hou, J. and Song, B. (2011) Characterization of Interlayers within Braided-River Thick Sandstones. Acta Petrolei Sinica, 32, 836-840.
- 23. Lin, C., Hou, L. and Dong, C. (1997) Geostatistics Applied to the Identification of Interbeds, with Sha-3 Member of Western Liaohe Depression Taken as an Example. Petroleum Geology Experiment, 19, 245-251.
- 24. Bai, Z. (2010) Study on the 3D Architecture Geological Modeling of Braided Fluvial Sand-Body. Journal of Southwest Petroleum University: Science and Technology Edition, 32, 21-24.
- 25. Dang, S., Feng, X. and Yan, J. (2015) Interlayer Research Application in Horizontal Well Development of Thick Bottom Water Reservoir—A Case of Massive Sand in Caofeidian 11-6 Oilfield. Petroleum Geology and Recovery Efficiency, 22, 63-67.
- 26. Liu, C., Zhao, C. and Liao, X. (2014) A Refined Anatomy of the Internal Structure of Meandering River Reservoirs under Large Well Spacing in Offshore Oilfields and Its Application. China Offshore Oil and Gas, 26, 58-64.
- 27. Chong, R. and Liu, J. (2003) Application of a Facies-Controlled Reservoir Modeling Method Based on Seismic Inversion Data in BZ25-1 Oilfield. China Offshore Oil and Gas, 17, 307-311.
- 28. Wang, R. (2016) Identification and Distribution Characteristics of the Internal Interbeds in the Thick Sandbodies of the Braided River. Petroleum Geology and Oilfield Development in Daqing, 35, 83-87.
- 29. Xue, Y., Liang, W. and Geng, C. (2011) Control Effect of Inter-Layers on the Migration of Oil and Water in Bottom-Water Reservoirs. Journal of Xi’an Shiyou University: Natural Science Edition, 26, 14-17.