Open Journal of Geology
Vol.3 No.5(2013), Article ID:36618,9 pages DOI:10.4236/ojg.2013.35038
Delineation of Lineaments in South Cameroon (Central Africa) Using Gravity Data
1Department of Physics, Advanced Teacher Training College, The University of Yaounde I, Yaounde, Cameroon
2Department of Physics, Faculty of Science, The University of Yaounde I, Yaounde, Cameroon
3Industrial Engineering Faculty, University of Douala, Douala, Cameroon
4School of Geosciences, University of Witwatersrand, Witwatersrand, South Africa
Email: *mlasseowona@yahoo.fr
Copyright © 2013 Owona Angue Marie Louise Clotilde et al. This is an open access article distributed under the Creative Commons Attribution License, which permits unrestricted use, distribution, and reproduction in any medium, provided the original work is properly cited.
Received June 25, 2013; revised July 25, 2013; accepted August 25, 2013
Keywords: South Cameroon; Bouguer anomaly; Upward continuation; Horizontal gradient; Euler deconvolution; Lineament
ABSTRACT
Gravity method is among the most applied geophysical methods in mineral and oil exploration. It may help to identify fault networks which are of interest for mineral exploration. Potential field data can give valuable information on the location of faults in the basement. These faults may have propagated into the overlying sedimentary rocks and influenced fluid flow and distribution of hydrocarbon traps and mineralization zones. A study was therefore conducted in south Cameroon with the aim of highlighting the different lineaments of the region, which were completely or partially hidden by the sedimentary cover. Different gravity data processing techniques including horizontal gradient coupled with upward continuation and Euler deconvolution were used. The application of these methods has mapped out a number of lineaments depicting gravity density discontinuities whose directions are NS, NE-SW, EW and NW-SE. The predominant direction for major lineaments is NE-SW. The major lineaments associated to the faults are: the KribiEdea faults, Ambam faults, Ebolowa-south of Yaounde faults; Bipindi-Yaounde faults; Pouma-Yaounde fault and the fault system which crosses the east, north, west of Monatele city. Euler solutions indicate depths up to18 km for the roof of the faults. The main results worked out from this study provide with new elements that allow the improvement of the knowledge on the structure of the study area. The structural map obtained shows major tectonic events that are responsible of the structural layout of the study zone. In addition, information related to the dip and depth of the various structures was also obtained. The map of lineaments is a useful tool for the planning of hydrogeological and/or petroleum investigations.
1. Introduction
The area under study belongs to the transition zone between the northwestern edge of the Congo Craton (CC) and the Oubanguides belt (Figure 1). Tectonic activities still affect the area where several earthquakes of moderate magnitudes, from 3.4 to 5.7 on the Richter scale have recently been reported [1-3] (Figure 2). These earthquake activities indicate that the region could be subjected to some seismic risk. On the other hand, the zone is marked by a continent to continent type of collision involving compression and extension movements giving rise to major faults. These imply that the Kribi-Campo Fault
(KCF) running across the study area could also be active. The KCF trends almost in a north-south direction and may correspond to the northwestern margin of the CC [4]. These arguments are important and give motivation for further detailed investigations of the area.
Previous studies have been conducted in the area. These included works by [4-8] and many unreported studies by oil companies. The results from the above investigations mainly reveal a crust that is thickening eastwards from the coast region (Kribi-Campo where crustal thickness is estimated to about 25 km) towards Congo Craton (about 45 km crustal thickness). In addition[7], results from the high shear wave velocity ob-
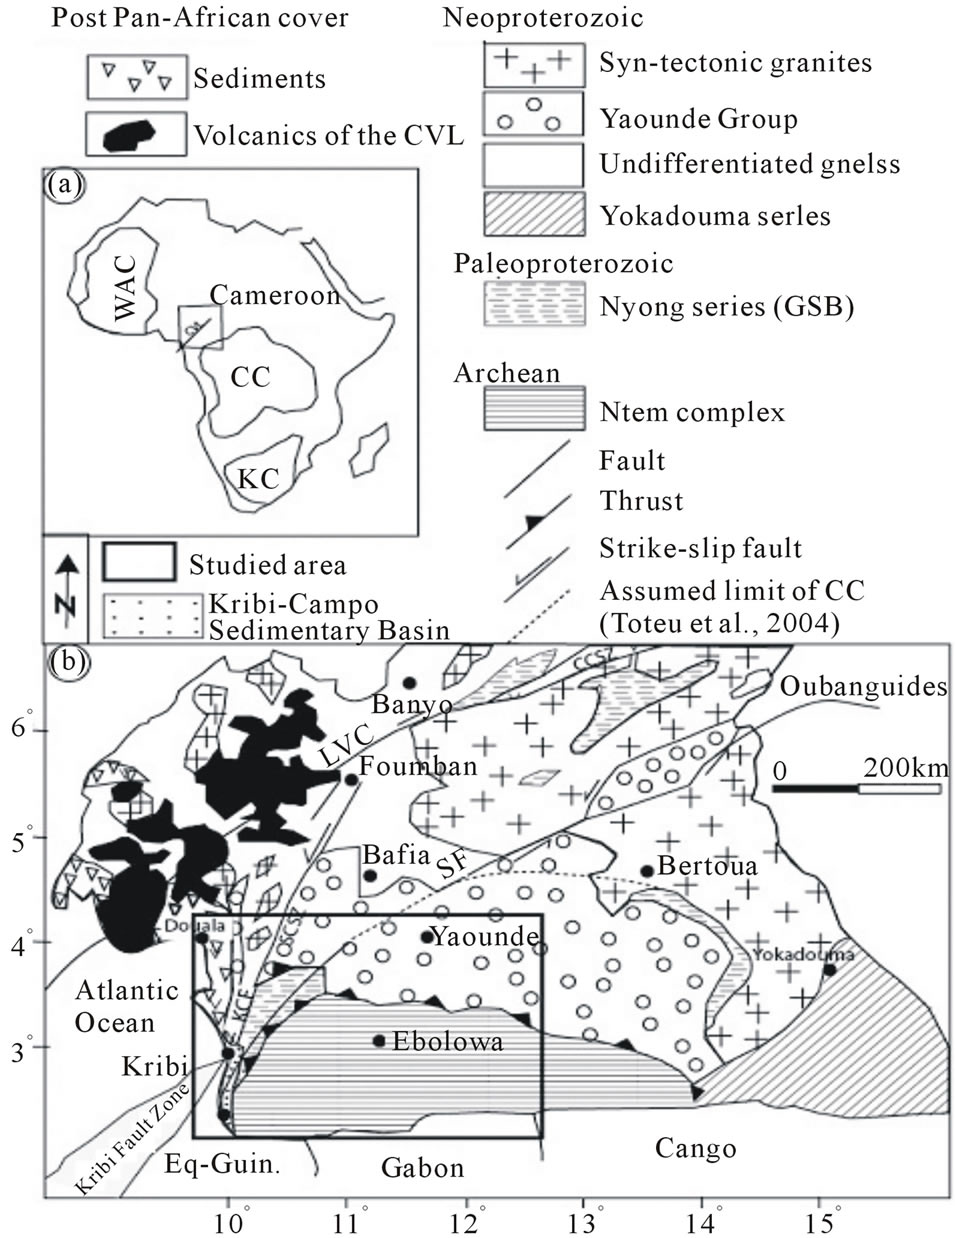
Figure 1. (a) Map showing the principal tectonic units of Africa and the location of Cameroon within the Pan-African North Equatorial Fold Belt. (b) Geological map of the southern part of the Pan-African North Equatorial Fold Belt in Cameroon (modified from [21,22]. WAC = West African Craton; CC = Congo Craton; KC = Kalahari craton; CVL = Cameroon Volcanic Line; CCSZ = Central Cameroon Shear Zone; SCSZ = Southwest Cameroon Shear Zone; SF = Sanaga Fault. (Modified after [3])
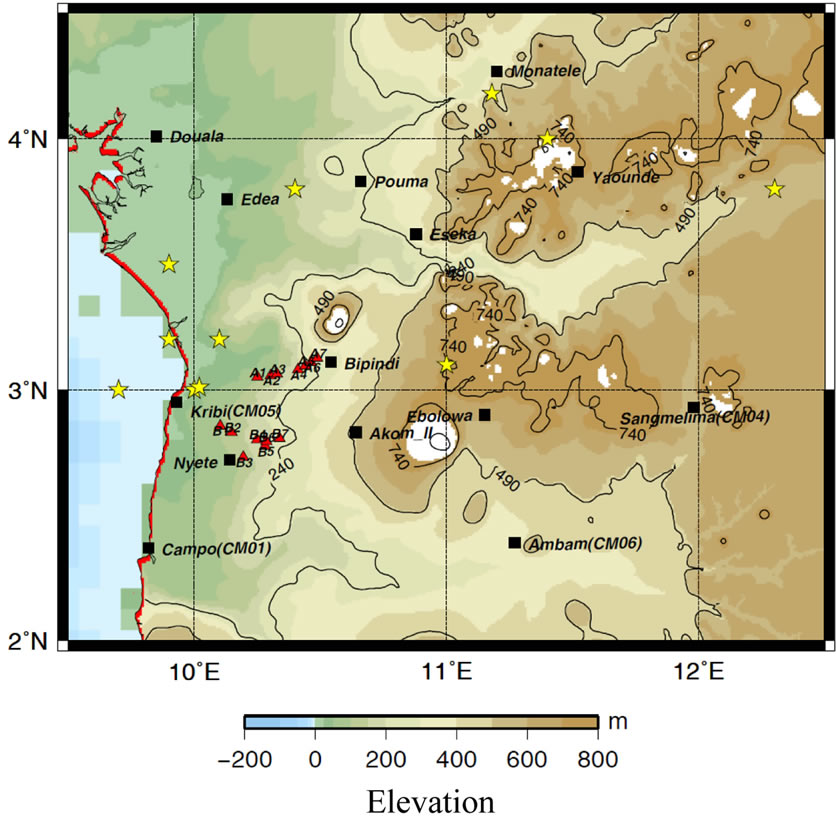
Figure 2. Topographic map of the study area showing epicentres of some recent earthquakes that occurred in the region (yellow stars). Red triangles show the MT stations used in [9].
served on their crustal models, have suggested that the lower crust is mainly composed of mafic rocks.
Recently, our group has carried out a geophysical survey of the transition zone between the CC and the KribiCampo sedimentary basin [9]. In that study, we combined different sets of data including Magnetotellurics (MT) and seismic data, to constraint a 2D1/2 gravity model along an east-west profile crossing the Kribi-Campo and the Congo Craton regions. As a result, the 2D1/2 gravity model derived in that study provided new insights on the transition zone. This allows a better orientation of the KCF while its geometry has also been inferred. The model obtained provides a better understanding of the mechanism of deep-seated tectonic activity in the region, which is probably connected to the settings of the KribiCampo basin. In addition, the thrusting of the Panafrican Mobile Belt over the Congo-Craton, already invoked by many authors [10,11] has also been shown in our model.
Although results of all the works cited above provided useful information over the study area, none of them gave a precise cartography of the lineaments in the study area, which was the objective of the present study. The Bouguer anomaly map of the region has strong contrasts (gradients) that indicate discontinuities such as faults and flexures. In order to study these discontinuities, we have conducted an analysis based on the horizontal gradient coupled with upward continuation and Euler deconvolution. These approaches have been successfully used in detailed studies, such as in reference [12] and have led to delineation of the major geological structures and the mapping out of the different tectonic lineaments that affect the study area.
2. Geology and Tectonics
The basement of the study area is composed of Archaean rocks of the Ntem Complex [13] overlain by Paleoproterozoic rocks of the Nyong Unit [14]. Late Proterozoic rocks of the Oubanguides Belt occupy the northern part of the region [15]. The Archaean basement of the basin is composed mostly of greenstone belt rocks, charnockites and potassic granitoids [16]. Among the faults that cut the southern Cameroon region, the Sanaga fault, which intercepts the north-western geophysical boundary of the Congo Craton as defined by [4,17] has been interpreted by[18] as the continuation of the KCF. The KCF seems to be aligned with the offshore fault system known as Kribi Fracture Zone that had been inferred as the eastern end of the Ascension fracture Zone [19,20] (Figure 1).
3. Gravity Data
The gravity data used in this work are from different gravity campaigns conducted in Cameroon between 1963 and 1990 by national and international organizations and independent researchers [23,5,6]. They consist of 601 data points with irregular inter-station distances of the order of 4 to 5 km (Figure 3). The irregularities in the distribution of the gravity points are due to the difficulties in accessing the area, which belongs to the tropical rain forest. Variations of the gravity field were measured using the Worden gravimeters (N˚ 313, 600, 69 and 135) and the Lacoste & Romberg (model G, N˚ 471 and 828). These measurements were corrected for the effect of the luni-solar tidal and instrumental drift (assumed to be linear in time). Free-air and Bouguer reductions based on mean density of 2.67 g/cm3 were applied and the simple Bouguer anomalies have been derived.
The resulted Bouguer anomalies are the basic data used in this study context. Due to the difficulties in accessing data from the sea, they have not been included in this study. The simple Bouguer anomaly map (Figure 3) of the region was obtained after interpolation using a kriging gridding algorithm implemented in Oasis Montaj software. This interpolation was conducted along the X (longitude) and Y (latitude) axes following a step of 2.75 km. The maximum value of Bouguer anomaly in the grid is −92.76 mGals while the minimum value is −0.82 mGal. The mean value which is equal to −52.62 mGals is very near to the mean value of non interpolated Bouguer anomalies which is equal to −55.23 mGals.
4. Methods
The gravity method is a geophysical technique that measures differences in the earth’s gravitational field at specific locations. It is base on the fact that lateral density changes in the subsurface cause a change in the force of gravity at the surface. Gravity data are used to constrain
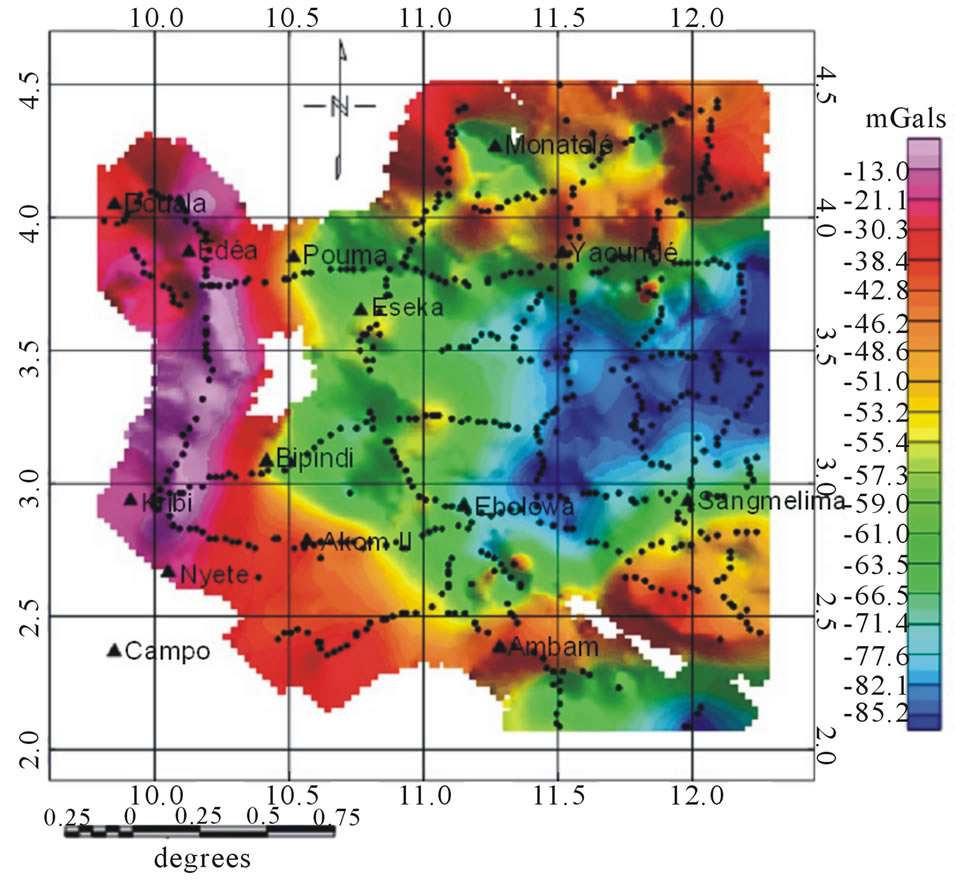
Figure 3. Bouguer anomaly map, black triangles indicate the localities and black round dots indicate gravity stations.
subsurface density variations which help to understand problems related to tectonics or commodity exploration. Station’s gravity must be corrected such that the values represent a perfect homogenous sphere, called a “geoïd”. If there are still differences in the readings after corrections are made, then they may truly represent a gravity anomaly. The gravity anomaly is the difference between observed gravity and some theoretical value of gravity predicted at the measurement point.
4.1. Horizontal Gradient and Upward Continuation
The application of the method that consists of coupling the horizontal gradient with upward continuation allows the location of discontinuities and determines their dip [24]. The gravity anomaly over a vertical contact is marked by a curve with a minimum on the side of the rocks of low density and a maximum on the side of the rocks of high density. The inflection point of the curve is located at the base of the contact. After calculating the horizontal gradient, this anomaly becomes a maximum and facilitates the mapping of the contact. In this study, we used a technique for automatically locating the maxima of the horizontal gradient based on the method of [25]. The application of this technique to a gravity map shows that the local maxima of the horizontal gradients form narrow lines above abrupt changes of density. To determine the direction of dip of the contacts highlighted, it is assumed that the more we upward continue the gravity data, the more we highlight deep structures. Therefore, the procedure consists in creating a series of analytical upward continuations of gravity data. Then, for each level, we compute the horizontal gradient and determine its maximum. If structures are vertical, all the maxima from the different levels overlap. In contrast, the displacement of these maxima, when the height of upward continuation increases, indicates the direction of dip. This approach is valid for two-dimensional structures corresponding to the line contacts which separate blocks of different densities. This method has been used to characterize some lineaments related to major tectonics in the study area. The horizontal gradients and maxima were calculated using the MAGMAP program.
4.2. Euler Deconvolution
The apparent depth to the gravity or magnetic source is derived from Euler’s homogeneity equation (Euler deconvolution).This process relates the gravity or magnetic field and its gradient components to the location of the source of an anomaly, with the degree of homogeneity expressed as a “structural index”. The structural index (SI) is a measure of the fall-off rate of the field with distance from the source. Euler’s homogeneity relationship for magnetic or gravity data can be written in the form [26]:
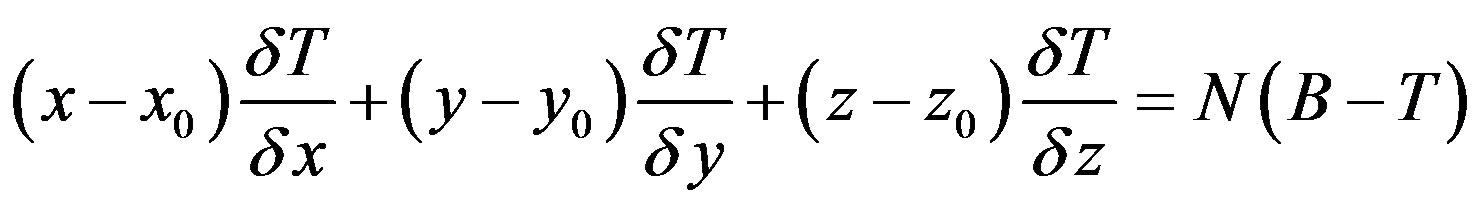
Where  is the position of the magnetic or gravity source whose total field (T) is detected at (x, y, z,). B is the regional gravity or magnetic field. N is the measure of the fall-off rate of the gravity field and may be interpreted as the structural index (SI). The Euler deconvolution process is applied to each solution. The method involves setting an appropriate SI value and using leastsquares inversion to solve the equation for an optimum x0, y0, z0 and B. A square window size which consists of the number of cells in the gridded dataset to be used in the inversion at each selected solution location must also be specified. The window is centered on each of the solution locations. All points in the window are used to solve Euler’s equation for solution depth, inversely weighted by distance from the centre of the window. The window should be large enough to include each solution anomaly of interest in the total field magnetic or gravity grid, but ideally not large enough to include any adjacent anomalies.
In geological terms, the Euler depths represent the structural and/or stratigraphic changes of various geological formations. In other words, they appear wherever there are lithologic discontinuities existing in the geological formations.
5. Results
5.1. Analysis and Interpretation of Gravity Data
The analysis of the Bouguer anomaly map (Figure 3) highlights the most prominent anomalies within the study area. A general observation of the map shows a structure apparently very complex, on which the directions of anomalies are variable. To facilitate the analysis of this map, it has been divided into several sectors correlating more or less with the topography and geology. We can distinguish two main areas of interest in connection with the two dominant geological formations:
The western part of the map is marked by a large area of positive anomaly, oriented almost north-south. The maximum anomaly (−5 mGals) rises south of Kribi to Edea with a slight extension to Douala. The linear form of this anomaly suggests that it marks the limit of a large structure to the left of the study area. Comparison with the topographic map shows that it corresponds to low altitudes, its position near the sea shows that the source of this anomaly consists of highly dense rocks. Correlation with surface geology shows that this vast area is the signature of Archean and Paleoproterozoic formations.
Part of the center of the map is characterized by a vast plateau of negative anomaly generally oriented east-west. Comparison with the topographic map shows that this plateau corresponds to high altitudes from 300 to 1300 m, which according to the principles of isostasy suggests that the source of this anomaly is of low density material. In general, Bouguer anomalies are usually negative in the continents because of isostasy. Isostasy describes the state of gravitational equilibrium between the earth’s lithosphere and asthenosphere such that the tectonic plates “float” at an elevation which depends on their thickness and density. This happens because the Earth’s continents are made of minerals that are less dense than those that are found deeper in the Earth’s crust. The continents are therefore floating. Isostasy follows Archimedes Principle, which states, “The decrease of weight of a body equals to the weight of liquid displaced by the part of the body under the liquid surface.”
The two areas of anomalies described above are separated by a network of high gradient curves of isoanomalies oriented north-south. This orientation coincides with that of the positive anomaly and the axis of the negative anomaly Bipindi-Pouma, suggesting that these structures would have a common geological history. The decrease in the value of the gradient from west to east shows a slip of structures of the East below the structures of the West. This gradient is interpreted as the western boundary of the Congo Craton and thus corresponds to a suture zone. The location of this suture can be confined to the vicinity of two outcrops of carbonates and alkaline rocks deformed as described by [27]. Alongside this strong gradient, we observe another less dense gradient of the iso-anomalies west of the Ebolowa-Yaoundé stretch. This gradient reveals another line of weakness whose signature is not clearly visible due to the influence of surrounding structures.
5.2. Horizontal Gradient and Maxima Map
The horizontal derivative of both the x and y directions have been computed from the simple Bouguer anomaly grid. The horizontal gradient magnitude (HGM) has been computed as the square root of the sum of both the horizontal derivatives. The results are then contoured as shown in Figure 4. This figure highlights areas of horizontal gradients with varied amplitudes and shapes and dominated by NNE-SSW direction. One can easily distinguished areas of gradients corresponding to structures of type contact/fault (area with strong gradient) and those corresponding to the presence of intrusive structures. The whole area is characterized by a strong gradient up to 2.3 mGal / km. This strong gradient suggests that the region has historically been subjected to numerous landslides.
Maxima map of the horizontal gradient of the Bouguer anomaly map upward continued to 4, 8, 12 and 16 km respectively (Figure 5) shows line contacts correspond-
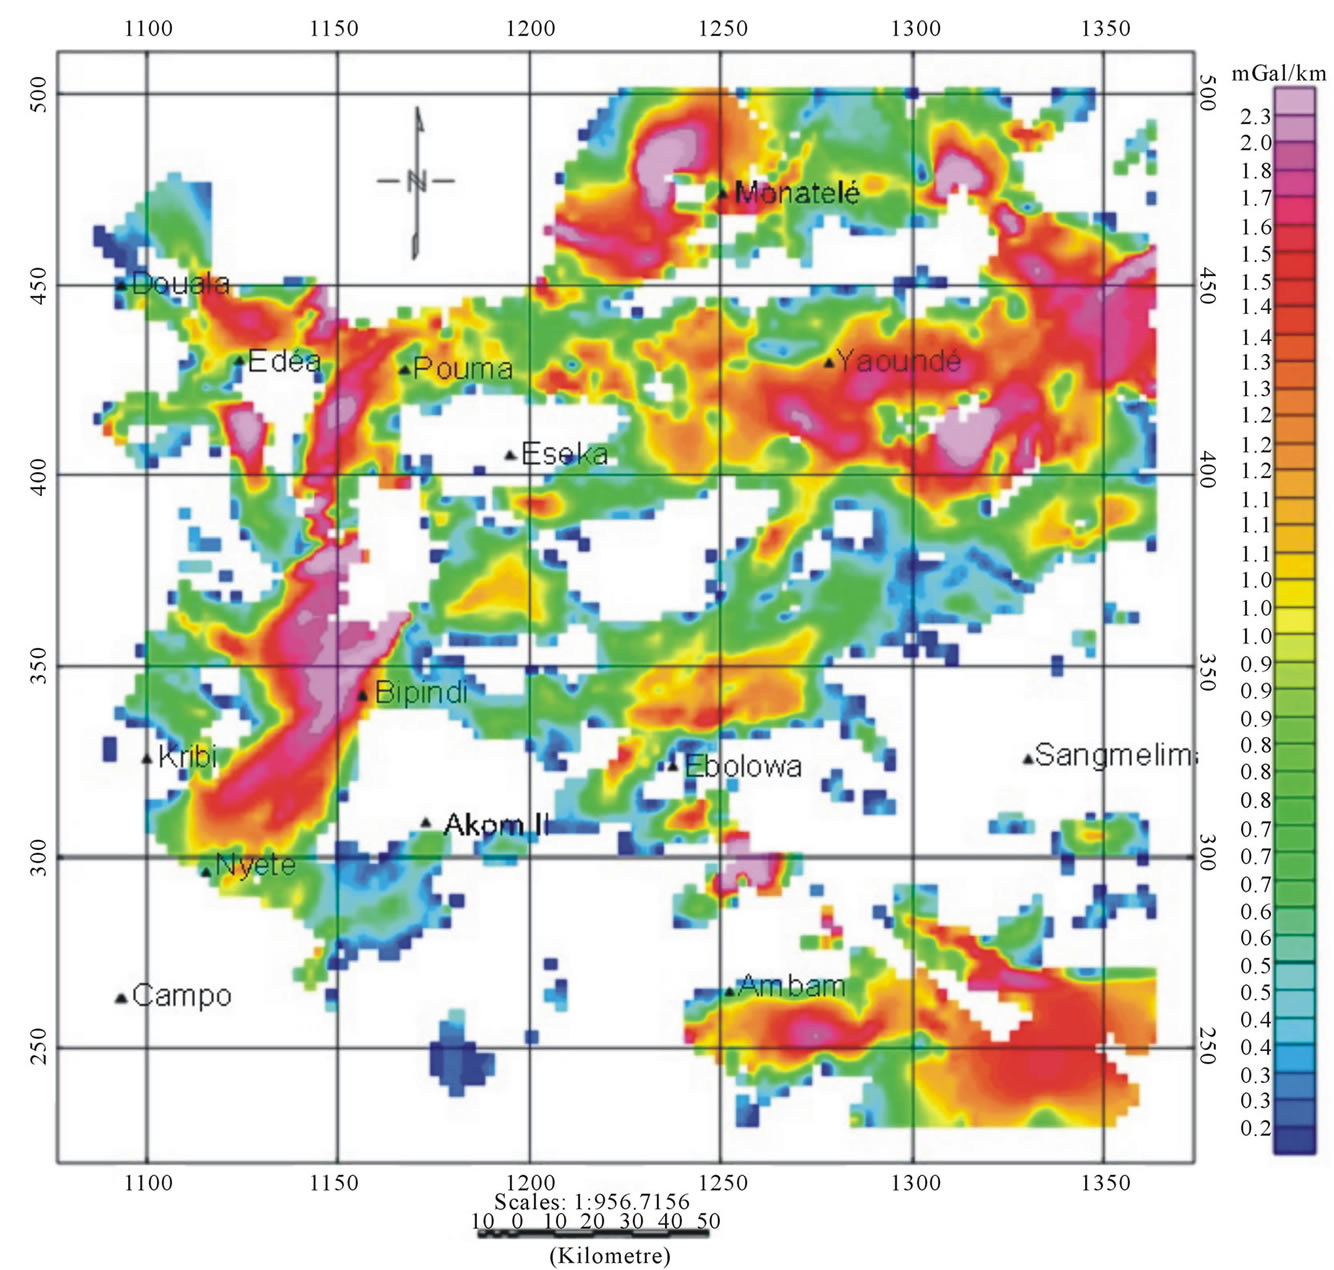
Figure 4. Horizontal gradient map of simple Bouguer anomalies.
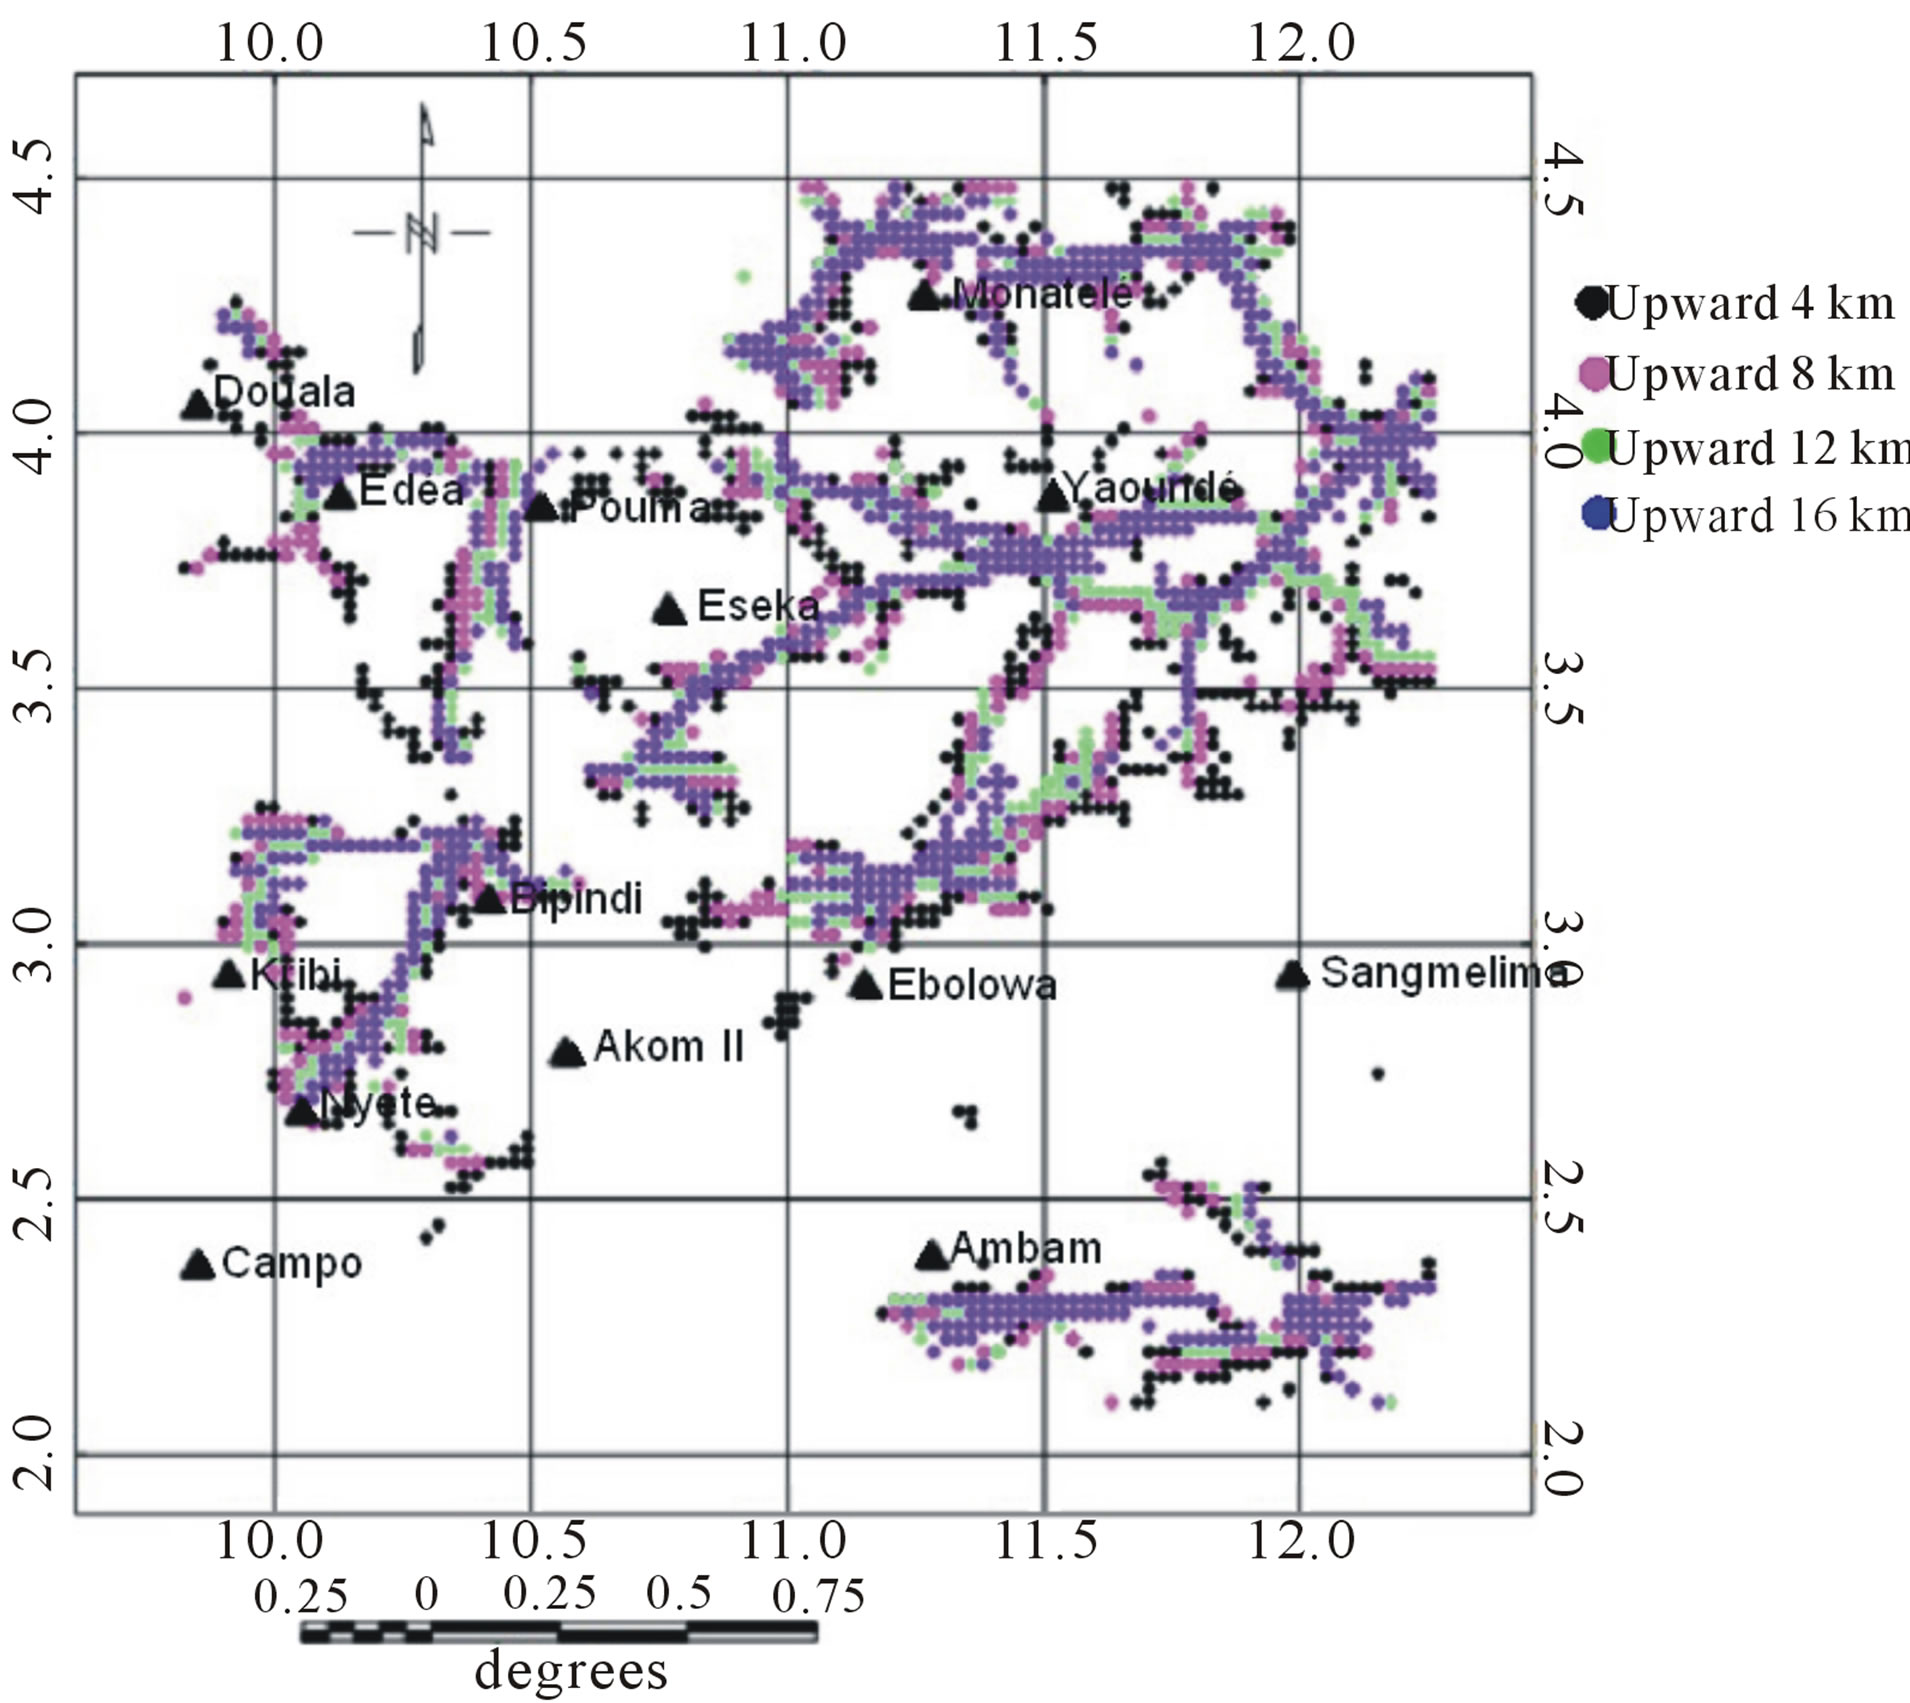
Figure 5. Maxima map of the horizontal gradient of the Bouguer anomaly map upward continued to 4, 8, 12 and 16 km respectively.
ing to lineaments. The degree of importance (in depth) of a lineament is determined by the continued presence of the local maxima for increasingly high altitudes of upward continuation. Analysis of maxima of the horizontal gradient of the Bouguer anomaly map upward continued to 4, 8, 12 and 16 km respectively shows precisely the orientation of the dip of each lineament. The study area is characterized by the lineaments with vertical dip except the network of lineaments of Ambam and Edea-Nyete which dip northeast and southeast respectively.
5.3. Depths from Euler Deconvolution
The Euler method has been applied to the Bouguer anomaly maps using a moving window of 20 km × 20 km. This was done on the study area using the standard Euler 3D method of the Geosoft package software. The system uses a least squares method to solve Euler’s equation simultaneously for each grid position within a window and then determines the anomaly position, depth, and base level for a specific gravity source. We have assigned several structural index values and found that for a structural index of N = 0.0, the extension of linear clustering of Euler solutions could be given as colour points (Figure 6). In addition, the Euler solution map reveals new deep contacts and clearly defines that the solution for depth ranges from 3 to 18 km. The depths of contacts in the area are not uniform suggesting that all lineaments do not have the same origin. These Euler depths seem to detect the edges of the geological formations as well as fractures or fault patterns.
5.4. Lineaments Map of the Studied Area
The results obtained with the processing of gravity anomalies confirm and specify the layout of brittle structures recognized by geological studies, and highlight new lineaments. Figure 7 illustrates the major boundaries between areas of high density contrast, which correspond to several unmapped lineaments. Lineaments on the horizontal gradient map upward continued to 4, 8, 12, and 16 km altitude superimposed on the Euler solution map correspond to major features affecting the study area. It appears from this study that most of these lineaments have a sub-vertical dip.
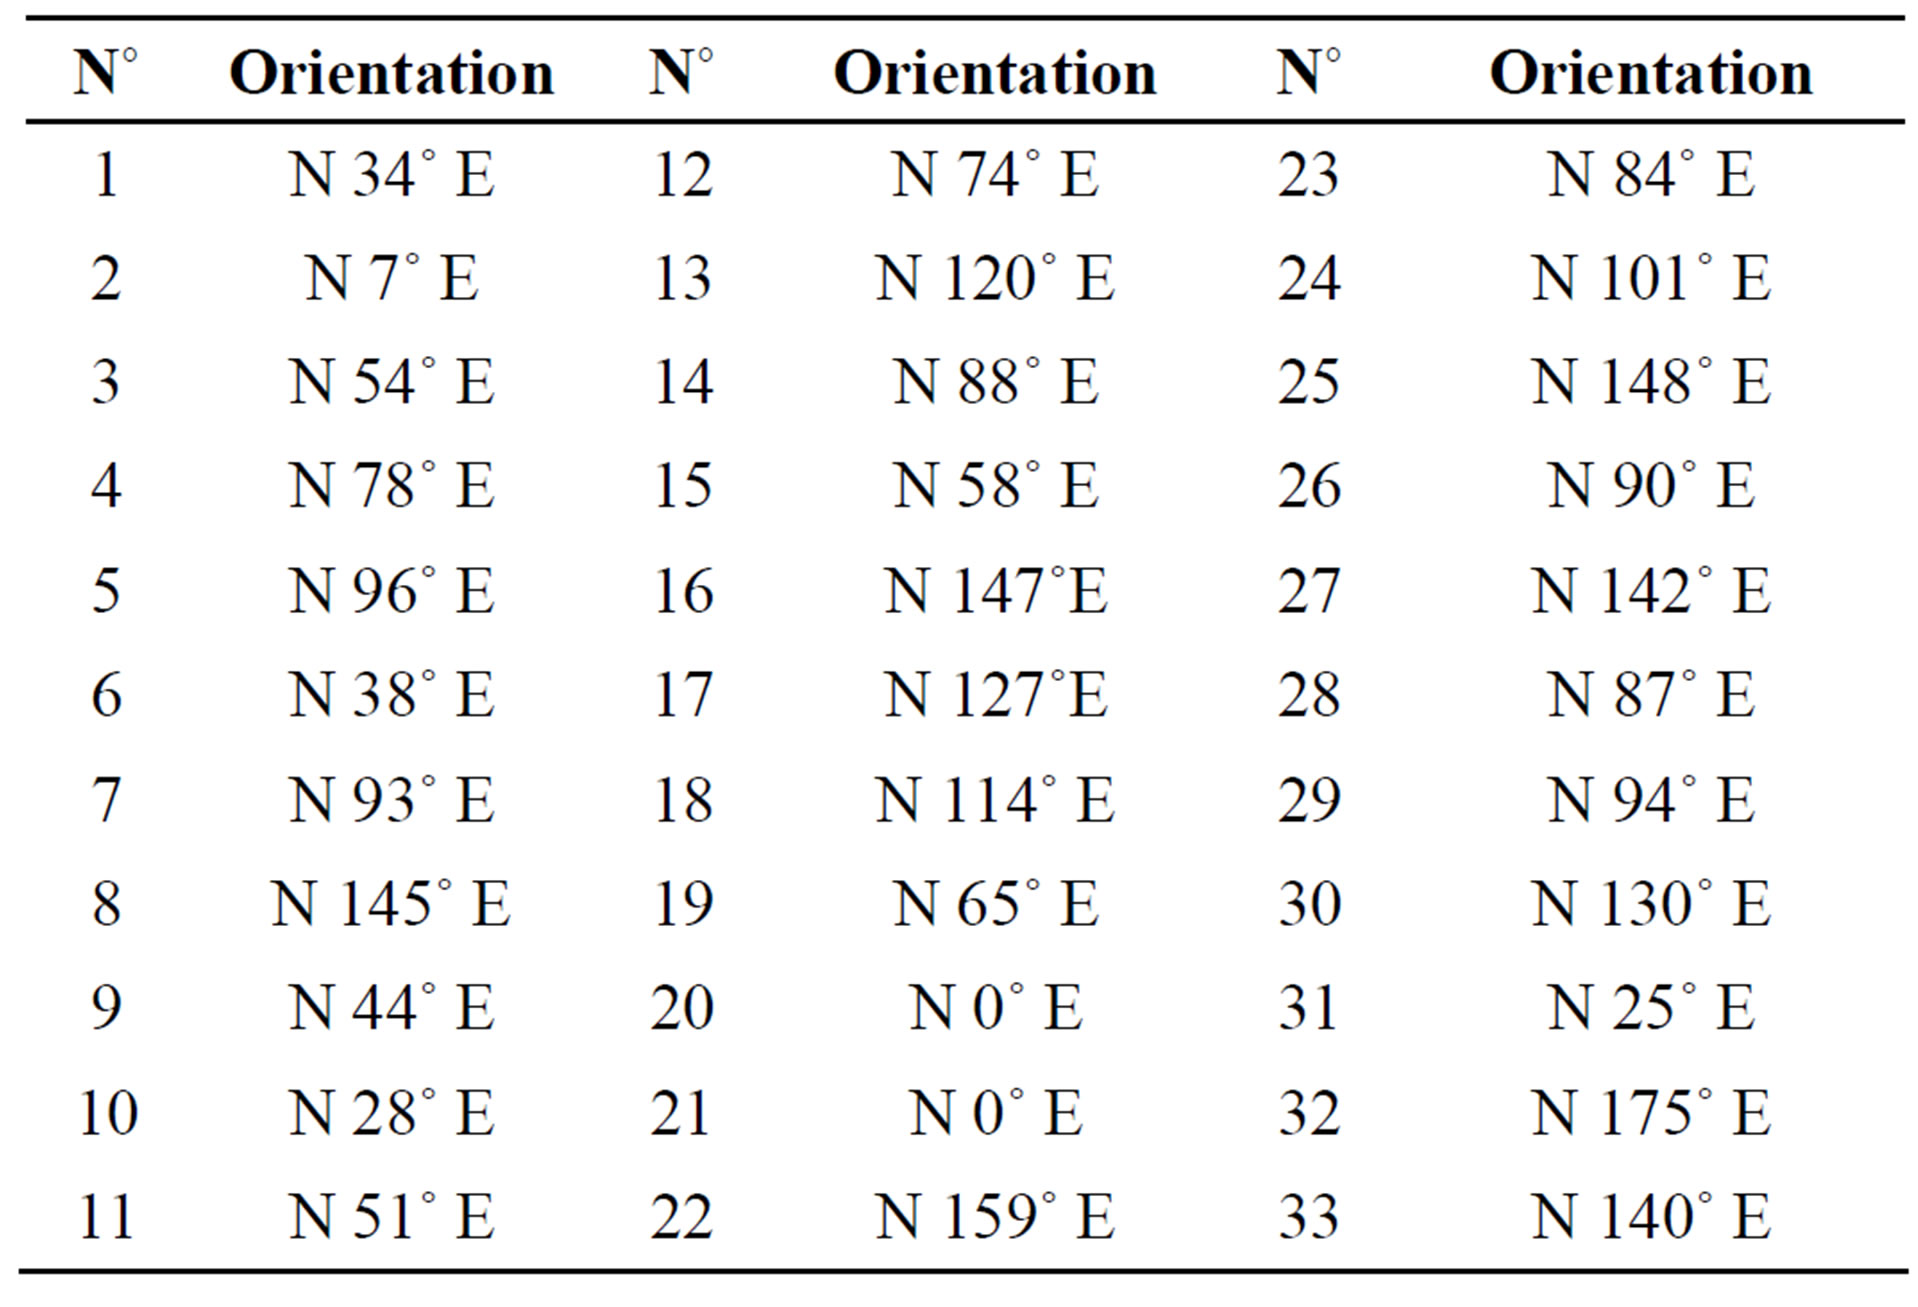
Table 1 gives the orientation of the different lineament segments shown in the structural map of the study area (Figure 8). The major trends obtained from the analysis (Figure 9) are the N0-10˚E, N45-50˚E, N85-95˚E and N120-150˚E trends. There is a tendency for certain faults to turn toward NE-SW and ENE-WSW directions with increasing depth and lateral spread. This correlates with the direction of subduction of the Ntem complex cratonic plate under the Pan-African mobile belt. These major lineaments associated to faults in this study characterize the definite stability of the Congo-Craton and could be
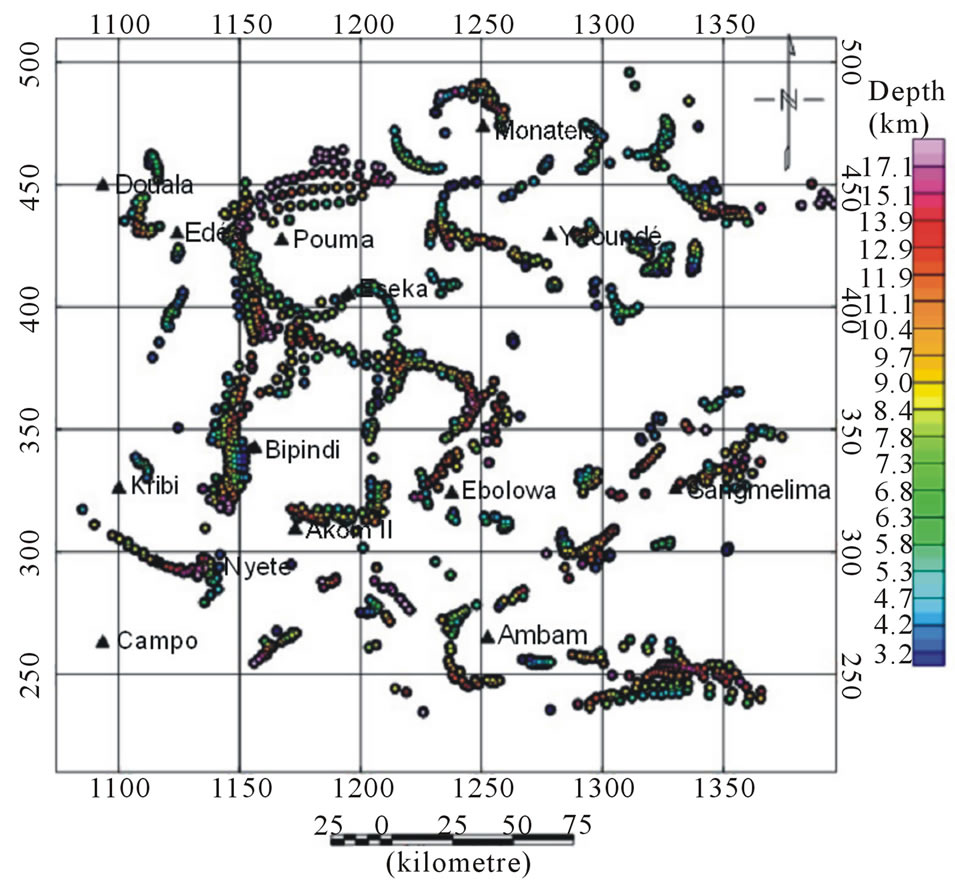
Figure 6. The Euler depths of the study area.
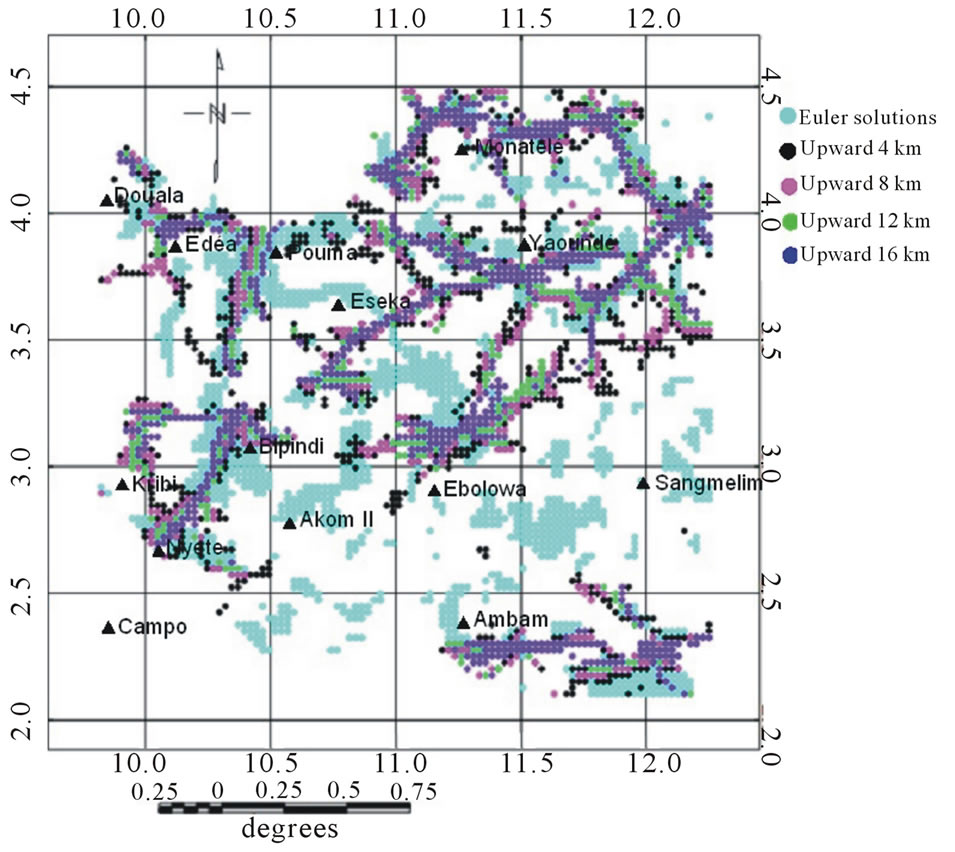
Figure 7. Estimated locations of contacts according to the horizontal gradient coupled with upward continuation method and Euler deconvolution method.
associated to the Eburnean orogeny. However, several faults inferred from Bouguer anomalies in the area turn to a NW-SE direction with depth and lateral spread, indicating a significant change in fault geometry. Rose diagrams shows in a precise way the principal direction of the lineaments in the region.
6. Discussion
This study area has in the past been the subject of many geophysical studies the most recent being those of [7,9]. Among the new results brought by these works are: 1) The discontinuities in the crust are essentially confined to the upper part of the crust down to 18 km. 2) Gravimetric lineaments suggest that the area has been subjected to an important regional field stress. The regional field stress associated with the predominant (Figure 9) trending of gravity lineaments is in agreement with Eburnean
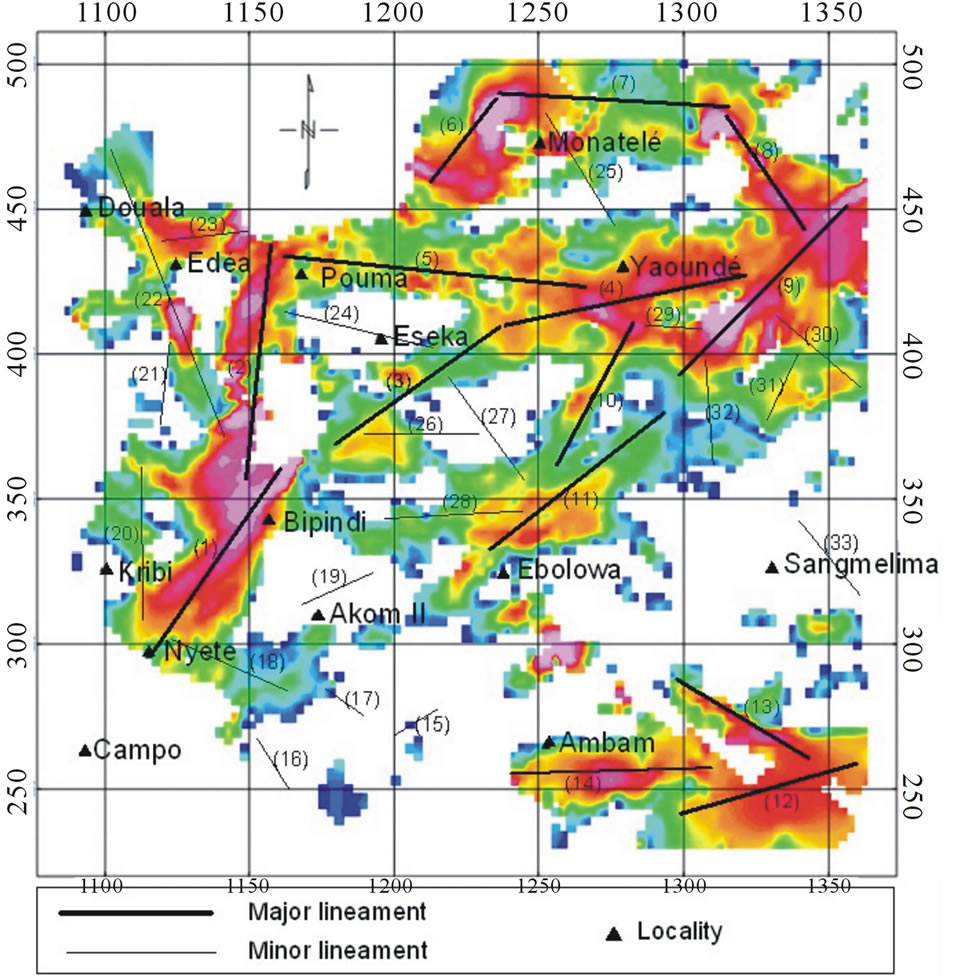
Figure 8. Gravity lineament map obtained for the study area superimposed on the horizontal gradient map.
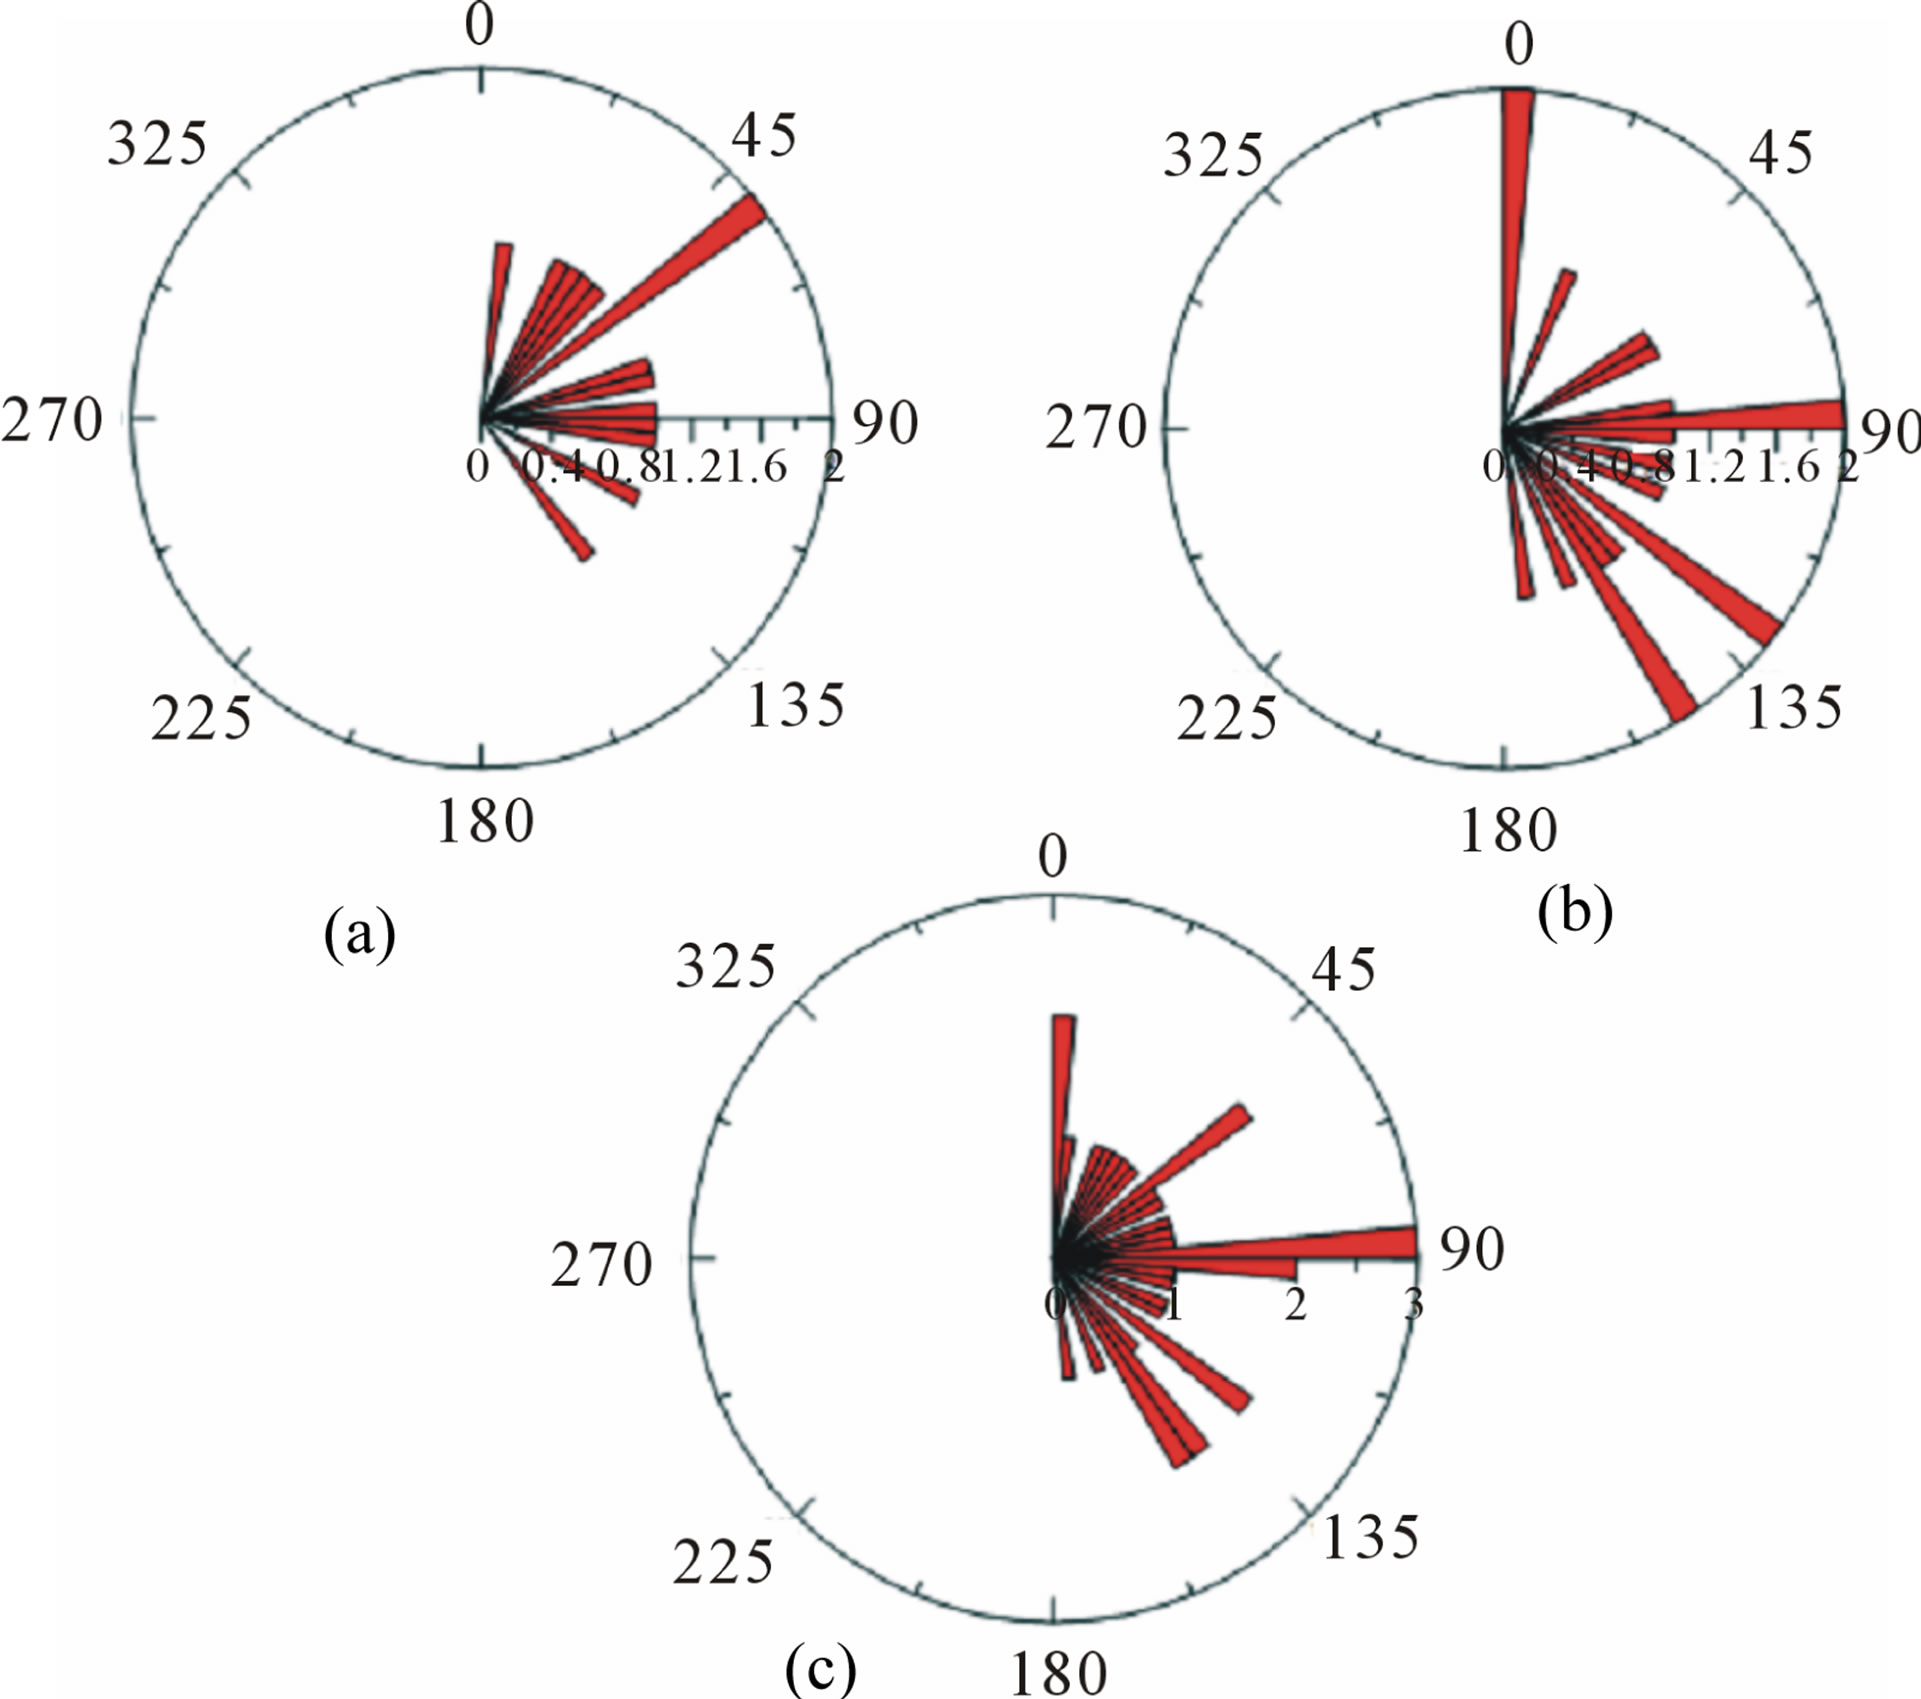
Figure 9. (a) Rose diagram of the major lineament orientations; (b) Rose diagram of the minor lineament orientations; (c) Rose diagram of the general lineament orientations of the study area.
orogeny trend [28] and would have played an essential role in the control of the geodynamic evolution of the region. This regional stress fields affected the Craton in southeast Cameroon and are responsible for the reorientation of the former structures [29]. The recent application of the multi-scale horizontal derivative of the vertical derivative method [30] on the gravity anomaly map over the Foumban Shear Zone (FSZ) revealed the presence of a fault oriented N68˚E and dipping southeast. According to these authors, this fault is hidden by volcanic formations, and is linked to the ENE-WSW trending fault called Central African Shear Zone (CASZ), a dextral shear zone that extends some 2000 km in west Cameroon to Sudan [31,32]. It appears that, the network of faults identified in the study area, with a major trend WSW-ENE to NE-SW is also connected to the CASZ.
7. Conclusion
The Bouguer anomaly map obtained in the present study enabled us to locate the geophysical signature of the two structures present in the study area. These two structures are separated on gravity maps by gradients essentially oriented north-south and correlating with the assumed Kribi-Campo fault. The superimposition of horizontal gradient maxima from the Bouguer anomaly and from its upward continuation at several heights up to 16 km by steps of 4 km shows alignments outlining the contacts and gives information on their dip. The analysis of contacts interpreted as lineaments shows five main trends: N0-10˚E, N45-50˚E, N85-95˚E, N125-130˚E and N140- 155˚E. Those interpreted as fault or major lineaments trend and those interpreted as minor lineaments show four trends: N0-10˚E, N85-95˚E, N125-130˚E and N140- 155˚E. Euler deconvolution was used to determine source depths and their location. Solutions are well grouped and correlate with various contacts previously inferred from horizontal gradient maxima. The interpretation of the lineament map derived from the analysis of Euler solutions and horizontal gradient coupled with the upward continuation could serve as a guide in the investigation and exploitation of thermo mineral sources and groundwater aquifers in the study area, facilitating the location of points favourable to their existence. These results could also serve as a guide in the identification of risk areas.
8. Acknowledgements
We greatly appreciate constructive and thoughtful comments of Prof. Lewis D. Ashwal of Wits University in South Africa and Prof. Jackson M. Barton of Parkview University in South Africa on this work.
REFERENCES
- B. Ateba, N. Ntepe, G. E. Ekodeck, D. Soba and J. D. Fairhead, “The Recent Earthquakes of South Cameroon and Their Possible Relationship with Main Geological Units of Central Africa,” Journal of African Earth Sciences, Vol. 14, No. 3, 1992, pp. 365-369. doi:10.1016/0899-5362(92)90040-J
- C. T. Tabod, J. D. Fairhead, G. W. Stuart, B. Ateb and N. Ntepe, “Seismicity of the Cameroon Volcanic Line 1982- 1990,” Tectonophysics, Vol. 212, No. 3-4, 1992, pp. 303- 320.
- N. Ntepe, F. T. Aka, R. U. Ubangoh, B. Ateba, J. M. Nnange and J. V. Hell, “The July 2002 Earthquake in the Kribi Region: Geological Context and a Preliminary Evaluation of Seismic Risk in Southwestern Cameroon,” Journal of African Earth Sciences, Vol. 40, No. 3-4, 2004, pp. 163-172. doi:10.1016/j.jafrearsci.2004.09.002
- J. M. Tadjou, R. Nouayou, J. Kamguia, H. L. Kande and E Manguelle-Dicoum, “Gravity Analysis of the Boundary between the Congo Craton and the Pan-African Belt of Cameroon,” Austrian Journal of Earth Sciences, Vol. 102, 2009, pp. 71-79.
- D. Y. H. Poudjom, J. M. Nnange, M. Diament, C. J. Ebinger and J. D. Fairhead, “Effective Elastic Thickness and Crustal Thickness Variation in West Central Africa Inferred from Gravity Data,” Journal of Geophysical Research, Vol. 100, No. B11, 1995, pp. 22047-22070. doi:10.1029/95JB01149
- J. M. Tadjou, E. Manguelle-Dicoum, S. Nguiya and J. Kamguia, “Caractéristiques des Anomalies Gravimétriques du Sous-Bassin Sédimentaire de Kribi-Campo (SudCameroun),” Africa Geoscience Review, Vol. 1-2, 2008, pp. 39-50.
- K. A. P. Tokam, C. T. Tabod, A. A. Nyblade, J. Julia, D. A. Wiens and M. Pasyanos, “Structure of the Crust Beneath Cameroon, West Africa, from the Joint Inversion of Rayleigh Wave Group Velocities and Receiver Functions Geophysical,” Geophysical Journal International, Vol. 1183, 2010, pp. 1061-1076. doi:10.1111/j.1365-246X.2010.04776.x
- M. J. Ntamack-Nida, S. Bourquin, J. C. Makong, F. Baudin, J. E. Mpesse, C. ItjokoNgouem, P. B .Komguem and G. M. Abolo “Sedimentology and Sequence Stratigraphy from Outcrops of the Kribi-Campo Sub-Basin: Lower Mundeck Formation (Lower Cretaceous, Southern Cameroon),” Journal of African Earth Science, Vol. 58, No. 1, 2010, pp. 1-18. doi:10.1016/j.jafrearsci.2010.01.004
- M. L. C. OwonaAngue, S. Nguiya, R. Nouayou, A. P. Tokam Kamga and E. Manguelle-Dicoum, “Geophysical Investigation of the Transition Zone between the Congo Craton and the Kribi-Campo Sedimentary Basin (SouthWest Cameroon),” South African Journal of Geology, Vol. 114, No. 2 ,2011, pp. 145-158. doi:10.2113/gssajg.114.2.145
- J. P. Nzenti, P. Barbey, J. Macaudiere and D. Soba, “Origin and Evolution of the Late Precambrian High-Grade Yaoundé Gneisses (Cameroon),” Precambrian Research, Vol. 38, No. 2, 1988, pp. 91-109. doi:10.1016/0301-9268(88)90086-1
- V. Ngako, E. Njonfang, F. A. Tongwa, P. Affaton and J. M. Nnange, “The North-South Paleozoic to Quaternary Trend of Alkaline Magmatism from Niger-Nigeria to Cameroon: Complex Interaction between Hotspots and Precambrian Faults,” Journal of African Earth Sciences, Vol. 45, No. 3, 2006, pp. 241-256. doi:10.1016/j.jafrearsci.2006.03.003
- D. Khattach, P. Keating, M. L. Mostafa, T. Chennouf, P. Andrieux and A. Milhi, “Apport de la Gravimétrie à l’étude de la structure du Bassin des Triffa (Maroc NordOriental): Implications Hydrogéologiques,” C.R. Geoscience, Vol. 336, No. 16, 2004, pp. 1427-1432. doi:10.1016/j.crte.2004.09.012
- N. E. Nsifa, “Magmatisme et Evolution Géodynamique de l’Archéen au Protérozoïque de la Bordure Nord-Ouest du Craton du Congo (Complexe du Ntem) au Sud-Ouest Cameroun,” Ph.D. Thesis, Université de Yaoundé 1, Yaoundé, 2006, p. 248.
- D. Minyem and A. Nedelec, “Origin and Evolution of the Eseka Gneisses (Cameroun). Archean TTG Reworked in the Panafricanmobilebelt,” Proceedings of the 15th Colloquium of African Geology, Nancy, 1990, pp. 21-24.
- O. J. Mvondo, “Caractérisation des Evènements Tectoniques dans le Domaine Sud de la Chaîne Panafricaine au Cameroun: Styles Tectoniques et Géochronologie des Séries de Yaoundé et de Bafia,” Ph.D. Thesis, Université de Yaoundé, Yaoundé, 2009, p. 162.
- J. P. Nzenti, T. Njanko, E. L. T Njiosseu and F. M. Tchoua, “Les Domaines Granulitiques de la Chaîne Panafricaine Nord-Equatoriale au Cameroun,” In: J. P. Vicat and P. Bilong, Eds., Géologie et Environnement au Cameroun, Collection Geocam, 1, 1998, pp. 255-264.
- J. F. Dumont, “Identification par Télédétection de L’accident de la Sanaga (Cameroun). Sa Position dans le Contexte de Grands Accidents de l’Afrique Centrale et de la Limite nord du Craton Congolais,” Géodynamique, Vol. 1, 1986, pp. 13-19.
- R. Tchameni, A. Pouclet, J. Penaye, A. Ganwa and S. F. Toteu, “Petrography and Geochemistry of the Ngaoundéré Pan-African Granitoids in Central North Cameroon: Implications for Their Sources and Geological Settin,” Journal of African Earth Sciences, Vol. 44, No. 4-5, 2006, pp. 511-529. doi:10.1016/j.jafrearsci.2005.11.017
- B. R. Rosendahl and H. Groschel-Becker, “Deep Seismic Structure of the Continental Margin in the Gulf of Guinea: A Summary Report,” In: N. R. Cameron, R. H. Bate and V. S. Clure, Eds., The Oil and Gas Habitats of the South Atlantic, The Geological Society, London, 1999, pp. 75- 83.
- K. Burke, “Seismic Areas of the Guinea Coast Where Atlantic Fracture Zone Reach Africa,” Nature, Vol. 222, 1969, pp. 655-657.
- G. Tagne-Kamga, E. Mercier and N. E. Nsifa, “Synkinematic Emplacement of the Pan-African Igneous Complex (West Cameroon, Central Africa),” Journal of African Earth Sciences, Vol. 28, No. 3, 1999, pp. 675-691. doi:10.1016/S0899-5362(99)00038-X
- S. F. Toteu, J. Penaye and Y. Poudjom Djomani, “Geodynamic Evolution of the Pan African Belt in Central Africa with Special Reference to Cameroon,” Canadian Journal of Earth Science, Vol. 41, No. 1, 2004, pp. 73-85. doi:10.1139/e03-079
- F. Collignon “Gravimétrie et Reconnaissance de la Ré- publique Fédérale du Cameroun,” ORSTOM, Paris, 1968, p. 35.
- N. J. Archibald, P. Gow and F. Boschetti, “Multiscale Edge Analysis of Potential Field Data Exploration,” Geophysics, Vol. 30, 1999, pp. 38-44.
- R. J. Blakely and R. W. Simpson, “Approximating Edges of Source Bodies from Magnetic or Gravity Anomalies,” Geophysics, Vol. 51, No. 7, 1986, pp. 1494-1498. doi:10.1190/1.1442197
- A. B. Reid, J. M .Allsop, H. Granser, A. J. Millett and I. W. Somerton, “Magnetic Interpretation in Three Dimensions Using Euler Deconvolution,” Geophysics, Vol. 55, No. 1, 1990, pp. 80-90. doi:10.1190/1.1442774
- K. Burke, L. D. Ashwal and S. J. Webb, “A New Way to Map Old Structures Using Deformed Alkaline Rocks and Carbonatites,” Geology, Vol. 31, No. 5, 2003, pp. 391- 394. doi:10.1130/0091-7613(2003)031<0391:NWTMOS>2.0.CO;2
- D. B. Boukeke, “Structures Crustales d'Afrique Centrale Déduites des Anomalies Gravimétriques et Magnétiques: Le Domaine Précambrien de la République Centrafricaine et du Sud Cameroun,” Ph.D. Thesis, Université de Paris Sud, 1994, 263 p.
- J. P. Vicat, “Esquisse Géologique du Cameroun: In Géosciences au Cameroun,” Collection GEOCAM1, 1998, pp. 3-11.
- T. C. Noutchogwe, C. T. Tabod, F. Koumetio and E. Manguelle-Dicoum, “A Gravity Model Study for Differentiating Vertical and Dipping Geological Contacts with Application to a Bouguer Gravity Anomaly over the Foumban Shear Zone, Cameroon,” Geophysica, Vol. 47, No. 1-2, 2011, pp. 43-55.
- V. Ngako, P. Affaton, J. M. Nnange and T. Njanko, “PanAfrican Tectonic Evolution in Central and Southern Cameroon: Transpression and Transtension during Sinistral Shear Movements,” Journal of African Earth Sciences, Vol. 36, No. 3, 2003, pp. 207-214. doi:10.1016/S0899-5362(03)00023-X
- M. Cornacchia and R. Dars “Untrait Structural Majeur du Continent Africain. Les Linéaments Centrafricains du Cameroun au Golfe d'Aden,”Bulletin de la Société Géologique de France, Vol. 25, 1983, pp. 101-109.
NOTES
*Corresponding author.