Open Journal of Geology
Vol.3 No.4(2013), Article ID:35136,5 pages DOI:10.4236/ojg.2013.34031
Electrical and Geological Investigations to Conduct Petrophysical Study in Douala-Cameroon Sedimentary Basin
1Department of Physics, Faculty of Science, University of Yaoundé I, Yaoundé, Cameroon
2Department of Earth Science, Faculty of Science, University of Yaoundé I, Yaoundé, Cameroon
Email: *pnnouck@yahoo.com
Copyright © 2013 Philippe Njandjock Nouck et al. This is an open access article distributed under the Creative Commons Attribution License, which permits unrestricted use, distribution, and reproduction in any medium, provided the original work is properly cited.
Received August 27, 2012; revised January 27, 2013; accepted February 27, 2013
Keywords: Resistivity; Petrophysic; Douala; Sedimentary Basin; Edea
ABSTRACT
Electrical and geological methods are used to conduct petrophysical study in Douala-Cameroon sedimentary basin along Yaounde-Douala National road No. 3. Studies in this region are made of three outcrops, namely: Missolè II located on the sedimentary basin of Douala, Edea and Sikoum which are outcrops of basement rocks that form the eastern boundary of the sedimentary basin of Douala. This study reveals that the rocks of the sedimentary basin of Douala are mainly composed of sandstone and clay. Both basement rocks of Edea and Sikoum are subjected to the same phases of deformation. These phases of deformation give the quartzite a particular structure that greatly influences the resistivity and density of these rocks and give it a planar anisotropy.
1. Introduction
The electrical properties are widely useful in the study of the interior of the earth, in the exploration of the surface layers (mineral exploration) and also in the characterization of soils [1-7]. Knowledge of such properties may be essential in particular to describe an oil reservoir, the operation of an aquifer or predict the importance of fluid motion in volcanic rocks or around a waste disposal site [8]. There are several standard abacuses that summarize the physical properties of rocks. These abacuses have several shortcomings because their values are very large for a single rock type and overlap for different rock types. This inaccuracy of the data is due to the fact that the physical properties of rocks depend on their geological settings and environment in which they are exposed. A petrophysical data contained in these abacuses does not usually consider the geology of the rocks studied. Environmental conditions and establishment of the rocks change from one region to another. This imprecision of values is often the cause of misinterpretation of data, thus causes losses of time and money. The improved results of the geophysical means improve basic documents by the constant influx of petrophysical data and especially more reliable because they are more constrained by geological data. The aim of this work is to contribute to the improvement of reference documents providing petrophysicaldata on some rocks of Douala sedimentary basin and some rocks of precambrian basement.
2. Materials and Methods
The formations studied are sedimentary rocks (sandstone and clay) of Missolè II and the precambrian basement rocks (quartzites and charnockites) observed respectively on the road cuts of Sikoum and Edea (Douala-Yaounde road) in the Cameroonian coast (Figure 1).
The geological study done on this training was carried out according to conventional methods that are the geologist’s hammer prospecting, followed by the study of thin sections and statistical treatment of structural data in the laboratory. The electrode configuration adopted for this study is the Schlumberger array. In this method four electrodes were placed along a straight line on the surface such that the current electrodes distance AB is equal
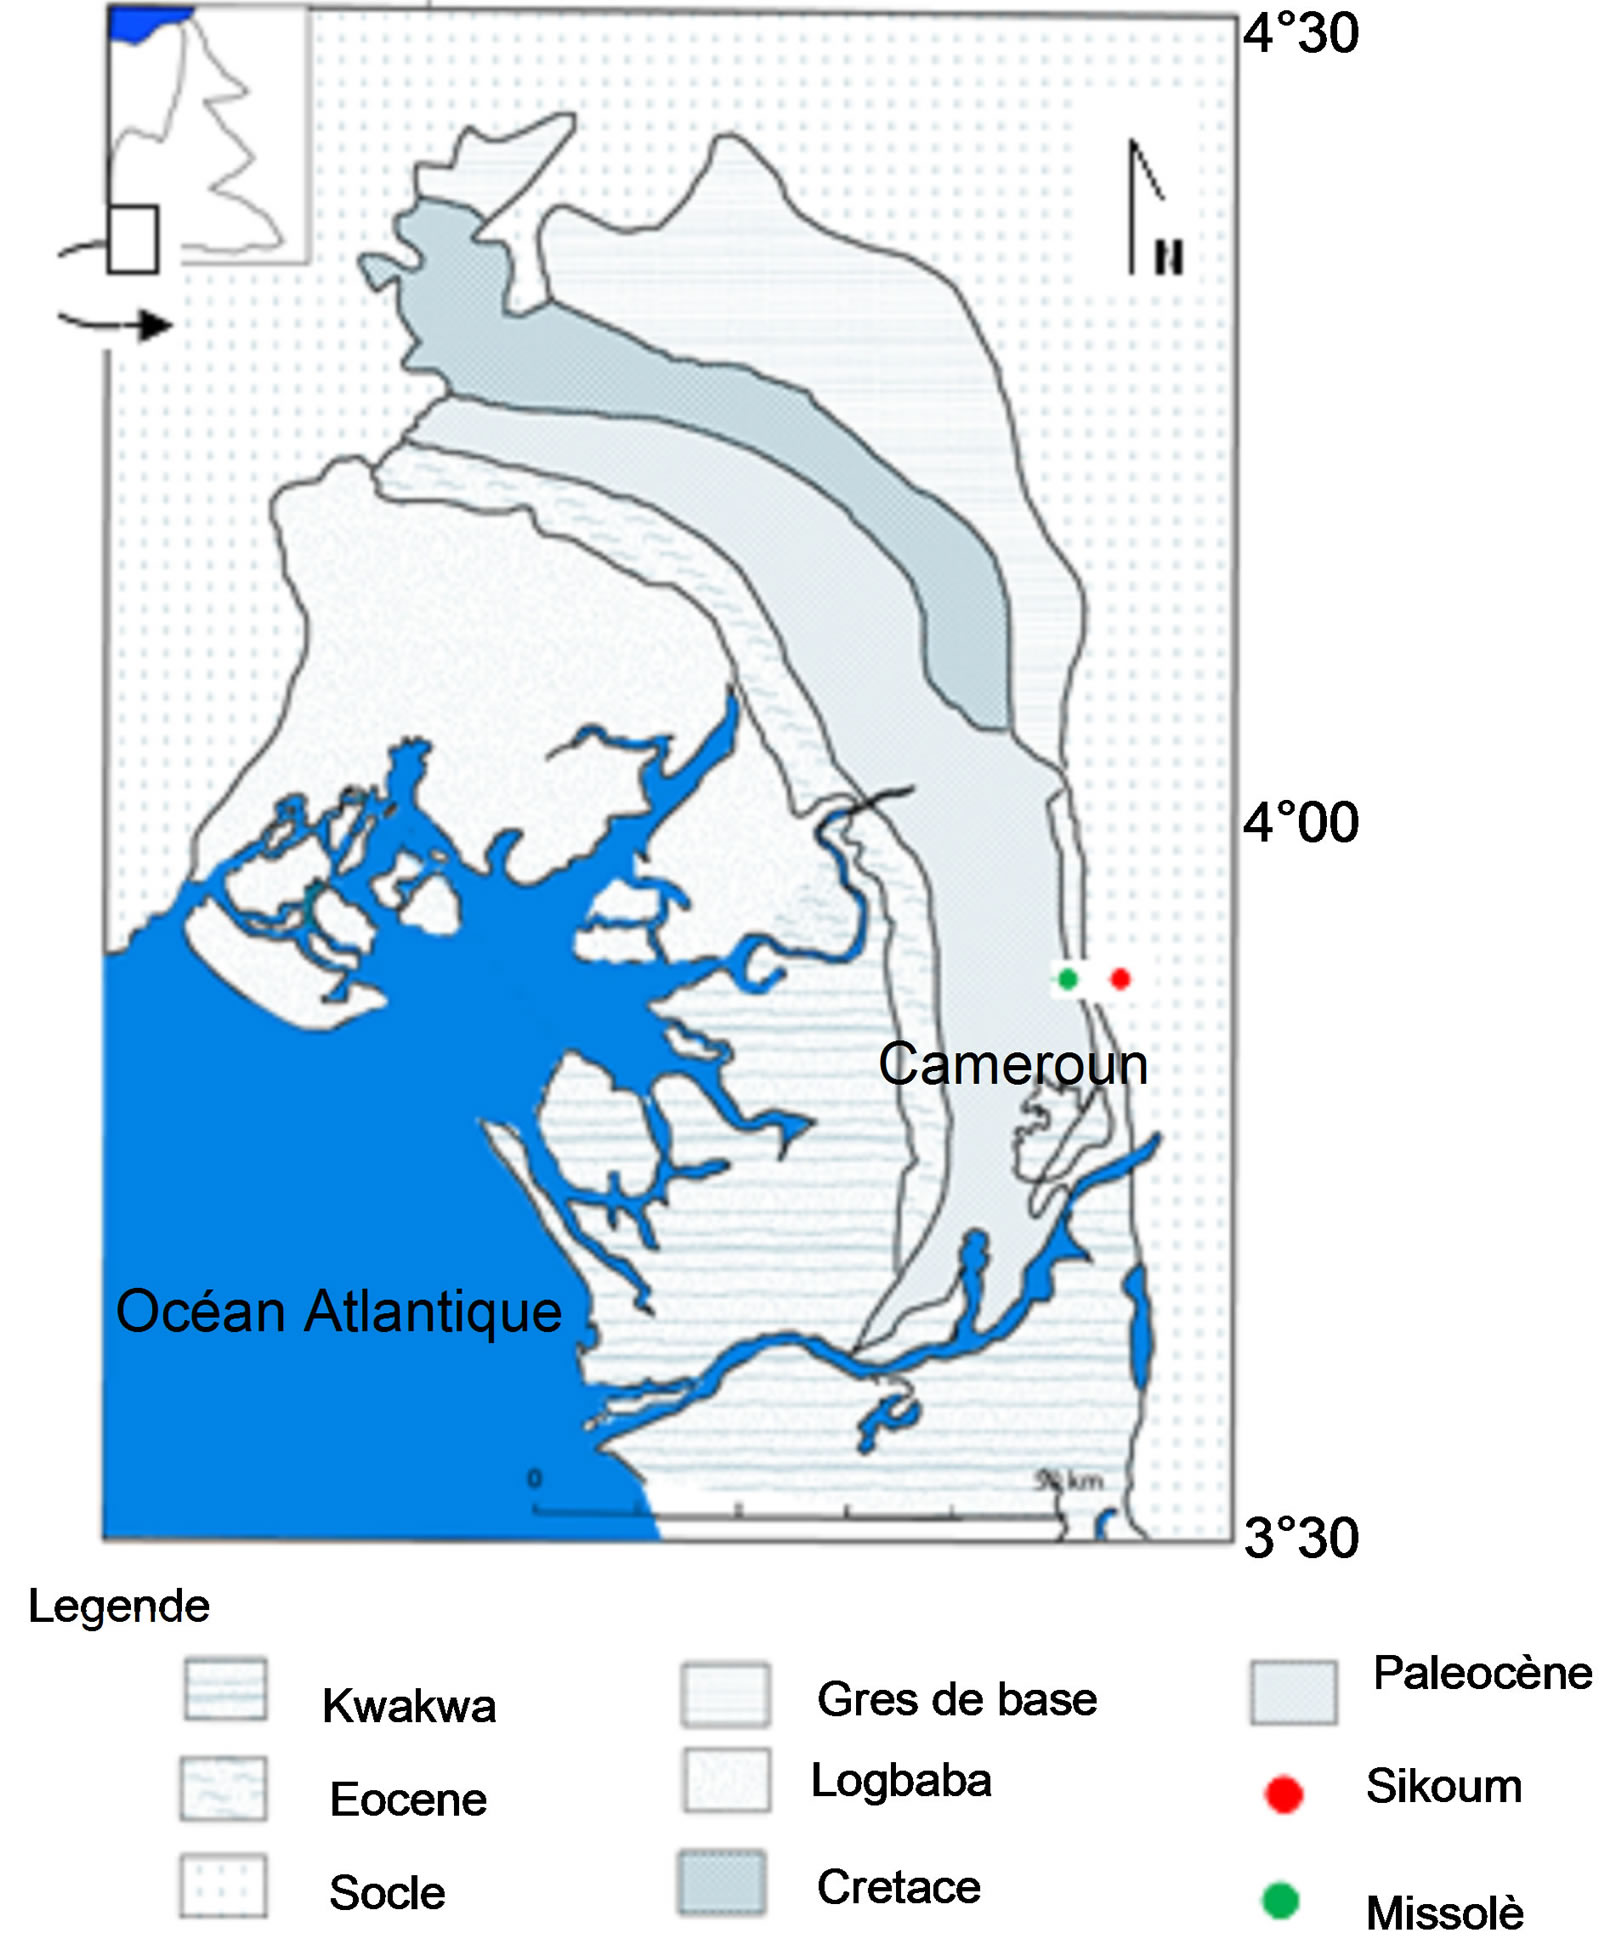
Figure 1. Sedimentary map of Douala region [9], modified.
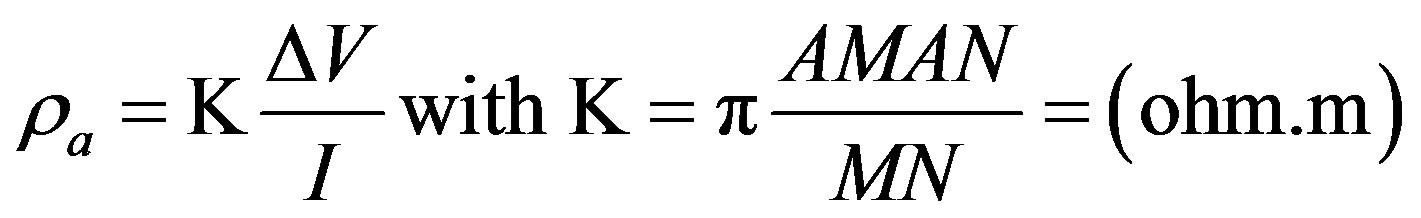
to or greater than five times the potential electrode distance [10,11]. For the linear symmetry array of electrodes (AMNB), the apparent resistivity given by Gruntorad and Karous [12] is:
 (1)
(1)
where V is the measured potential difference, I is the current and K is the geometrical factor that depends on the electrode arrangement for the Schlumberger array. Obtaining resistivity values required the establishment of an experimental device. This device consists of steel bar of 15 cm in length serving as electrodes. These steel bars are embedded in a wooden parallelepiped shape. To isolate the steel bars of wood, they are surrounded by rubber bands of about 5 mm thick. The electrodes A and B (injection electrodes) are connected to two batteries while the electrodes M and N (measuring electrodes) are connected to an ammeter and voltmeter (high impendency). Values for their densities were obtained by direct measurement of mass and volume.
3. Results and Discussion
3.1. Geology
The region is characterized by three outcrops: the outcrops of Missole, Edea and Sikoum. The study reveals that, the outcrop of Missolè consists of detritical rocks, particularly sandstones and clays which are positively graded implemented in an environment of high energy. The other two show outcrops of precambrian basement rocks, which are constituted by charnockites in Edea and quartzites in Sikoum. Petrographic analysis reveals that quartzites are essentially formed by quartz, feldspar and muscovite abundant especially in the shear planes (Figure 2), while charnockites contain predominantly quartz, feldspar, clinopyroxene and orthopyroxene.
The structural analysis reveals highly structured formations of the base, including quartzite, with identical structures in both outcrops. These allow us to distinguish three main deformation phases:
• Phase D1, the first phase of deformation, observed only on charnockites, is characterized by the first folding that affects the original magmatic layering of the rock and give wrinkles P1.
• Phase D2, observed on the charnockites and quartzites, is characterized by P2 folds more or less straight to axes plunging to the south which include the P1 fold. This phase of intense folding was accompanied by the establishment of an S2 axial plane cleavage of folds, carrying a stretching lineation and shear planes C2 carrying a transport lineation.
• The third phase of deformation D3 is characterized mainly by a network of fractures observed at both sites of Edea and Sikoum.
The same phases of deformation have been identified by [13,14] in the town of Edea. Thus, structural analysis confirms the structural identity between the rocks of the basement. Difference can however be noted in the character of the deformation which is ductile in the charnockites and fragilo-ductile in the quartzites. We can associate this difference of caracters to a difference in
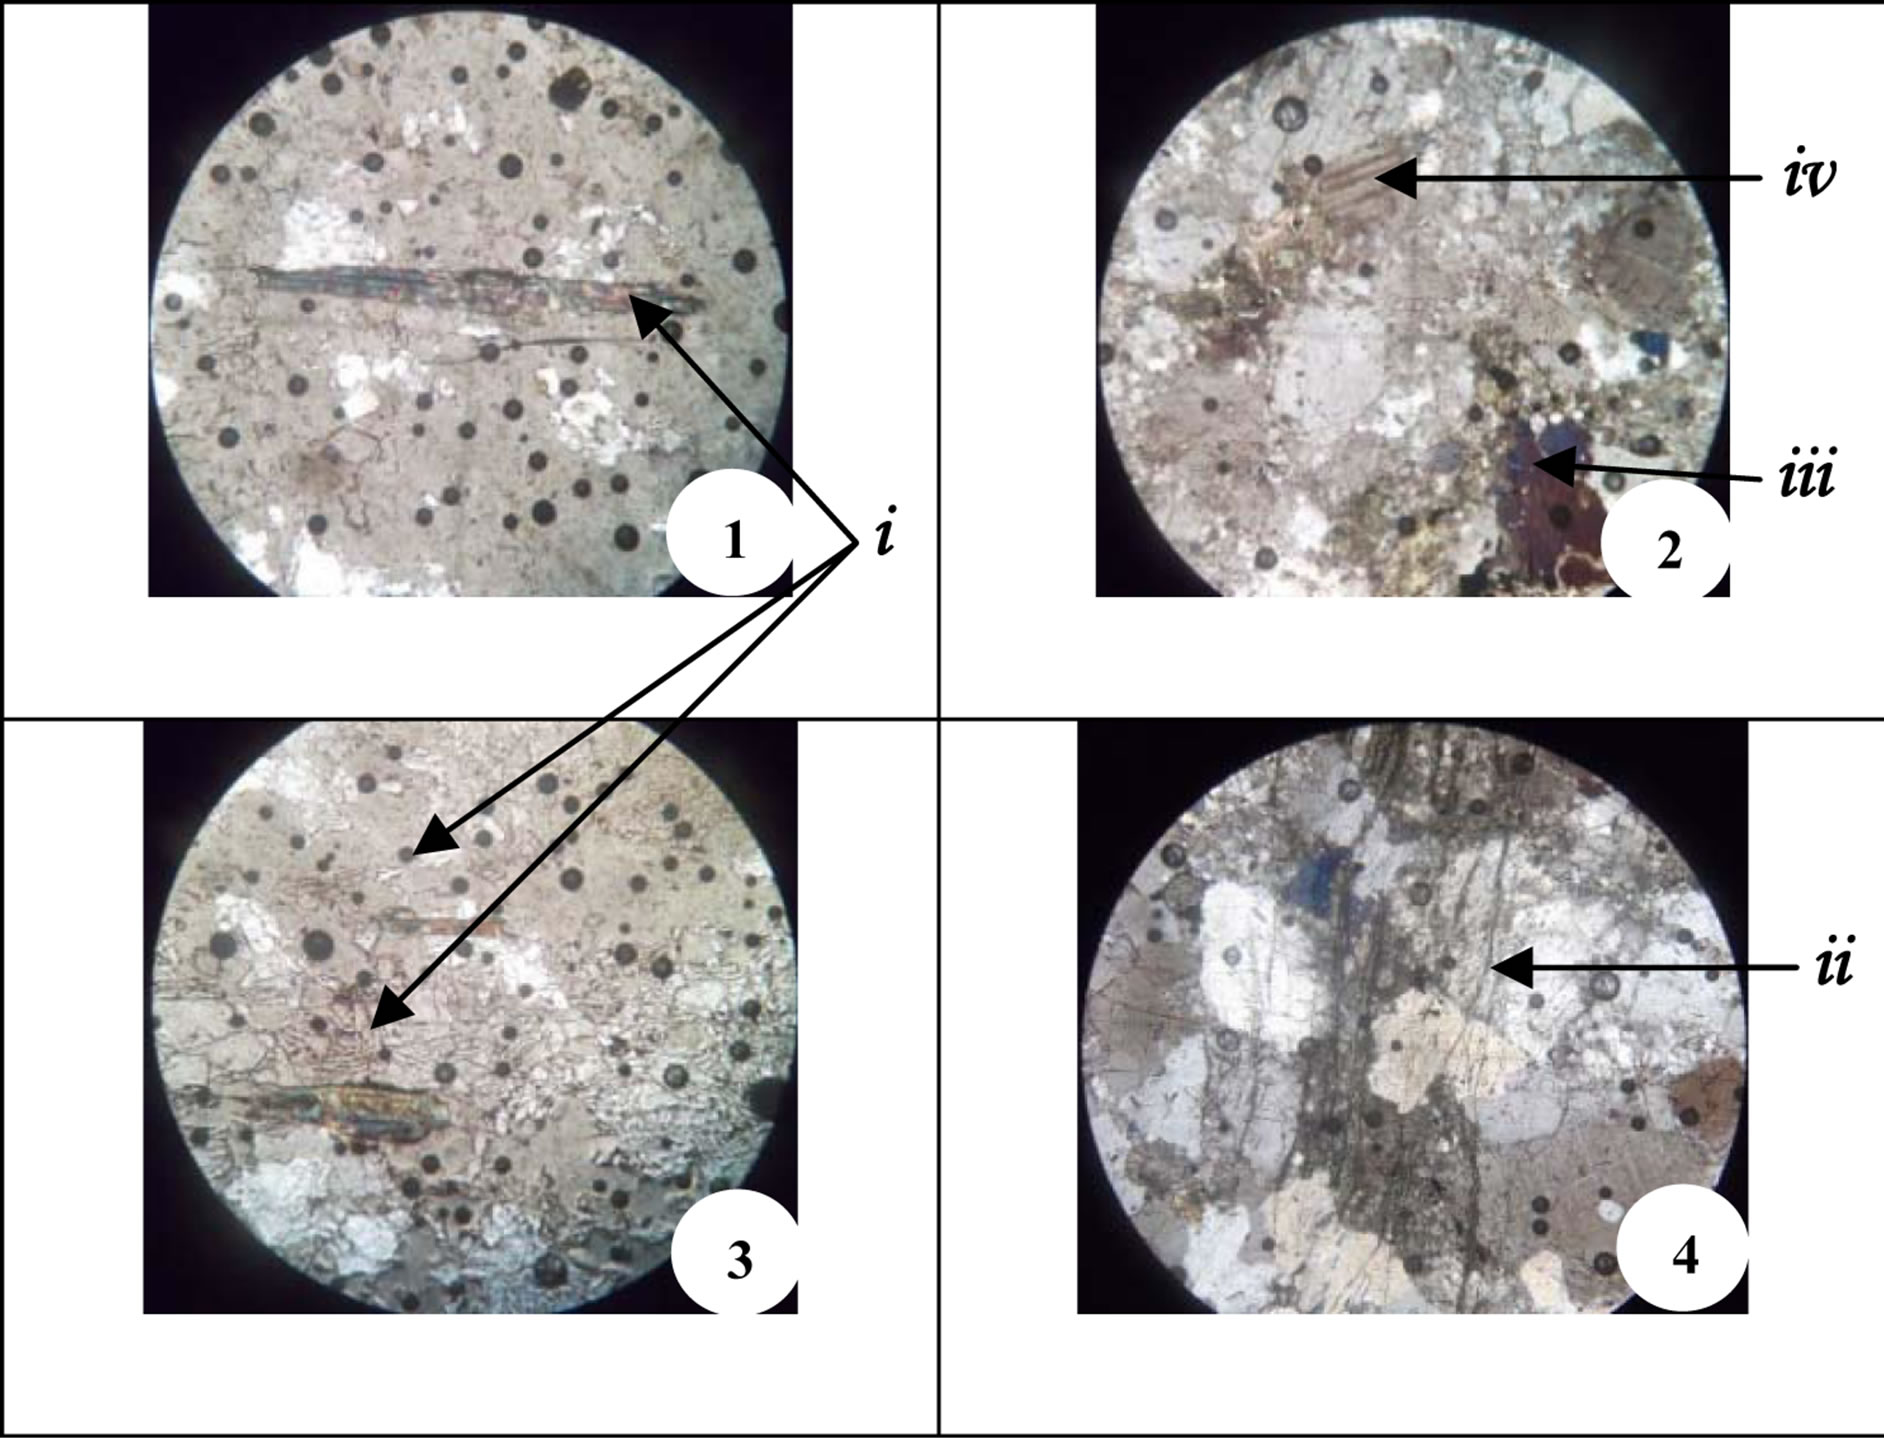
Figure 2. Muscovite rod (1); thin charnockite showing pyroxenes retromorphosés (2); muscovite aligned along the fracture planes (3); slots tensions in charnockites (4). (i) Muscovite in the thin section of quartzites, (ii) tension cracks in the charnockites; (iii) retromorphose pyroxenes (iv) plagioclase.
rheological structural level training during the D2 deformation.
3.2. Petrophysics
The statistical treatment of petrophysical data allowed us to have some interesting results on the resistivity and density of the rocks studied. Concerning the resistivity, the positional parameters such as mean, median and quartiles (Figure 3), and the dispersion parameters such as range, variance and standard deviation (Figure 4) were used to characterize the rocks. Overall, it appears that the clays have the lowest resistivity, followed by sandstone and quartzite. This can be explained by the fact that clay minerals are electrically polarized, clays are more conductive, while the quartz that makes up most of the sandstones and quartzites is not conductive.
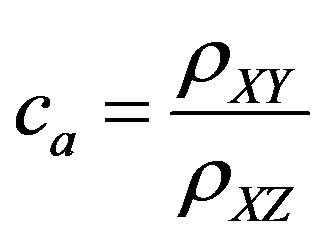
Furthermore, the resistivities in clays are grouped quite unlike a greater dispersion observed in the sandstones, and worse, in the quartzites. Investigations conducted on quartzite have allowed us to reveal anisotropy of the resistivity in these rocks. This anisotropy may be due to the strong structural anisotropy observed in the rock where C2 shear planes are covered with muscovite more conductive than quartz (Figure 5). Measurements made on two different planes (XY and XZ) were used to calculate the coefficients of anisotropy (Ca) which is given by the following Equation (2):
 (2)
(2)
where ρXY and ρXZ are the resistivities measured on the different planes of rock deformation (Figure 6).
There were twenty different measurement points, on the abscissa point 1 is the first measurement position corresponding to a 27.32 mm gap between the electrodes A and B. Equivalent to the second position AB equal to 34.75 mm so on until position 20 which corresponds to the value 158.62 mm. For spacing between AB and 27.32 46.36 mm, the medium traversed by electric waves appears isotropic with coefficients between 1.01 and 0.91.
This is due to fracturing which is more abundant on the surface of the sample analyzed. Flakes of muscovite contained in fractures accelerate the propagation of waves in any direction. In this interval therefore, the values of resistivity are relatively low and close. For values of AB above 50 mm, the anisotropy coefficient decreases. This is probably due to the decrease in the density of fractures. This decrease in the density of fractures affects differently the propagation of electric waves and therefore the values of resistivity Figure 7. Unlike
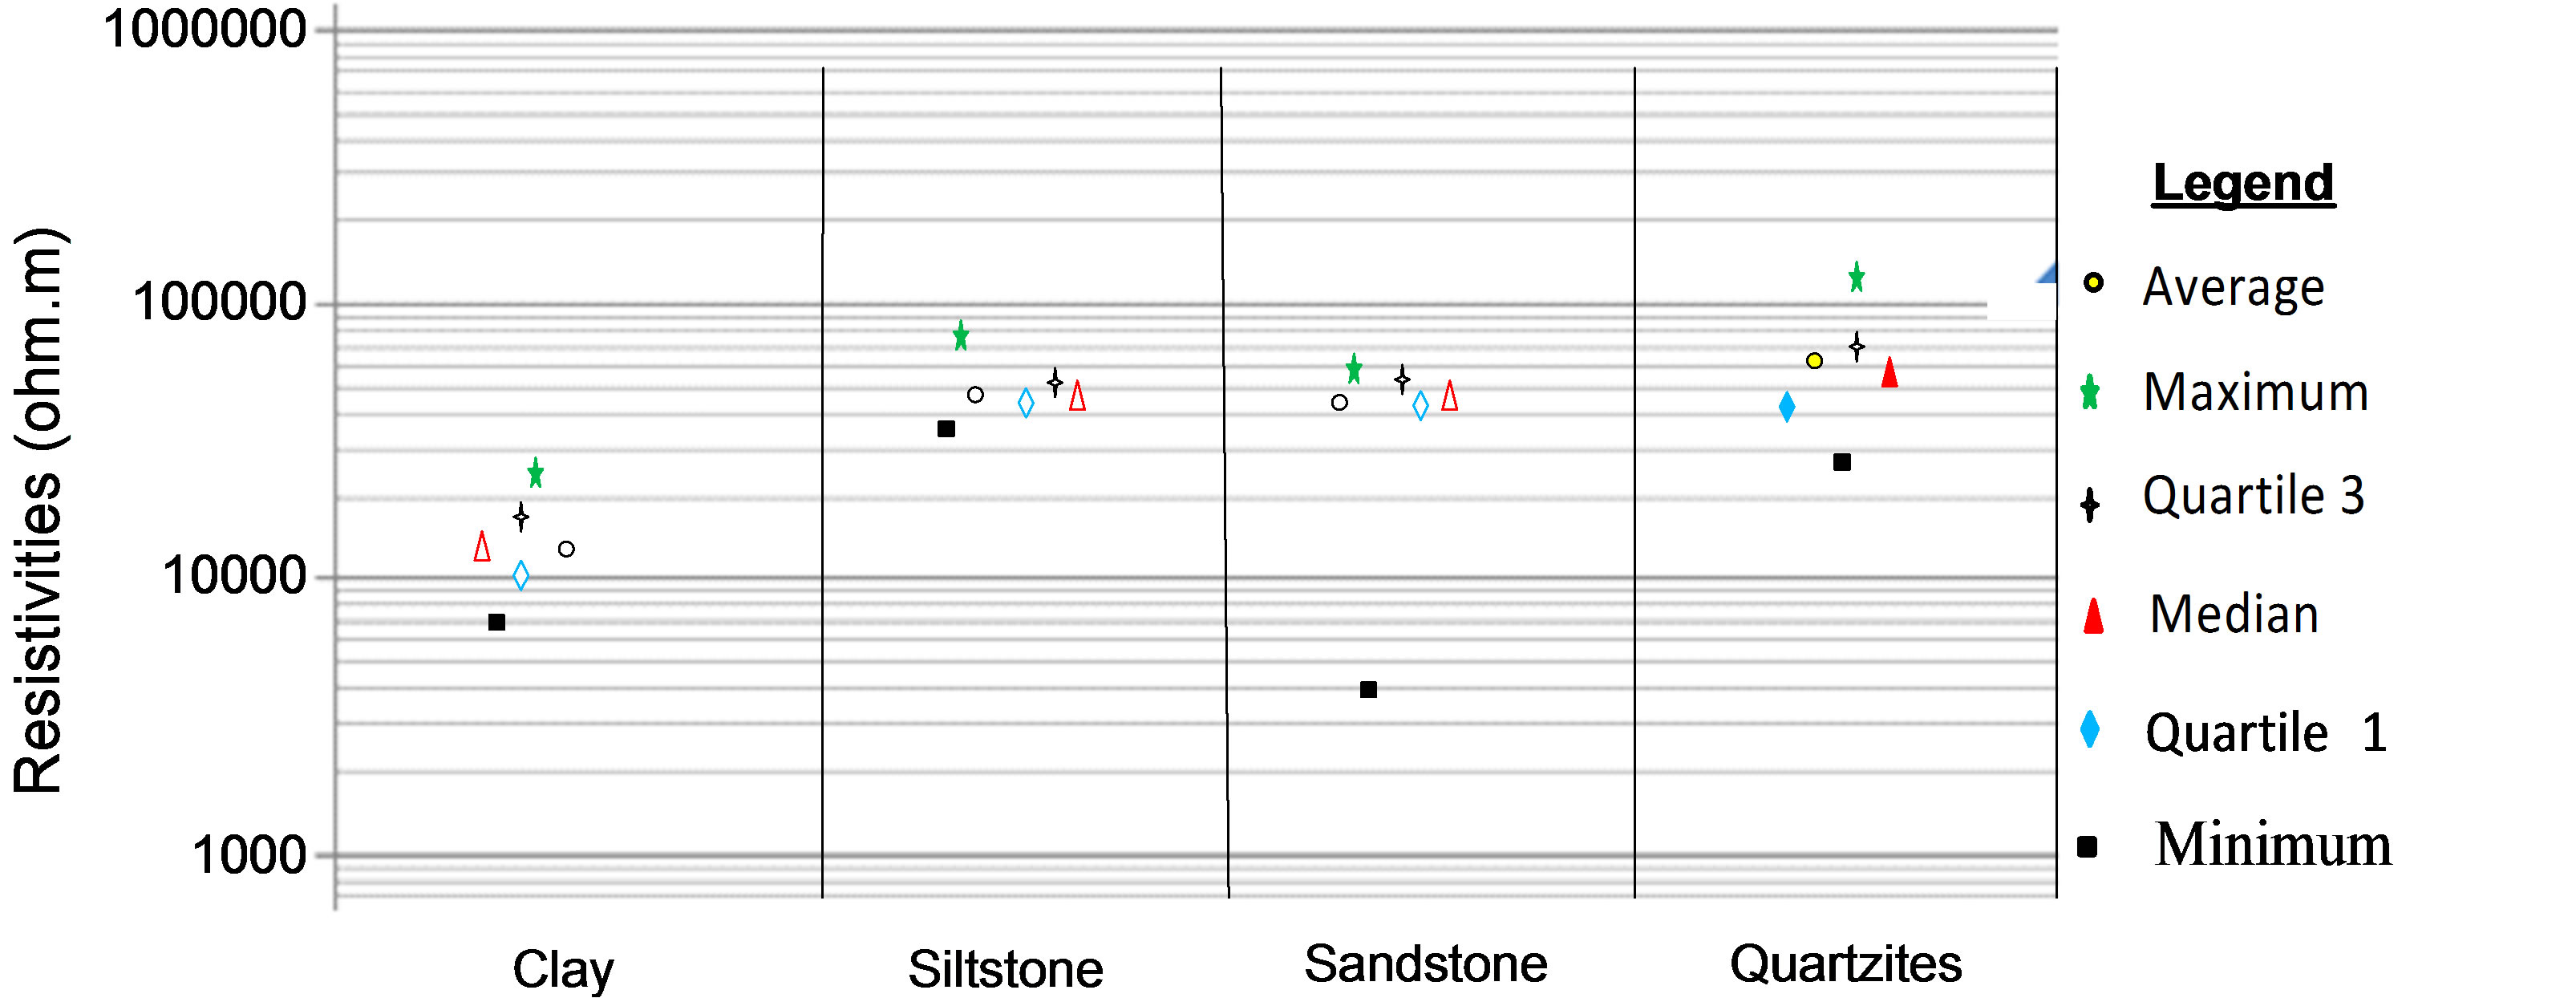
Figure 3. Graphical representation of positional parameters.
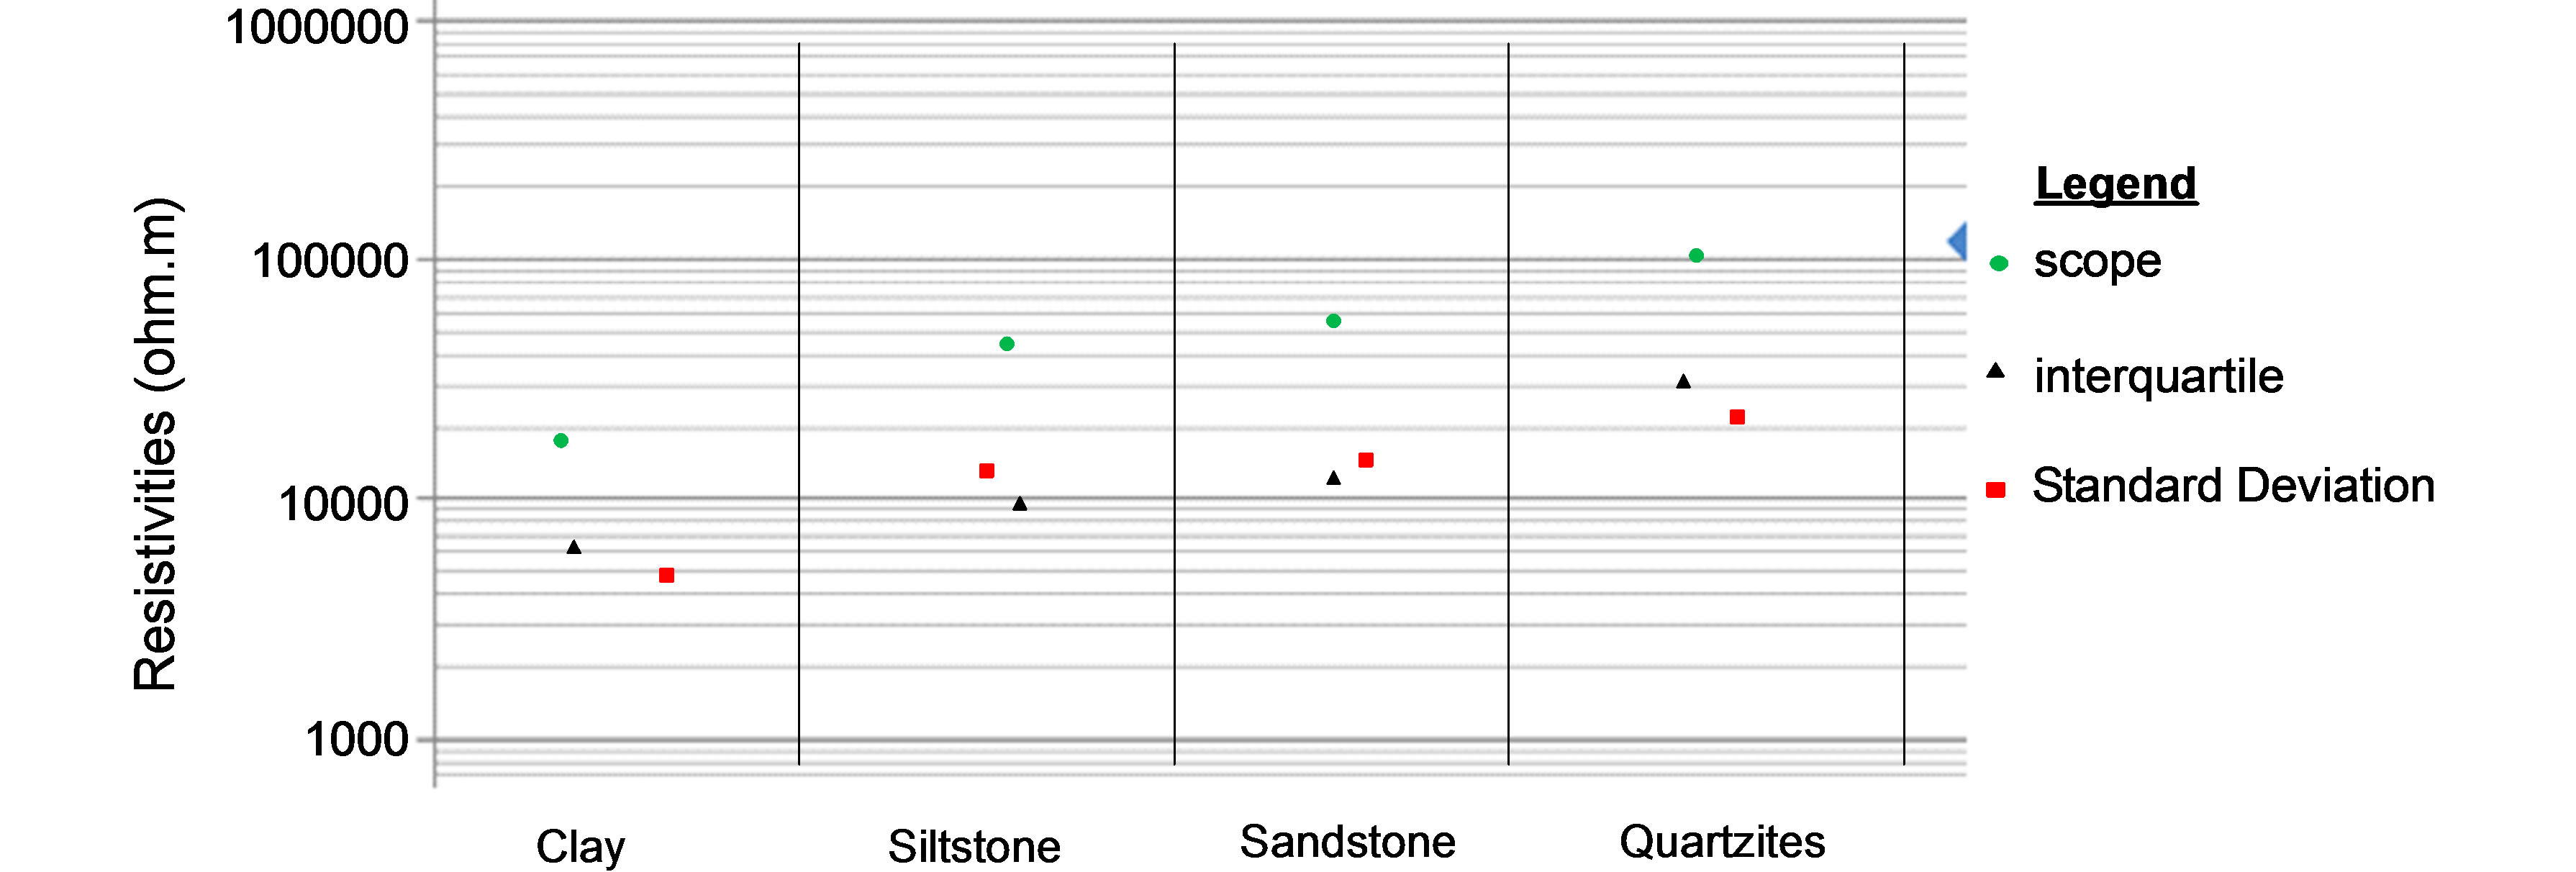
Figure 4. Graphical representation of dispersion parameters.
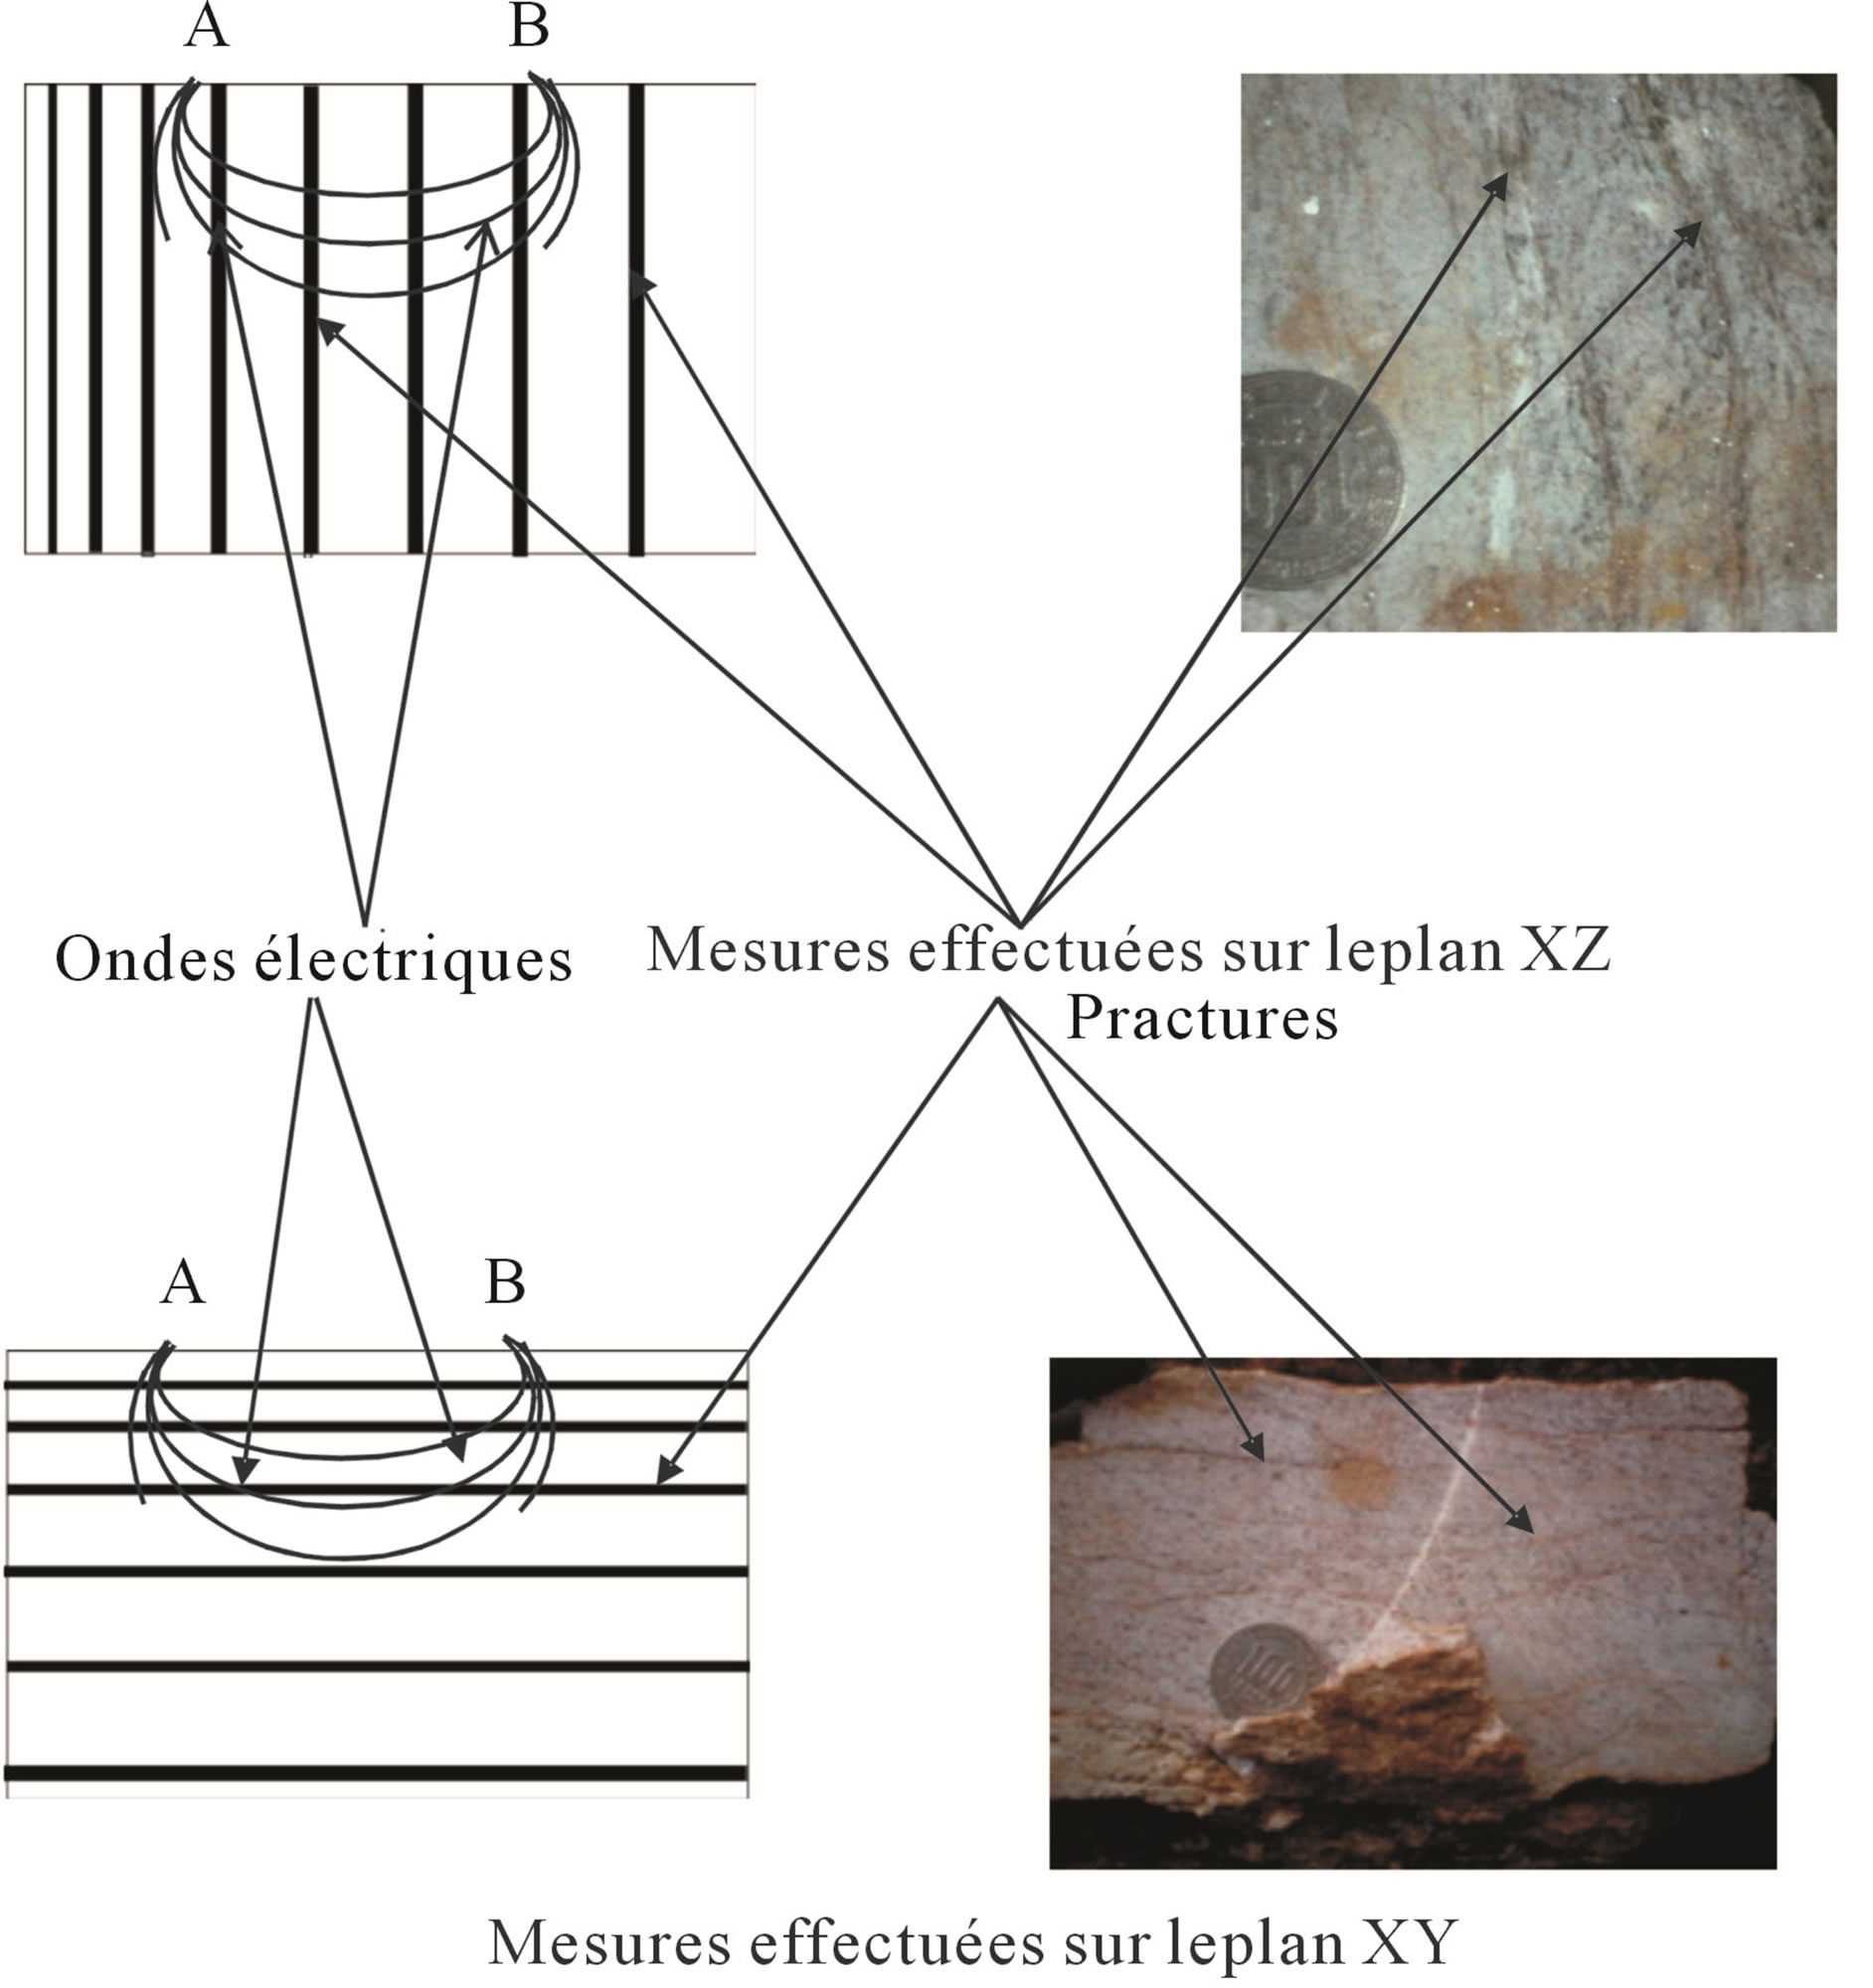
Figure 5. Distribution of electric waves in the quartzites along the two different action plans. A and B represent the measurement electrodes.
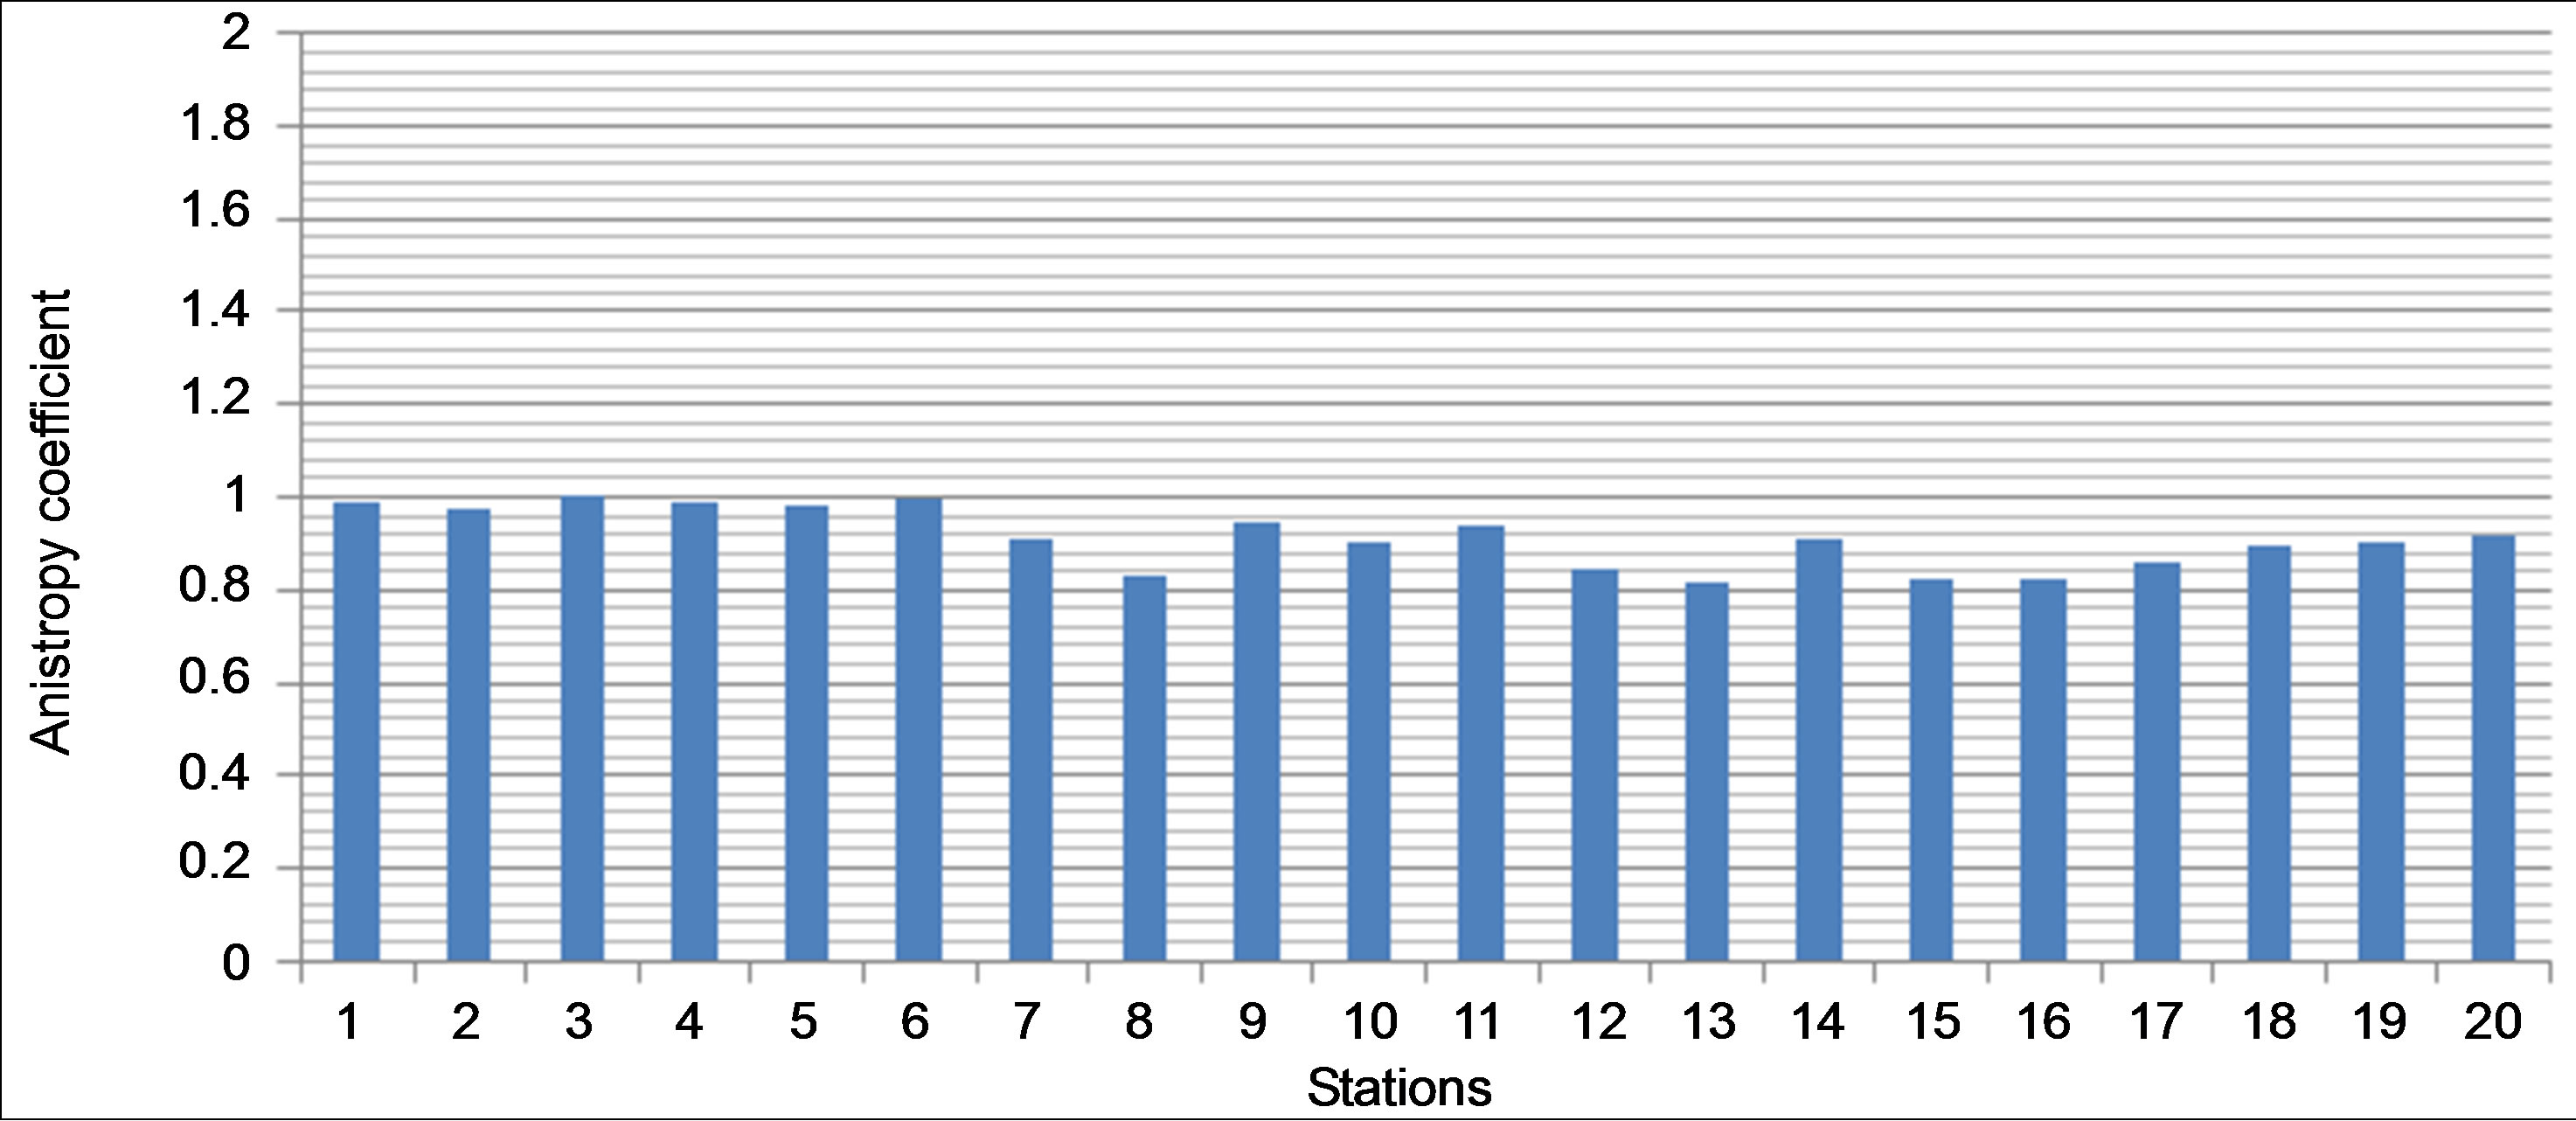
Figure 6. Coefficients of anisotropy with respect to different electrode positions (AB).
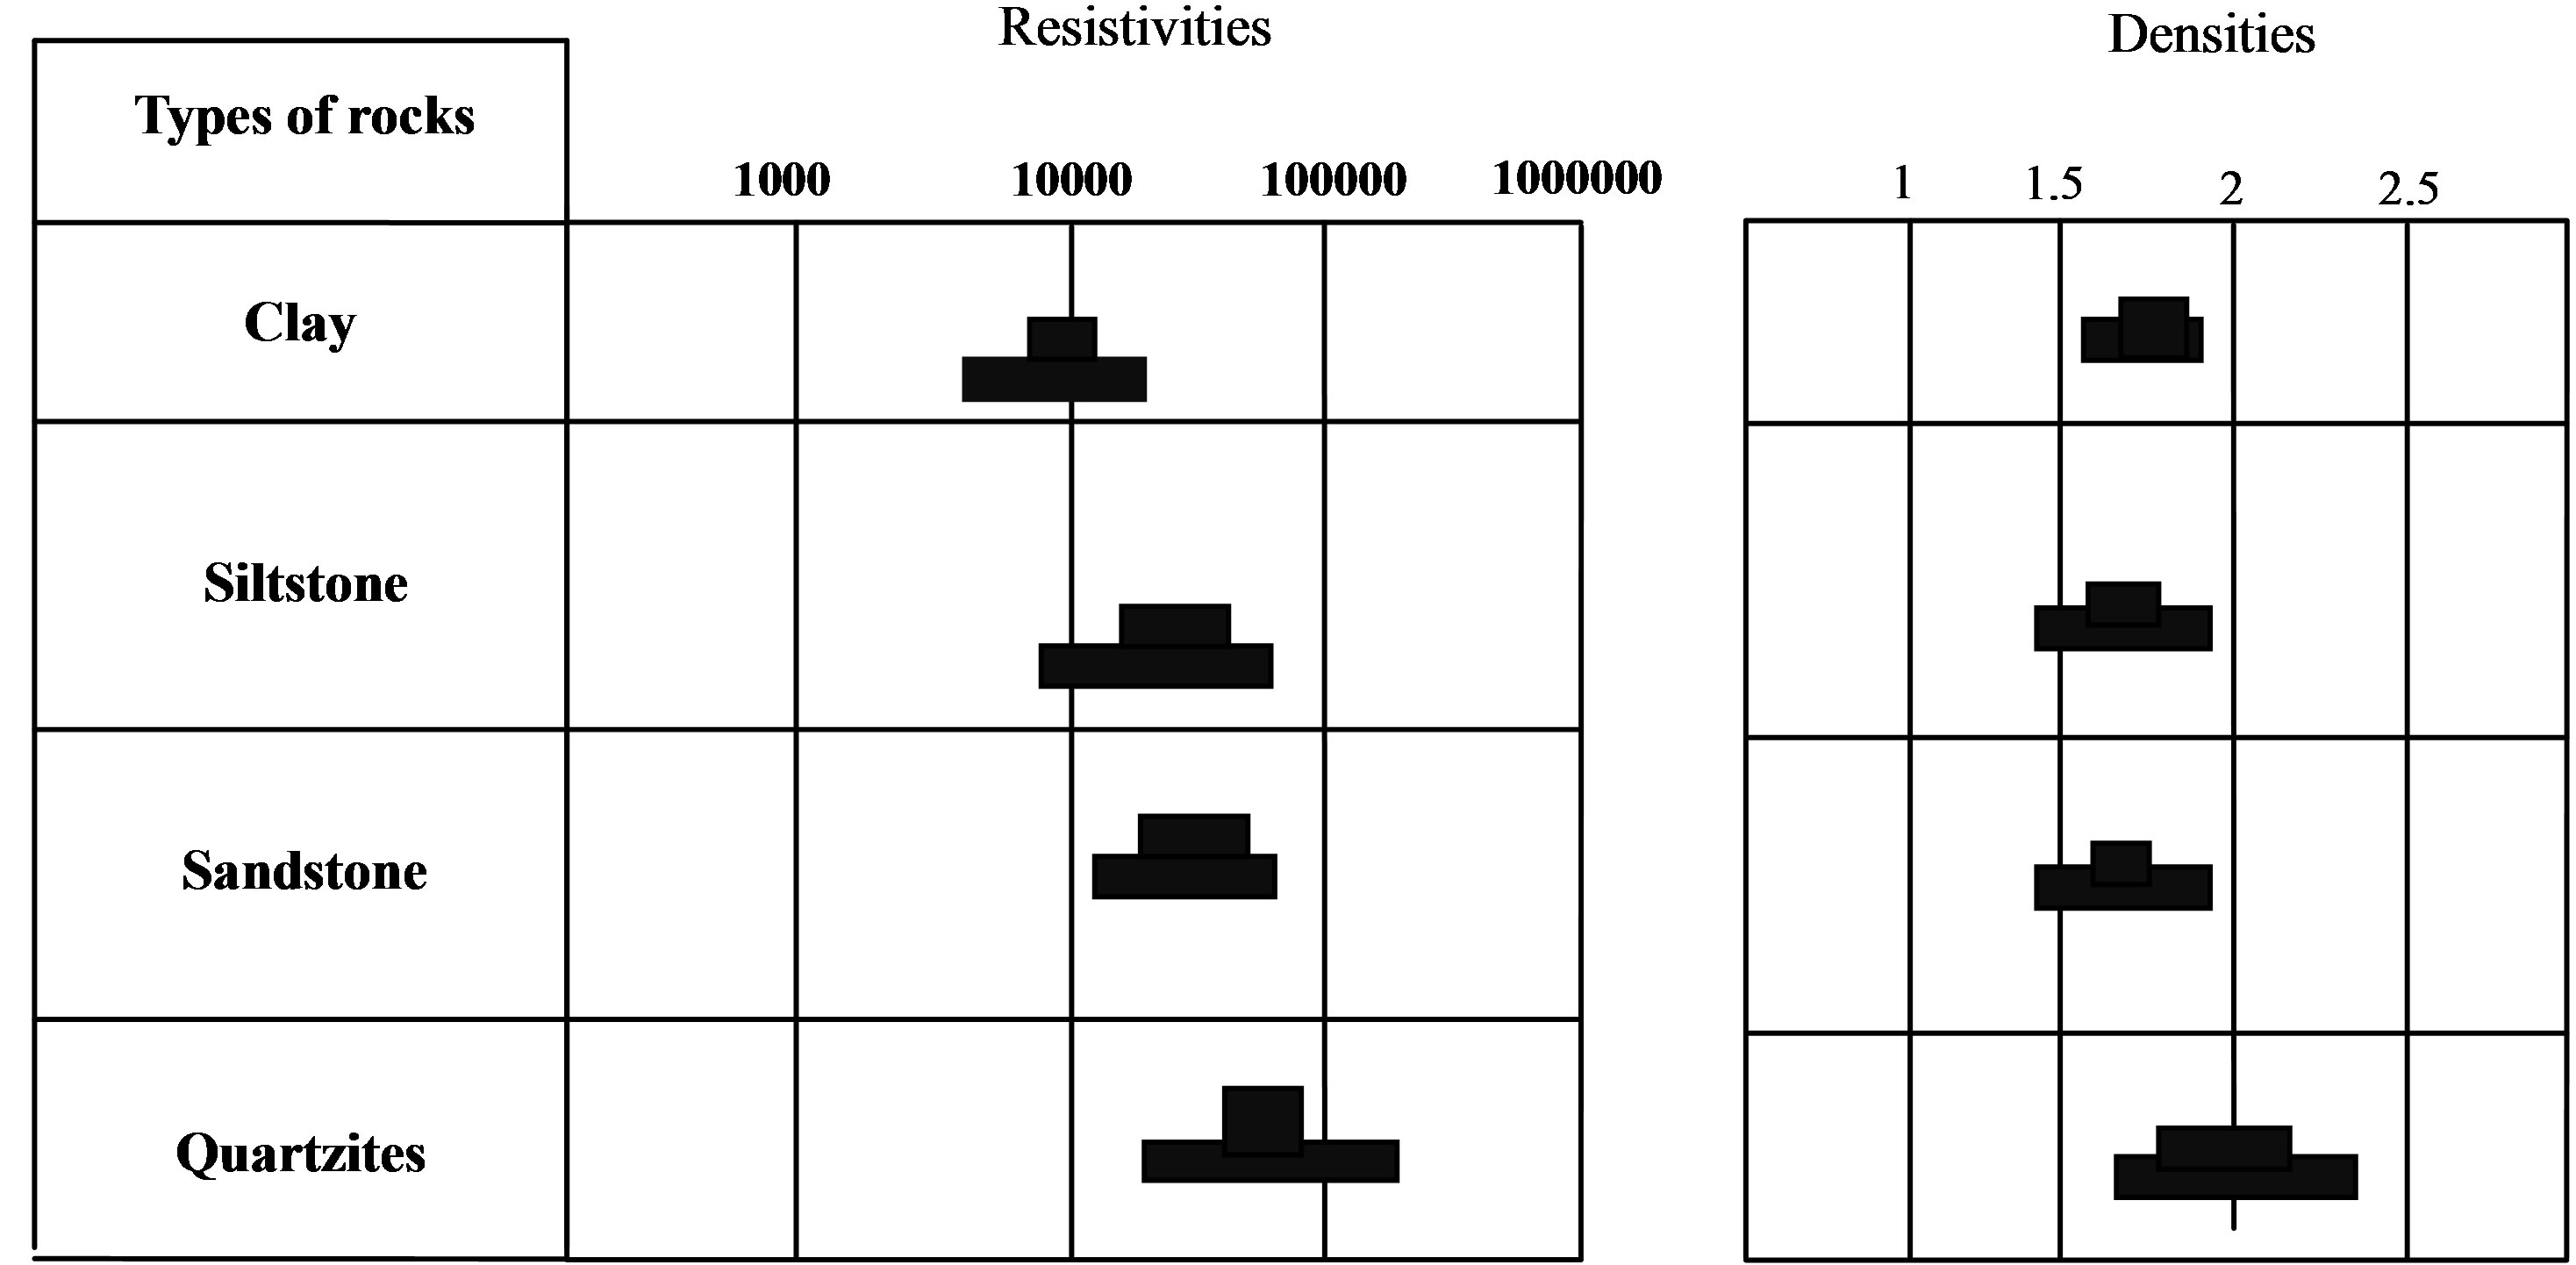
Figure 7. Abacus of sedimentary and igneous rocks of Edea.
resistivity measurements, the values of rock densities don’t change too much. However, there is a greater density for quartzite rocks are consolidated. In the sandstones, there is some scatter, due to the random distribution of voids. Clays that are more homogeneous densities were almost invariable.
4. Conclusions
The investigations into the various formations encountered show that the Douala sedimentary basin is bounded to the East by two rock types: charnockites and quartzites. The similarity of structural elements observed in these rocks reveals that despite their different natures, these two rocks were subjected to the same constraints.
These constraints gave three phases of deformations observed in these rocks. The third phase has generated a shear which occurs in two main directions and cuts across the schistosity, giving three families of planes of weakness. The families of planes of weakness have become sites of accumulation of muscovite. The analysis of resistivities permits us to observe the influence that rocks structures can have petrophysical properties. The presence of muscovite changes the distribution of electric waves in the quartzites because of their lower resistivity than silica; these investigations also show that, the presence of fractures in the quartzites generates anisotropy in this rock and gives it a particular density. The resistivities and densities of the various formations encountered, allowed us to make a chart specific to this region.
REFERENCES
- G. R. Keller and F. C. Frischknecht, “Electrical Methods in Geophysical Prospecting,” Pergamon, Tarrytown, 1966.
- J. D. Rhoades and R. D. Ingvalson, “Determining Salinity in Field Soils with Soil Resistance Measurements,” Soil Science Society of America Journal, Vol. 35, No. 1, 1971, pp. 54-60. doi:10.2136/sssaj1971.03615995003500010020x
- J. D. Mac Neil, “Electrical Conductivity of Soils and Rocks,” Technical Note TN-5, Geonics Ltd., Mississauga, 1980.
- R. Gary and Olhoeft, “Electrical Properties of Granite with Implications for the Lower Crust,” Journal of Geophysical Research, Vol. 86, No. B2, 1981, pp. 931-936.
- M. El Oumri and J. Vieillefon, “Etude Expérimentale de la Conductivité Electrique Globale des Sols,” Application à l’Estimation de Leur Salinité. Cah. ORSTOM, sér. Pédol., Vol. 10, No. 2, 1983, pp. 91-108.
- J. P. Montoroi, “Contrôle de la Salinité à l’Aide de Capteurs Electriques,” Application à un périmètre irrigué de la basse vallée de la Méjerdah (Tunisie). II-la sonde quadripôle. Agron. Trop., Vol. 46, No. 3, 1992, pp. 233-240.
- J. P. Montoroi, G. Bellier and J. L. Delarivière, “Détermination de la Relation Résistivité Electrique—Teneur en eau au Laboratoire,” Application aux sols de Tunisie centrale. Col. GEOFCAN, 1997, pp. 153-159.
- A. Belghoul, “Caractérisation Pétrophysique et Hydrodynamique du Socle Cristallin,” Thèse, Université Montpellier 2, Montpellier, 2007, 266 p.
- A. Chiarelli, “Etude des Nappes Aquifères Profondes du Bassin de Douala (Cameroun),” ELF-R, Paris, 1975, pp 322-335.
- J. F. Ayers, “Conjunctive Use of Geophysical and Geological Data in Study of Alluvium Aquifer,” Ground Water, Vol. 25, No. 5, 1989, pp. 625-635.
- D. Chapellier, “Cours de Géophysique-Résistivités Electriques,” 2001, 100 p.
- J. Gruntorad and M. Karous, “Geoelectrical Methods,” In: M. D. Stanislav, Ed., Introduction to Applied Geophysics, Reidal Publishing Company, Dordrecht, 1984, pp. 263-387.
- I. A. P. Moussango, “Contribution à l’Etude Structurale et Pétrographique du Secteur d’Edéa et ses Environs,” D.E.A. Uni. Yaoundé I., 2001, 83 p.
- A. Bignam, “Contribution à la Caractérisation Pétrophysique des Roches de la Région d’Edéa,” University of Yaounde I, Yaounde, 2011, 63 p.
NOTES
*Corresponding author.