Open Journal of Geology
Vol. 2 No. 2 (2012) , Article ID: 18680 , 13 pages DOI:10.4236/ojg.2012.22004
Subsurface Facies Analysis of the Late Cambrian Mt. Simon Sandstone in Western Ohio (Midcontinent North America)
1ExxonMobil Exploration Company, Houston, USA
2Department of Geology, Bowling Green State University, Bowling Green, USA
Email: *evansje@bgsu.edu
Received February 8, 2012; revised March 7, 2012; accepted April 3, 2012
Keywords: Mt. Simon Sandstone; Cambrian; Ohio; depositional environment; subsurface facies analysis; natural gas; petroleum; Midcontinent North America
ABSTRACT
The Cambrian Mt. Simon Sandstone (MSS) is a possible unconventional gas reservoir in the Illinois, Michigan, and Appalachian Basins, but comparatively little is known about the unit. This study used core and well logs from two deep exploratory wells to interpret the depositional environment of the MSS under western Ohio, where the MSS is about 120 m thick and found 1060 m below ground surface. In western Ohio, the MSS unconformably overlies the Precambrian Middle Run Formation, is conformably overlain by the Cambrian Eau Claire Formation, and has a distinctive gamma-ray log-signature. In well DGS-2627, the MSS consists of tan, friable, moderately sorted, rounded, coarseto very coarse-grained siliceous quartz arenite with minor heterolithic sandstone-mudstone couplets (rhythmites) and quartz granule conglomerate. Features indicative of tidally-influenced, shallow marine settings include tidal rhythmites, lenticular-, flaser-, and wavy-bedding, herringbone cross-bedding, mud-drapes, tidal bundles, reactivation surfaces, intraclasts, and bioturbation. The unit generally coarsensand thickens-upward, and is interpreted as migration of a tidally-influenced transgressive barrier sequence. A subsurface facies model for the MSS is developed by interpreting geophysical logs and cores from DGS-2627l, and this model is semi-quantitatively tested by first interpreting well BP-4 using geophysical logs alone, then confirming the results using core.
1. Introduction
1.1. Purpose
The subsurface geology of Ohio consists of a thick sequence of relatively undeformed Paleozoic sedimentary rocks that overlies the “Grenville Front”, a Precambrian collisional zone which separates the Granite-Rhyolite Province and Eastern Continental Rift Basin under western Ohio from the Grenville Province under eastern Ohio [1]. The depth to Precambrian basement in Ohio has been determined from well core, geophysical logs, gravity and aeromagnetic mapping [1,2] and seismic reflection profiles [3,4]. These rocks are shallowest (typically about 700 m) in western Ohio along a north-south—trending structure called the Cincinnati-Findlay Arch and deepen to the east (Appalachian Basin), to the northwest (Michigan Basin), or to the west (Illinois Basin), reaching depths >3000 m in each basin (Figure 1).
The purpose of this study is to evaluate the depositional environment of the oldest Paleozoic sedimentary unit that unconformably overlies the basement surface, the Cambrian Mt. Simon Sandstone (MSS). Because the MSS is entirely subsurface in Ohio, this study uses diamond drill core and both gamma-ray and neutron-porosity geophysical logs for subsurface facies analysis. The goal of facies analysis is to reconstruct the depositional environment by examining lithology, composition, textures, and sedimentary structures. Some of the information can be directly obtained from cores, but larger-scale sedimentary structures and textural trends are more recognizable from interpretation of geophysical logs. This study proceeds in three steps: 1) an integrated log and core analysis was completed for DGS-2627; 2) the depositional model was projected to BP-4 based on geophysical logs alone; and 3) the projected interpretations were semi-quantitatively tested using core data from BP-4 (Figure 1).
1.2. Geologic Background
In Ohio, Precambrian rocks were eroded to a low-relief
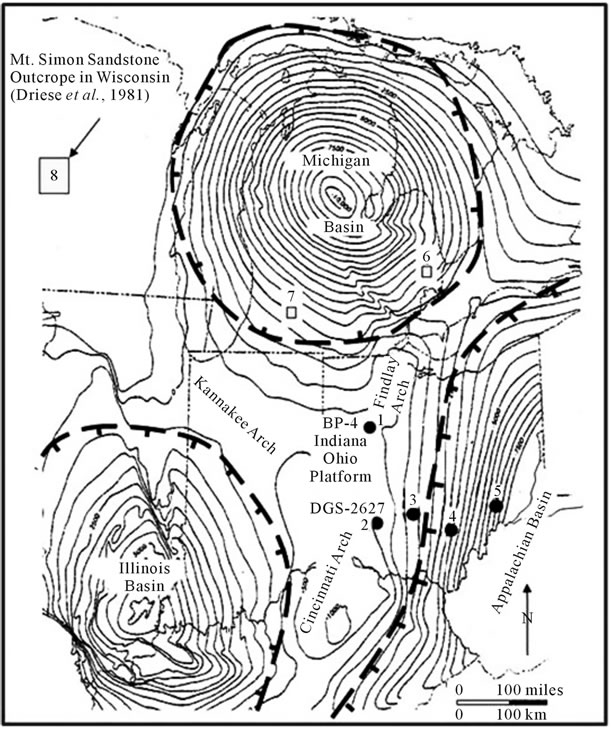
Figure 1. Structural contour map based on the top of the Trenton Formation, with 500 foot contour, showing the Paleozoic tectonic elements of the eastern midcontinent region. The five wells that reach the Mt. Simon Sandstone in Ohio are: 1) BP-4 in Allen County; 2) DGS-2627 in Warren County; 3) Long-1 in Pickaway County; 4) Hockman-1 in Hocking County; and 5) Ulman-1 in Noble County. Also shown are the locations of studies mentioned in this report: 6) a well in St. Claire County, Michigan [15]; 7) a well from Kalamazoo County, Michigan [16], and (8) outcrops in Wisconsin [13].
surface prior to the late Cambrian transgression [5]. This transgression was apparently related to the separation of Laurentia (North America) and Baltica (northern Europe) during the formation of the Iapetus Ocean. During the Late Cambrian, Ohio was located on the stable southwestern margin of the Laurentian continent [6].
The MSS is distinctive quartz-rich sandstone that is widespread across several Midwest states and is typically the oldest Cambrian rock unit (Figure 2). At its type section in Wisconsin the unit is 65 m thick, overlies Precambrian basement, and is overlain by the Cambrian Eau Claire Formation [7]. In the Appalachian Basin, stratigraphic equivalents include the Potsdam Formation in western Pennsylvania and western New York [8,9] and the Waynesboro Formation in the Rome trough [1]. Previous correlations between the MSS and the “basal sandstone” of the Rome trough have been invalidated [10]. Although the MSS contains trace fossils, it lacks identifiable body fossils, thus its precise age is uncertain. Trilobites in the units overlying the MSS are early Late
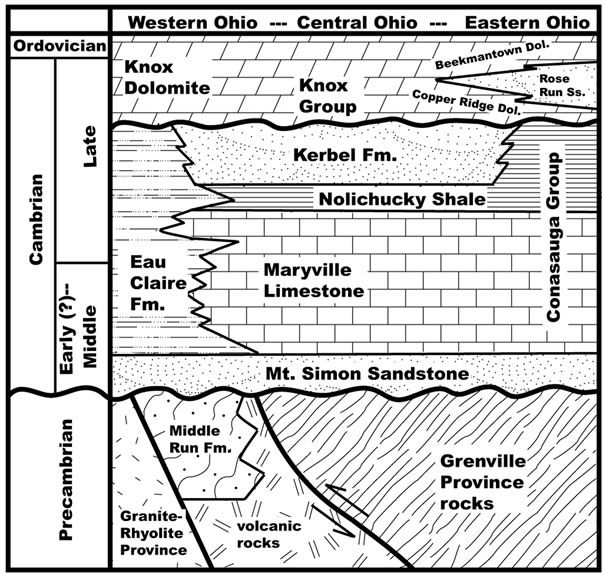
Figure 2. Stratigraphic relationships of Precambrian and Cambrian rocks in Ohio, modified from [1,7,17].
Cambrian in age; thus the MSS is considered Middle(?)- Late Cambrian in age [6,9,11].
Previous workers have interpreted the MSS depositional environment as nearshore marine [12]. The unit is frequently explained as a transgressive lag deposit or blanket sandstone [7]. At surface exposures in Wisconsin, the MSS has been interpreted as a tidally-influenced, progradational, shoalingand fining-upward sequence [13] and as due to migration of a siliciclastic barrier complex [14]. In contrast, subsurface work in Michigan has emphasized the glauconite content and types of biogenic structures [15] and hummocky stratification [16] to infer a deeper water marine setting.
As the Cambrian transgression continued, the MSS was overlain by interbedded fine-grained, bioturbated sandstone, siltstone, shale, and dolostone. In western Ohio and further west, these deposits are called the Eau Claire Formation, while similar deposits in the Appalachian Basin are called the Conasauga Group [1,17,18]. In the Appalachian Basin, the overlying Kerbel Formation (Figure 2) is interpreted as a coarsening-upward deltaic facies [7]. The Eau Claire Formation-Conasauga Group show evidence for prodelta facies related to deposition of the main delta facies of the Kerbel Formation. The craton in Ohio was completely inundated by Late Cambrian, when the Knox Dolomite was deposited across the region [7].
The MSS is an economically important unit to understand for several reasons. First, the unit is currently used to host a number of Class-I hazardous waste injection wells in Ohio [19]. Second, the MSS is considered part of the Precambrian-Cambrian total petroleum system in the Appalachian [20], Michigan [21] and Illinois basins [22]. In the Appalachian Basin, seismic lines document stratigraphic pinchouts, fault offsets, and minor folds in the MSS and the equivalent Potsdam Formation [10]. Structures have been interpreted as related to reactivation of Precambrian structures associated with the Grenville Orogeny. In the Innerkip Oil Field (Oxford County, Ontario, Canada), the Potsdam Formation has average neutron-porosity log values of 9.5% (range 3.5% - 22%) and average permeability of 1 milliDarcy (mD) according to [10]. In portions of the Illinois Basin, where the MSS is used as a gas storage reservoir, three-dimensional modeling shows shale interval baffles and porosity variation, but there are no laterally extensive shales to compartmentalize the reservoir [23]. Finally, the MSS has sufficient thickness, porosity, burial depth, and caprock characteristics to serve as a potential CO2 sequestration reservoir in western Ohio, the southern part of the Michigan Basin, and Illinois Basin [24] and southern Ontario [25].
2. Material and Methods
2.1. Core Data
This study is based on two boreholes: DGS-2627 drilled in Warren County, Ohio, by the Ohio Division of Geological Survey (ODGS) and BP-4 drilled in Allen County, Ohio by BP Corporation (Figure 1). Drill core from both wells was accessed at the Horace R. Collins Laboratory operated by the Ohio Division of Geological Survey, Department of Natural Resources (ODNR) at Alum Creek State Park near Columbus, Ohio. After identifying lower and upper stratigraphic contacts of the MSS in both cores, samples were collected from the MSS and underlying and overlying units. These hand specimens were described for lithology, composition, texture, and sedimentary structures using a binocular microscope. In addition, 37 thin sections were prepared using standard techniques, then each was point counted (200 - 300 grains per slide) using standard techniques [26]. Blue-stained epoxy was used to facilitate identifying and quantifying porosity void spaces. In this study most existing porosity is secondary (dissolved or corroded grains).
Graphical core logs at a 1:20 scale were prepared for the each core, based on descriptive information from individual core segments examined under the binocular microscope, point counts made from thin-sections, and mosaics of core photographs that were digitally enhanced. Various graphical design software programs were utilized to draft the graphical core logs [27]. These plots were used for describe and interpret lithofacies and microfacies.
2.2. Geophysical Logs
Gamma-ray and neutron-porosity logs are available for each of the wells. The logs are available in ASCII standard (LAS) format files on the ODGS website (www. ohiogeology.com). After downloading the appropriate files, they were converted into graphical logs using LogPlot® version 2001 software. For each 3-m portion of the graphical log, a separate floating (1:150 scale) images were made. These were moved up or down the geophysical log profile to find the position of best fit. Calibration of the geophysical logs to the graphical core logs was necessary to account for differential stretching of the geophysical tool cable compared to the drill stem, which produced about 3-m difference in these cores [27,28]. This calibration method also helped clarify that while the core itself produced resolvable features on a millimeter scale, the geophysical logs had mean resolution of approximately 0.3-m.
2.3. Subsurface Facies Model
Well DGS-2627 was selected as the standard for creating a subsurface facies model. Interpretations of the depositional environments in DGS-2627 were based on analysis of lithofacies and microfacies, facies assemblages, facies sequences, and geophysical logs. Next, BP-4 was initially evaluated and interpreted based solely upon geophysical logs using the subsurface facies model from DGS-2627. Finally, the predicted interpretations in BP-4 were compared to the actual core data, and the model calibrated. This approach created a robust subsurface facies model that can be used in future studies of the MSS from other wells where only geophysical logs are available.
3. Results
3.1. Lithology
The MSS in DGS-2627 was found to have unique lithological characteristics that make it readily distinguishable from the underlying Precambrian Middle Run Formation and the overlying Cambrian Eau Claire Formation (Figures 3(A) and (B)). Generally, the MSS is a planar laminated or cross bedded, well sorted, subrounded to well rounded, coarseto very coarse-grained, siliceous quartz arenite (Figure 3(C)). There are minor amounts of quartz granule conglomerate, siltstone, and mudstone (Figure 3(D)). Thin mudstone interbeds between sandstones are interpreted as drapes (Figure 3(E)). Observed small-scale sedimentary structures include tidal rhythmites, flaser bedding, lenticular bedding, wavy bedding, and small-scale herringbone cross-bedding. Some larger-scale features can be inferred, such as hummocky stratification, reactivation surfaces, and tidal bundles. Observed biogenic sedimentary structures include Skolithos, Diplocraterion, Arenicolites, and Monocraterion.

Figure 3. Petrography of: (A) The Precambrian Middle Run Formation; (B) The Cambrian Eau Claire Formation, and (C-E) the Cambrian Mt. Simon Sandstone. Scale bar is 100 microns. Abbreviations—LC = line contact, PC = point contact, c = chert, fr = ferruginous rim, g = glauconite, kfs = K-feldspar, og = overgrowth, vrf = volcanic rock fragment.
The sandstones mostly consist of individual quartz grains with ferruginous rims and syntaxial quartz overgrowths. Grain contacts are mostly point contacts (Figure 3(C)). Porosity was found to range from 5% - 11% (Figure 3(D)), which is similar to estimates from other studies [29].
In contrast, the underlying Precambrian Middle Run Sandstone consists of moderately sorted, fineto medium-grained, reddish-brown, siliceous lithic arenite, with minor conglomerate and shale (Figure 3(A)). Clasts consist of quartz, chert, potassium feldspar, volcanic rock fragments (mostly rhyolite) and metamorphic rock fragments (mostly quartzite). Grain contacts are mostly line or embayed contacts. Cements include syntaxial quartz overgrowths and K-feldspar overgrowths. The Middle Run Formation is highly indurated, and porosity is typically <1%.
The overlying Eau Claire Formation consists of laminated to massive, fine-grained, poorly sorted, dark greengray, argillaceous, glauconitic feldspathic wacke, siltstone, and shale (Figure 3(B)). The sandstone varies from slightly bioturbated to extensively bioturbated, the latter having a distinctive burrow-mottled appearance. In the sandstone intervals, matrix includes abundant angular to sub-angular quartz silt, which may be eolian in origin. The Eau Claire Formation is distinctive from the MSS because it is finer-grained, greenish, and both body and trace fossils are common.
3.2. Stratigraphy
In DGS-2627 the contact between the Middle Run Formation and MSS is a planar unconformity. The boundary is marked on geophysical logs by a notable increase in gamma ray and neutron-porosity log responses across the boundary (Figure 4). The increased gamma-ray response at the base of the MSS is attributed to an increase in 40K due to the presence of potassium feldspar (K-feldspar) in the lower part of the MSS. This local enrichment in K-feldspar may have been derived from erosion of the underlying Middle Run Formation. The neutron-porosity
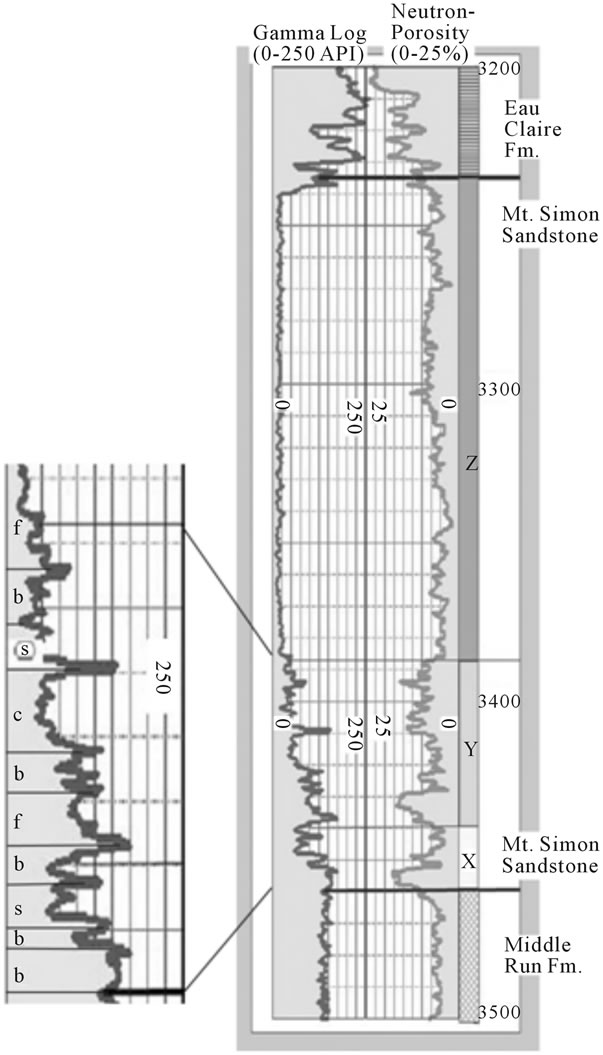
Figure 4. Gamma-ray and neutron-porosity logs of well DGS-2627 through the upper Middle Run Formation, Mt. Simon Sandstone, and lower Eau Claire Formation. Geophysical log units X, Y, Z are informal designators for geophysical log response packages in the Mt. Simon Sandstone.
increase is attributed to higher porosity in the MSS due to better sorting compared to the matrix-rich sedimentary rocks in the Middle Run Formation.
The contact between the MSS and overlying Eau Claire Formation is gradational over approximately 0.5 m (Figure 4). Within the transition zone, the sediments become finer grained and more intensely bioturbated up core. The contact is well marked by an increase in the gamma-ray log attributed to an increase in shale, glauconite, and K-feldspar content in the lower part of the Eau Claire Formation (Figure 3(B)).
In DGS-2627, the stratigraphy of the MSS can be informally divided into three units which were matched to geophysical responses and correlated between wells (Figure 4). The lower unit has a thickness of about 5.7-m and is dominated by packages of finingand thinningupward conglomerate and coarse-grained sandstone. The middle unit is about 16-m thick and is dominated by heterolithic sandstone and mudstone with tidal sedimentary structures and biogenic sedimentary structures. The upper unit is about 47-m thick and is dominated by coarse-grained sandstone with planar lamination, smallscale herringbone cross-bedding, and sporadic escape burrows.
3.3. Facies Analysis
Analysis of the core from DGS-2627 identified eight individual lithofacies, which are combinations of lithology, composition, textures, and sedimentary structures. The eight lithofacies identified from the MSS are given in Table 1.
3.3.1. Tidally-Influenced Heterolithic Sandstone and Mudstone (Lithofacies T1 and T2)
Lithofacies T1 consists of thin (typically <10 cm thick) sequences of reddish-brown heterolithic siltstone and mudstone with planar lamination (Figure 5(A)). Sets of laminae commonly display double-mud drapes. Individual burrows of Skolithos or Diplocraterion are common. Lithofacies T1 and T2 are frequently interbedded and/or cap sequences of sandstone and conglomerate.
Lithofacies T2 consists of thicker (typically 10 - 80 cm thick) sequences of reddish-brown, heterolithic, very fine-grained sandstone and mudstone (Figure 5(B)). Small-scale sedimentary structures, such as ripple lamination, flaser bedding, wavy bedding, and lenticular bedding are common. Packages of heterolithic sandstone and mudstone are often separated by thicker intervals of mudstone. Discrete, single burrows of Skolithos and Diplocraterion are common.
Both lithofacies T1 and T2 are interpreted as tidalites (tidal rhythmites). Tidal rhythmites form as a result of the regular alternation of currents capable of bedload transport with intervals of slackwater conditions where mudstone drapes are deposited [30-32]. Both facies represent tidally-influenced, low-energy environments such as a lagoon, estuary, or bay. Sequences of flaser, wavy, or lenticular bedding separated by thicker intervals of mud drapes are interpreted as tidal bundles [30,33]. There is a complete absence of emergence structures such as mudcracks or brecciation. Thus, both facies are interpreted to represent tidally-influenced, low-energy, subtidal environments such as portions of a lagoon, estu-

Table 1. Mt. Simon sandstone lithofacies descriptions.
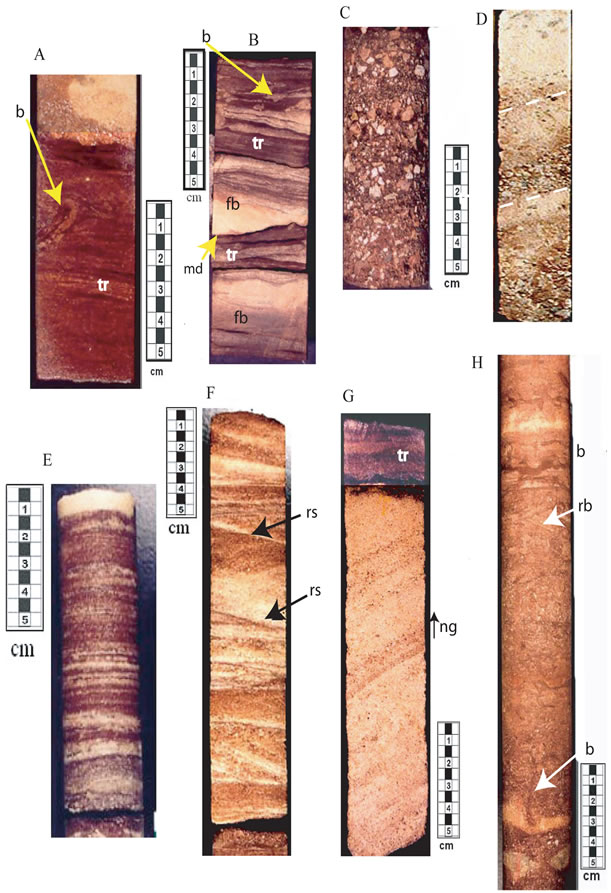
Figure 5. Lithofacies in the Mt. Simon Sandstone. (A) Lithofacies T1 (b = burrow); (B) Lithofacies T2, showing tidal rhythmites (tr) and flaser bedding (fb); (C) Lithofacies C1; (D) Lithofacies C2 showing cross-bed sets with normal grading; (E) Lithofacies B1; (F) Lithofacies B2 showing low-angle truncations and reactivation surfaces (rs); (G) Lithofacies B3 showing cross-bedding sets with normal grading (ng); (H) Lithofacies B4 showing burrows (b) Scale bars shown.
ary, or bay. The relatively low abundance of burrows may indicate high sedimentation rates or restricted water conditions. Lithofacies T1 and T2 form a small part of the total thickness of the MSS, and are mostly in the lower part of the section, although thin intervals of tidalites cap fining-upward sandstone sequences throughout the MSS.
3.3.2. Conglomeratic Sandstone (Lithofacies C1 and C2)
Lithofacies C1 consists of massive to inclined planar bedded, very coarse-grained, pebbly quartz arenite (Figure 5(C)). The gravel component ranges from granules to fine pebbles in size. Gravel clasts are well rounded quartz, chert, and minor feldspar. Clasts can be clumped into centimeter-scale scoop-like scours (“pocket structures”). Lithofacies C1 and C2 commonly form finingupward sequences 0.3 - 0.5 m thick that are commonly amalgamated into coarse-grained beds 0.8 - 1.3 m thick. Bioturbation was not observed in this facies.
Lithofacies C2 consists of festoon cross-bedded, coarseto very coarse-grained, pebbly quartz arenite (Figure 5(D)). The characteristic features of this facies are the fining-upward sequence and upward decrease in crossbed angle. Relatively frequent reversals in cross-bed direction suggest herringbone cross-stratification. This facies also contains the pocket structures described in lithofacies C1, and has discrete Skolithos burrows. Bedding sequences are organized into an erosional surface, overlain by lithofacies C1, overlain by lithofacies C2, and then an abrupt decrease in grain size in the overlying deposits (lithofacies T1, T2, or B1).
Lithofacies C1 and C2 are interpreted as upper shoreface and beachface deposits representing the breaker, surf, and swash zones. The crude inclined planar stratification in lithofacies C1 probably represents beachface stratification under changing energy conditions, while the festoon cross-bedding in lithofacies C2 probably represents sedimentation in the breaker zone or in small channels in the upper shoreface [34,35]. Small scours and pocket structures form in the upper shoreface from wave interference or wave focusing. Tidal influence is evident in cross-bedding reversals. Amalgamated sequences of lithofacies C1 and C2 are interpreted as repeated migration of breaker bars onto the shoreface [36].
3.3.3. Bedded Sandstone (Lithofacies B1, B2, B3, and B4)
Lithofacies B1 consists of fineto very coarse-grained quartz arenite that is typically planar laminated in bedsets about 2.5 cm thick, but may include thin bundles of herringbone cross bedding, ripple lamination, wavy bedding, or wavy cross bedding (Figure 5(E)). There are sporadic paper-thin mudstone drapes and mudstone intraclasts. The organization of lithofacies B1 into finingand thinning-upward bedsets suggests tidal influence [37].
Lithofacies B2 consists of small-scale cross-bedded or herringbone cross bedded, mediumto very coarse-grained quartz arenite with local ripple-laminated fine-grained sandstone interbeds (Figure 5(F)). The sandstones locally contain mudstone intraclasts, coarser-grained lag deposits, mudstone drapes and different types of bioturbation (Skolithos, Arenicolites, and Diplocraterion). Litho-facies B2 is organized into tidal bundles consisting of cross-bed sets separated by bounding surfaces with mudstone drapes or ripple laminated sandstone that show flow reversal from the cross bed sets. Alternatively, amalgamated sandstones show herringbone cross bedding. Tidal bundles are interpreted as evidence for bedform translation in one direction during the dominant tide, followed by bedform modification and/or draping during slackwater conditions, with further modification and possibly translation of smaller bedforms in a reversed direction during the subordinate tide [38,39]. Re-establishment of dominant tide conditions can also led to development of a reactivation surface within a cross-bed set [40].
Lithofacies B3 consists of larger-scale (up to 1 m thick) sets of planar-tabular cross-bedded, coarseto very coarse-grained quartz arenite with local granule conglomerate laminae at the base of cross-bed sets (Figure 5(G)). Individual cross beds are fining-upward sequences. Many of the features described in B2 are present in this facies, including mudstone drapes, intraclasts, tidal bundles, reactivation surfaces, and escape burrows.
Lithofacies B4 consists of massive, bioturbated fineto medium-grained sandstone with an abundance of Skolithos, Arenicolites, Diplocraterion, and Monocraterion burrows (Figure 5(H)). The massive character of these deposits and abundant burrows suggests biogenic destratification, ranging from numerous discrete burrows to burrow mottling.
The four lithofacies are commonly associated into amalgamated sequences 1 - 5 m thick that are common in the upper part of the MSS. Collectively, these bedded sandstones represent a sandy environment with asymmetric (dominant-subordinate) tidal influence, and intervals of extensive re-colonization by organisms. These probably represent tidal inlet channels and adjacent sand flat and mixed flat environments [41]. The commonly observed sequence of lithofacies B1, B2, and B3 (in ascending order) probably represents a transition from sand flat to tidal inlet environments, resulting in larger structures (height of cross-bed sets) and coarser grain size. In contrast, lithofacies B4 occurs sporadically throughout the MSS, representing biogenic reworking of the original sandy materials.
4. Discussion
4.1. Depositional Environment
The interpretation of depositional environment in DGS- 2627 is based on the analysis of individual lithofacies from core and the gamma-ray log patterns (Table 2 and Figure 6). The neutron-porosity log was used to supplement some of the interpretations. Gamma-ray responses can be characterized as bell shapes (fining upward), funnel shapes (coarsening upward), symmetrical (coarsening then fining upward), cylindrical (“clean” sands), or irregular (interbedded sandstone and shale) [42].
The basal portion of the MSS in DGS-2627 is conglomerate-rich, with stacked sequences 0.3 - 1.0 m thick consisting of scoured surfaces overlain by festoon cross-bedded pebbly sandstones (lithofacies C2) overlain by massive or inclined planar bedded granule conglomerates or pebbly sandstones (lithofacies C1). The sequence is interpreted as upper shoreface gravelly sands (Figure 6), based on the festoon cross-bedding, inclined planar stratification, the presence of scours, pocket
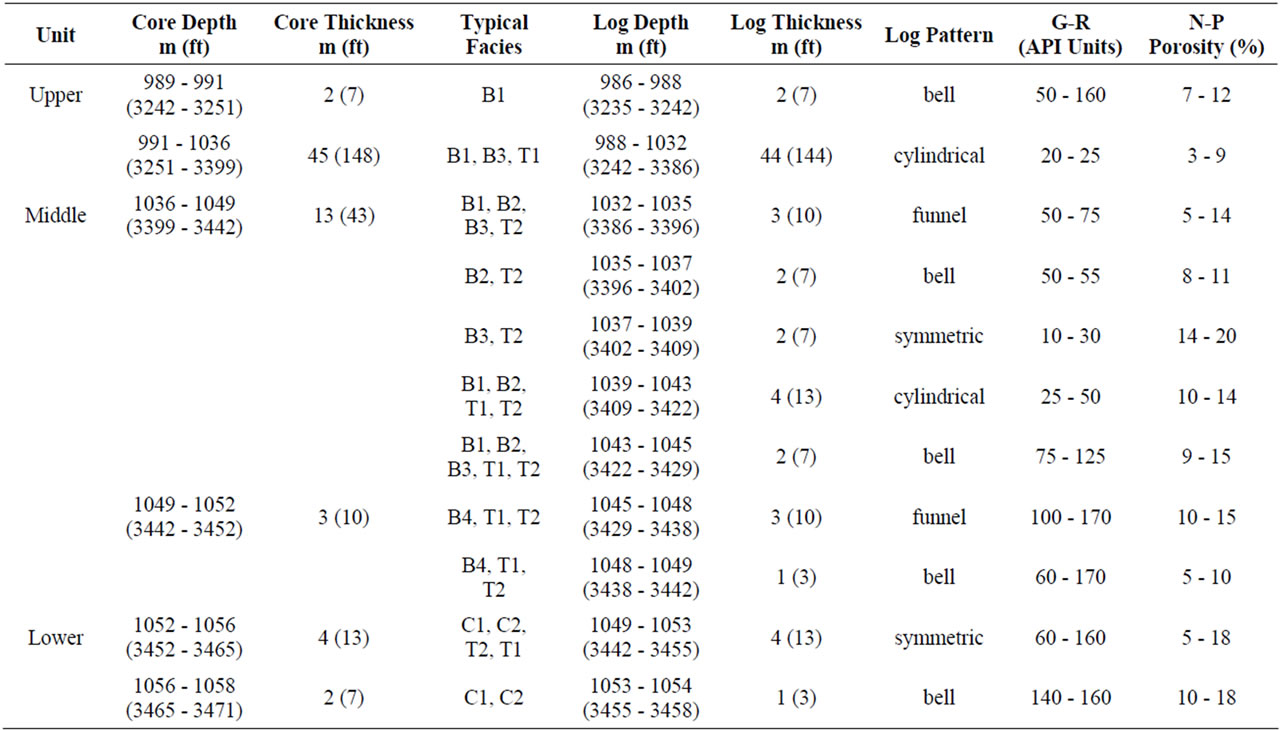
Table 2. Geophysical properties and log patterns for well DGS-2627.
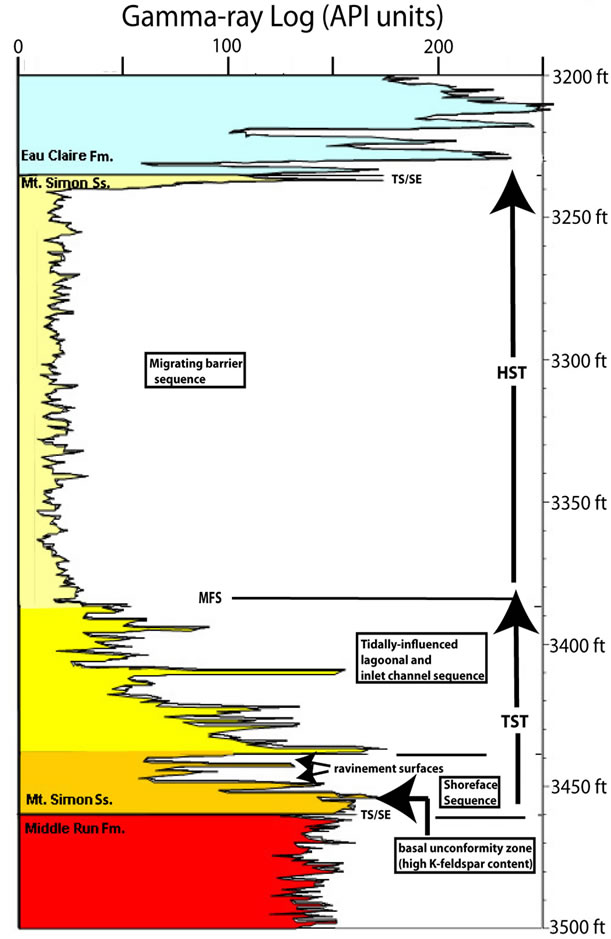
Figure 6. Geophysical log model for the Mt. Simon Sandstone in DGS-2627.
structures (erosional scours in sandstone infilled by conglomerate), intraclasts, and rare escape burrows. The pebbly sandstones are occasionally interbedded with mudstones, siltstone, and fine-grained sandstone couplets interpreted previously as tidal rhythmites (Lithofacies T1 and T2). Notable scoured and conglomerate-rich intervals are interpreted as ravinement surfaces and related deposits. The interpreted ravinement surfaces are easily noted on the gamma-ray log (Table 2, Figure 6). The basal contact with the underlying Middle Run Formation is a scoured surface, and the incorporation of lithic clasts and K-feldspar from the Middle Run Formation into the lower MSS allows recognition of a transgressive surface of erosion (TSE), as shown (Figure 6).
The middle portion of the MSS is strongly heterolithic, consisting of singleand multi-story sandstones up to 2-m thick interbedded with sequences of tidal rhythmites ranging from <1 cm to about 1 m thick. Tidal structures such as rhythmites, flaser-, wavy-, and lenticular bedding, tidal bundles, reactivation surfaces, and herringbone cross-bedding are common. Decimeter-scale planar-tabular cross-bedding contains reactivation surfaces, intraclasts, centimeter-scale ripple lamination, and is organized into tidal bundles. The alternation of coarseand fine-grained sedimentary rocks is easily noted on the gamma-ray log as primarily a series of alternating bell and funnel shapes (Table 2, Figure 6). The smaller-scale packages of rhythmically bedded sandstones, siltstones, and mudstones are organized into a larger-scale coarsening-upward sequence (funnel shape) about 20 m thick. This sequence is interpreted as a transition from tidallyinfluenced lagoon (mud flat, mixed flat, and sand flat sub-environments) to tidal inlet channel (Figure 6).
The upper portion of the MSS is sandstone-rich, consisting of repetitive planar-bedded and small-scale trough or festoon cross-bedded sandstone or bioturbated sandstone. Certain intervals contain multistory, planar-tabular cross-bedded sandstone up to 2 m thick. Thin (generally <1 cm thick) tidal rhythmites packages are found interbedded with these sandstones. The gamma-ray log shows an overall cylindrical (“clean sandstone”) shape 44 m thick (Table 2, Figure 6). Lithologically, these deposits are very similar to the middle portion of the MSS, however the fine-grained deposits are thinner. The continued importance of tidal structures and bioturbation suggests that the upper portion of the MSS represents as a succession of tidal inlet channels, however the lack of vertical or lateral overall facies changes suggests this upper portion of the MSS represents the shoreline-parallel movement of a migrating barrier-inlet sequence [43]. The transition from the middle portion of the MSS to the upper portion is accordingly interpreted as a maximum flooding surface (Figure 6). The upper contact with the overlying Eau Claire Formation is erosional, and is recognized as a transgressive surface of erosion (TSE) in accord with the superposition of deeper-water deposits above the MSS (Figure 6).
An alternative explanation for the upper part of the MSS would be that the sandstones represented marine sandwave complexes on a wave-influenced shallow marine shelf [44]. While this explanation would resolve questions about the thickness of the upper part of the MSS and lack of vertical trends, there are several problems with this explanation. These problems include: lack of evidence for large-scale bedforms, continued dominance of tidal structures, minimal appearance of hummocky stratification, and lack of glauconite. However, it is possible that larger-scale bedforms could not be discerned from core and log data.
The barrier-inlet depositional model is summarized by [43]. The coastline-parallel migration of the barrier-inlet channel results in a fining-upward sequence of mostly planar or cross-bedded sandstone with a thinning-upward trend in cross-bed thickness. The sequence is characterized by an erosional base and dominated by sand facies of tidal-channel and marginal spit-beach environments. In the subsurface, the facies transition is projected to form an abrupt bell-shaped gamma-ray log [43]. These descriptions match the sequence in the upper portion of the MSS. The complete MSS sequence is similar to the inlet/spit-dominated coast model of [45]. However, examples of modern barrier-inlet sequences are much thinner, typically <20 m thick [37], compared to the upper portion of the MSS (about 47 m thick). It is not clear why the upper portion of the MSS is so thick. Core data does not show any evidence for amalgamation or repetition of sequence. Possibly the thickness of the upper portion of the MSS reflects vertical aggradation due to a balance between eustasy and sediment supply.
4.2. Correlation between Wells
4.2.1. Geophysical Log Model for DGS-2627
Table 3 shows an evaluation of the geophysical log character of DGS-2627, including the match of diamond drill core depth and interval thickness to log depth and interval thickness, and assigned lithofacies for these intervals. The two geophysical logs are presented in Figure 4 and matched to interpreted depositional environment as shown in Figure 6, there was an excellent match between lithofacies based on diamond drill core and the geophysical log responses for the matching intervals. Various lithofacies and facies assemblages could be grouped to form units or sub-units with predictable log response and log pattern, such as fining-upwards trends corresponding to bell-shaped gamma-ray log responses, or coarsening-upward trends corresponding to funnelshaped gamma-ray log responses.
The most important outcome of the geophysical log model for DGS-2627 is the recognition of three log-response units, labeled X, Y, and Z (Figure 4). Log-response unit X represents the base of the MSS, is coarsegrained, about 5 - 6 m thick, and consists mostly of multiple bell-shaped gamma-ray log responses. One complication is that the lower 1 - 2 m of the MSS contains


Table 3. Comparison of log patterns for wells DGS-2627 and BP-4.
abundant reworked K-feldspar from the underlying Middle Run Formation, thus it has a high gamma-ray response that does not indicate shaliness, unlike the rest of the MSS. Log-response unit Y represents the middle portion of the MSS, is heterolithic, consisting of multiple sandstone-mudstone couplets, has an overall thickness of 16 - 17 m, and consists of repetitive bell-funnel or bellcylindrical gamma-ray log shapes. Log-response unit Z represents the upper portion of the MSS, is sandy with thin shale partings, has an overall thickness of 46 - 47 m, and has an overall cylindrical gamma-ray log shape. The low gamma-ray response for log response unit Z is due to the clean quartz content of the sandstones in this interval.
4.2.2. Correlation to BP-4
Borehole BP-4 is located about 125 km north of DGS- 2627, in Allen County, Ohio (Figure 1). Geologists working for BP interpreted the boundary between the Middle Run Formation and MSS at 961 m and between the MSS and Eau Claire Formation at 857 m. However, the upper boundary does not appear to match correlation of gamma-ray logs (Figure 7). Accordingly, it is proposed

Figure 7. Log correlation of DGS-2627 and BP-4.
to redefine the MSS-Eau Claire Formation contact at 900 m in BP-4. The geophysical log model developed for DGS-2627 was projected BP-4, as shown conceptually (Figure 8). Based upon gamma-log response, BP-4 is divided into three units that correspond to the log-response units in DGS-2627 (Table 3).
There are differences and similarities in log responses between the two wells. In both wells, the basal unit is characterized by bell shapes overlain by a symmetrical shape, and the thickness of this lower unit is relatively consistent at 5 - 7 m. The middle unit for both wells mostly consists of alternating bell shapes and funnel shapes, with some differences in repetition The thickness of the middle unit changes from 17 m in the DGS-2627 well to 21 m in the BP-4 well. The most significant change is in the upper unit. The sequence in DGS-2627 is dominated by a 44 m thick, monotonous cylindrical log response, but the upper unit in BP-4 is significantly thinner (33 m thick) and has greater log response variety. It is nevertheless recognizable by its 18 m thick cylindrical gamma-ray log response at the base of the upper unit.
Based upon the log model for DGS-2627, the probable lithofacies sequences were predicted for BP-4 (Figure 8). Subsequent examination of the BP-4 drill core confirmed these predictions, specifically that the lower unit consists of lithofacies C1, C2, T1, and T2; that the middle unit

Figure 8. Revised interpretation of BP-4 based on the use of the log model created from DGS-2627. See text for discussion.
consists of repetitious heterolithic sequences consisting of lithofacies B1, B2, B3, T1 and T2 with numerous examples of tidal structures; and that the upper unit is sandstone-rich and dominated by lithofacies B1, B2, B3, and B4. The only significant difference was that the top of the upper unit is almost exclusively lithofacies B4 (bioturbated sandstone). This is interpreted as indicating a more gradational contact with the extensively bioturbated Eau Claire Formation in BP-4 than in DGS-2627.
5. Summary and Conclusion
This study of the subsurface facies of the Cambrian Mt. Simon Sandstone (MSS) in western Ohio utilized drill core and geophysical logs. The MSS unconformably overlies the Precambrian Middle Run Formation, with a thin basal conglomerate, and a gamma-ray log response matching reworked K-feldspar clasts. The MSS primarily consists of planar bedded, festoon cross-bedded, or planar-tabular cross-bedded, moderately sorted, rounded, coarseto very coarse-grained siliceous quartz arenite with minor amounts of heterolithic sandstone-mudstone couplets (tidal rhythmites) and quartz granule conglomerate or pebbly sandstone. Structures indicative of tidally-influenced, shallow marine settings are ubiquitous, and include tidal rhythmites, lenticular-, flaser-, and wavy-bedding, herringbone cross-bedding, mud-drapes, tidal bundles, reactivation surfaces, intraclasts, and bioturbation. Core data from DGS-2627 and BP-4 concur that the lower part of the MSS represents shoreface environments; the middle portion is consistent with mostly sandy tidal flat and tidal channels; and the upper portion is consistent with a migrating barrier-inlet sequence. The overall MSS succession is representative of coastal response to continuous transgression [46], terminating upward in extensively bioturbated sandstones and a gradational contact with the offshore deposits of the Eau Claire Formation. The geophysical log model developed for DGS-2627 could be used to correlate the three units described above and predict the lithofacies found in BP-4, as confirmed by subsequent evaluation of diamond drill core from that well.
6. Acknowledgements
We wish to thank the Ohio Department of Natural Resources, Division of Geological Survey, for access to the drill cores and geophysical logs used in this study. We especially wish to thank Mark T. Baranoski, Gregory A. Schumacher, and Ronald G. Rea of the Ohio Geological Survey. We are indebted to the helpful suggestions of Charles F. Kahle and Charles M. Onasch at Bowling Green State University, and the assistance with photomicrographs by William Butcher (BGSU). Previous versions of the manuscript were improved by comments from two anonymous reviewers.
REFERENCES
- R. T. Ryder, C. S. Swezey, R. D. Crangle Jr. and M. H. Trippi, “Geologic Cross Section E-E’ through the Appalachian Basin from the Findlay Arch, Wood County, Ohio to the Valley and Ridge Province, Pendleton County, West Virginia,” USGS Scientific Investigation Map 2985, Cross Section, 2008, 48 p.
- M. T. Baranoski, “Structural Contour Map on the Precambrian Unconformity Surface in Ohio and Related Basement Features,” Ohio Division of Geological Survey, Map PG-23, 2002, 18 p.
- M. T. Baranoski, S. L. Dean, J. L. Wicks and U. M. Brown, “Unconformity-Bound Seismic Reflection Sequences Define Grenville-Age Rift System and Foreland Basins Beneath the Phanerozoic in Ohio,” Geosphere, Vol. 5, No. 2, 2009, pp. 140-151. doi:10.1130/GES00202.1
- J. E. Lucius and R. R. B. Von Frese, “Aeromagnetic and Gravity Anomaly Constraints on the Crustal Geology of Ohio,” Geologic Society of America Bulletin, Vol. 100, 1988, pp. 104-116. doi:10.1130/0016-7606(1988)100<0104:AAGACO>2.3.CO;2
- N. P. James, R. K. Stevens, C. R. Barens and I. Knight, “Evolution of a Lower Paleozoic Continental Margin Carbonate Platform, Northern Canadian Appalachians: Controls on Carbonate Platform and Basin Development,” In: P. D. Crevello, J. L. Wilson, J. F. Sarg and J. F. Read, Eds., The Control on Carbonate Platform and Basin Development, SEPM Special Publication 44, 1989, pp. 124-146.
- M. C. Hansen, “The Geology of Ohio—The Cambrian,” Ohio Geology, 1997, pp. 1-5.
- A. Janssens, “Stratigraphy of the Cambrian and Ordovician Rocks in Ohio,” Ohio Geological Survey Bulletin, Vol. 64, 1973, 197 p.
- R. H. Shaver, C. H. Ault, A. M. Burger, D. D. Carr, J. B. Droste, D. L. Eggert, H. H. Gray, D. Harper, N. R. Hasenmueller, W. A. Hasenmueller, A. S. Horowitz, H. C. Hutchison, B. D. Keith, S. J. Keller, J. B. Patton, C. B. Rexroad and C. E. Weir, “Compendium of Paleozoic Rock-Unit Stratigraphy in Indiana—A Revision,” Indiana Geological Survey Bulletin, Vol. 59, 1986, pp. 1-2.
- R. T. Ryder, A. G. Harris and J. E. Repetski, “Stratigraphic Framework of Cambrian and Ordovician Rocks in the Central Appalachian Basin from Medina County, Ohio, through Southwestern and South-Central Pennsylvania to Hampshire County, West Virginia,” USGS Bulletin 1839-K, 1992, 32 p.
- D. C. Harris and M. T. Baranoski, “Cambrian Pre-Knox Group Play in the Appalachian Basin,” Ohio Geological Survey Information Circular, Vol. 60, 1997, pp. 1-26.
- L. E. Babcock, “Biostratigraphic Significance and Paleogeographic Implications of Cambrian Fossils from Deep Core, Warren County, Ohio,” Journal of Paleontology, Vol. 68, No. 1, 1994, pp. 24-30.
- M. E. Ostrom, “Cambrian Stratigraphy in Wisconsin,” Wisconsin Geological and Natural History Survey Information Circular, Vol. 7, 1966, pp. 1-79.
- S. G. Driese, C. W. Byers and R. H. Dott Jr., “Tidal Deposition of the Basal Upper Cambrian Mt. Simon Sandstone in Wisconsin,” Journal of Sedimentary Petrology, Vol. 51, 1981, pp. 367-381.
- J. W. Hagedorn, R. H. Dott Jr. and D. Damrow, “Stranded on a Late Cambrian Shoreline: Medusa from Central Wisconsin,” Geology, Vol. 30, No. 2, 2002, pp. 147-150. doi:10.1130/0091-7613(2002)030<0147:SOALCS>2.0.CO;2
- J. T. Cottingham, “Cambrian-Early Ordovician Sequence Stratigraphy and Mt. Simon Sandstone Petrology in the Michigan Basin,” M.Sc. Thesis, Western Michigan University, Kalamazoo, 1990, 87 p.
- H. G. Reading and J. D. Collinson, “Clastic Coasts,” In: H. G. Reading, Ed., Sedimentary Environments, Processes, Facies, and Stratigraphy, Blackwell Scientific Publishing, Oxford, 1996, pp. 154-231.
- D. C. Harris, J. A. Drahovzal, J. G. Hickman, B. C. Nutthall, M. T. Baranoski and K. L. Avary, “Rome Trough Consortium Final Report and Data Distribution,” Kentucky Geological Survey Series 12, Open-File Report 04-0006, 2004.
- C. S. Swezey, “Regional Stratigraphy and Petroleum Systems of the Michigan Basin, North America,” USGS Scientific Investigation Map 2978, 2008.
- M. T. Baranoski, R. A. Riley and M. E. Wolfe, “Cambrian-Ordovician Knox Unconformity Play,” In: J. B. Roen and B. J. Walker, Eds., Atlas of Major Appalachian Gas Plays, West Virginia Geological and Economic Survey, Publication V-25, 1996, pp. 181-188.
- USGS, “Assessment of Undiscovered Oil and Gas Resources of the Appalachian Basin Province 2002,” USGS Fact Sheet FS-009-03, 2003, 2 p.
- USGS, “Assessment of Undiscovered Oil and Gas Resources of the US Portion of the Michigan Basin 2004,” USGS Fact Sheet 2005-3070, 2004, 2 p.
- USGS, “Assessment of Undiscovered Oil and Gas Resources of the Illinois Basin 2007,” USGS Fact Sheet 2007-3058, 2007, 2 p.
- H. E. Leetaru and D. G. Morse, “Characterization of the Mt. Simon Sandstone Gas Storage Reservoirs at Herscher and Herscher Northwest Fields, Kankakee County, Illinois [Abstract],” Geological Society of America Abstracts with Programs, Vol. 41, No. 4, 2007, p. 4.
- N. Gupta, B. Sass, S. Chattopadhyay, J. Sminchak, P. Wang and T. Espie, “Geologic Storage of CO2 from Refining and Chemical Facilities in the Midwestern US,” Energy, Vol. 29, No. 9-10, 2004, pp. 1599-1609. doi:10.1016/j.energy.2004.03.062
- A. Safeen, E. Croiset, P. L. Douglas and I. Chatzis, “CO2 Sequestration in Ontario, Canada. Part I: Storage Evaluation of Potential Reservoirs,” Energy Conversion and Management, Vol. 45, No. 17, 2004, pp. 2645-2659. doi:10.1016/j.enconman.2003.12.003
- W. R. Dickinson and C. A. Suczek, “Plate Tectonics and Sandstone Compositions,” American Association of Petroleum Geologists Bulletin, Vol. 63, No. 12, 1979, pp. 2164-2182.
- A. Saeed, “Subsurface Facies Analysis of the Cambrian Mt. Simon Sandstone in Western Ohio,” M.Sc. Thesis, Bowling Green State University, Bowling Green, 2002, 167 p.
- D. L. Shrake, P. J. Wolfe, B. H. Richard, E. M. Swinford, L. H. Wickstrom, P. E. Potter and G. W. Sitler, “Lithologic and Geophysical Description of a Continuously Cored Hole in Warren County, Ohio, Including Description of the Middle Run Formation (Precambrian?) and a Seismic Profile across the Core Site,” Ohio Geological Survey, Information Circular 56, 1990, 11 p.
- M. T. Heald and G. F. Baker, “Diagenesis of the Mt. Simon and Rose Run Sandstones in western West Virginia and Southern Ohio,” Journal of Sedimentary Petrology, Vol. 47, No. 1, 1977, pp. 66-77.
- J. H. J. Terwindt, “Origin and Sequences of Sedimentary Structures in Inshore Mesotidal Deposits of the North Sea,” In: S. D. Nio, R. T. E. Shuttenhelm and T. C. E. van Weering, Eds., Holocene Marine Sedimentation in the North Sea Basin, International Association of Sedimentologists, Special Publication 5, 1981, pp. 4-26.
- E. P. Kvale and A. W. Archer. “Characteristics of Two Pennsylvanian-Age Semidiurnal Tidal Deposits in the Illinois Basin, USA,” In: D. G. Smith G. E. Reinson, B. A. Zaitlain and R. A. Rahmani, Eds. Clastic Tidal Sedimentology, Canadian Society of Petroleum Geologists, Memoir 16, 1991, pp. 179-188.
- A. W. Archer, “Modeling of Tidal Rhythmites Based on a Range of Diurnal to Semidiurnal Tidal-Station Data,” Marine Geology, Vol. 123, No. 1-2, 1995, pp. 1-10. doi:10.1016/0025-3227(95)80001-R
- T. A. Ehlers and M. A. Chan, “Tidal Sedimentology and Estuarine Deposition of the Proterozoic Big Cottonwood Formation,” Journal of Sedimentary Research, Vol. 69, No. 6, 1996, pp. 1169-1180.
- B. S. Hart and A. G. Plint, “Gravelly Shoreface and Beachface Deposits,” In: A. G. Plint, Ed., Sedimentary Facies Analysis, International Association of Sedimentologists, Special Publication 22, 1995, pp. 75-99.
- R. G. Walker. “Waveand Storm-Dominated Shallow Marine Systems,” In: R. G. Walker and N. P. James, Eds., Facies Models: Response to Sea Level Change, Geological Association of Canada, Geotext 1, 1992, pp. 219-238.
- W. Nemec and R. J. Steel, “Alluvial and Coastal Conglomerates: Their Significant Features and Some Comments on Gravelly Mass-Flow Deposits,” In: E. H. Koster and R. J. Steel, Eds. Sedimentology of Gravels and Conglomerates, Canadian Society of Petroleum Geologists Memoir 10, 1984, pp. 1-31.
- T. F. Moslow and R. S. Tye, “Recognition and Characterization of Holocene Tidal Inlet Sequences,” Marine Geology, Vol. 63, No. 1-4, 1985, pp. 129-151. doi:10.1016/0025-3227(85)90081-7
- M. J. Visser, “Neap-Spring Cycles Reflected in Holocene Sub-Tidal, Large-Scale Bedform Deposits: A Preliminary Note,” Geology, Vol. 8, No. 11, 1980, pp. 543-546. doi:10.1130/0091-7613(1980)8<543:NCRIHS>2.0.CO;2
- R. W. Dalrymple, “Morphology and Internal Structure of Sand Waves in the Bay of Fundy,” Sedimentology, Vol. 31, 1984, pp. 365-382. doi:10.1111/j.1365-3091.1984.tb00865.x
- J. D. Collinson, “The Sedimentology of the Grindslaw Shales and the Kinderscout Grit: A Deltaic Complex in the Namurian of Northern England,” Journal of Sedimentary Petrology, Vol. 39, No. 1, 1970, pp. 194-221. doi:10.1016/0037-0738(70)90013-8
- G. E. Reinson, “Transgressive Barrier Island and Estuarine Systems,” In: R. G. Walker and N. P. James, Eds., Facies Models: Response to Sea Level Change, Geological Association of Canada, Geotext 1, 1992, pp. 179-194.
- D. J. Cant, “Subsurface Facies Analysis,” In: R. G. Walker and N. P. James, Eds., Facies Models: Response to Sea Level Change, Geological Association of Canada, GeoText 1, 1992, pp. 27-45.
- G. E. Reinson, “Barrier Island and Associated Strand-Plain Systems,” In: R. G. Walker, Ed., Facies Models, 2nd Edition, Geoscience Canada, Reprint Series 1, 1984, pp. 119-140.
- D. G. F. Long and S. S. Yip, “The Early Cambrian Bradore Formation of Southeastern Labrador and Adjacent Parts of Quebec: Architecture and Genesis of Clastic Strata on an Early Paleozoic Wave-Swept Shallow Marine Shelf,” Sedimentary Geology, Vol. 215, No. 50, 2009, pp. 50-69. doi:10.1016/j.sedgeo.2009.01.001
- J. M. Demarest and J. C. Kraft, “Stratigraphic Record of Quaternary Sea Levels: Implication for More Ancient Strata,” In: D. Nummedal, O. H. Pilkey and J. D. Howard, Eds., Sea-Level Fluctuation and Coastal Evolution, SEPM Special Publication 41, 1987, 267 p. doi:10.2110/pec.87.41.0223
- A. C. Runkel, J. F. Miller, R. M. McKay, A. R. Palmer and J. F. Taylor, “High-Resolution Sequence Stratigraphy of Lower Paleozoic Sheet Sandstones in Central North America: The Role of Special Conditions of Cratonic Interiors in Development of Strata Architecture,” Geological Society of America Bulletin, Vol. 119, No. 7-8, 2007, pp. 860-881. doi:10.1130/B26117.1
NOTES
*Corresponding author.