Open Journal of Geology
Vol. 2 No. 1 (2012) , Article ID: 16740 , 13 pages DOI:10.4236/ojg.2012.21001
Cyclic Sedimentation of the Barakar Formation, Singrauli Coalfield, India: Statistical Assessment from Borehole Logs
1Department of Geology, Utkal University, Bhubaneswar, India
2Department of Civil Engineering, BIT, Mesra, Ranchi, India
3Department of Geosciences, Osaka City University, Osaka, Japan
Email: rnhota@yahoo.com
Received August 24, 2011; revised October 9, 2011; accepted December 4, 2011
Keywords: Cyclic Sedimentation; Markov Chain Analysis; Entropy Analysis; Regression Analysis; Principal Component Analysis; Barakar Formation; Singrauli Coalfield
ABSTRACT
The succession of lithofacies of a part of the Barakar Formation of the Singrauli coalfield has been studied by statistical techniques. The lithologies have been grouped under five facies states viz. coarse-, medium-, and fine-grained sandstones, shale and coal for statistical analyses. Markov chain analysis indicates the arrangement of Barakar lithofacies in the form of fining-upward cycles. A complete cycle consists of conglomerate or coarse-grained sandstone at the base sequentially succeeded by mediumand fine-grained sandstones, shales and coal seam at the top. The entropy analysis puts the Barakar cycles in A-4 type of cyclicity, which consists of different proportions of lower-, sideand uppertruncated cycles of lithologic states. Regression analysis indicates a sympathetic relationship between total thickness of strata (net subsidence) and number of coal cycles and an antipathic relationship between average thickness and number of coal cycles. The cyclic sedimentation of the Barakar Formation was controlled by autocyclic process, which occurred due to the lateral migration of streams triggered by intrabasinal differential subsidence. In many instances, the clastic sediments issued from the laterally migrating rivers interrupted the sedimentation resulting in thinner cycles in areas where the numbers of cycles are more. Principal component and multivariate regression analyses suggest that the net subsidence of the basin is mostly controlled by number and thickness of sandstone beds and coal seams.
1. Introduction
Due to its vast coal resources, the Barakar Formation of different coalfields has been extensively explored generating voluminous data on the subsurface geology. Examination of borehole logs indicates the repetition of different lithologies. Statistical methods like Markov chain and entropy analyses reveal the cyclic arrangement of lithofacies and their degree of ordering [1-3]. These methods have been extensively used for analysis of coal measure cyclothems as well as alluvial, deltaic and marine successions of different geological ages throughout the globe [4-10]. Quantitative relationship between net subsidence and sedimentary cycles reveals the cause of cyclic sedimentation [5,11-14]. The principal component and multiple regression analyses are multivariate statistical techniques, which have been recommended to find out interrelationships between several variables simultaneously [15]. The first method has been used to quantify the variation of lithic fill of Scottish Namurian basin [16] as well as interrelationship between lithologic variables of coal-bearing sediments of Indian coalfields [17]. The second method has been applied to deduce the role of different lithologic variables of coal cycles in subsidence of the Talchir basin [9,10].
In the present study, a segment of the Barakar Formation of the Singrauli coalfield has been selected for detail study. The aims of the present study are:
a) to study the cyclic arrangement of various lithofacies by Markov chain analysis;
b) to evaluate the degree of ordering of lithofacies using entropy functions;
c) to establish the relationship between net subsidence (total thickness of strata) and number and average thickness of sedimentary cycles using bivariate regression analysis;
d) to establish the relationship between net subsidence of the depositional basin and different lithologic parameters like number and thickness of sandstone and shale beds and coal seams, which constitute the Barakar Formation by principal component and multiple regression analysis methods.
e) to analyse the cause of cyclicity vis-à-vis Barakar sedimentation during Lower Permian.
2. Geological Setting
The Singrauli coalfield occupies the junctional region of the east-west trending Koel-Damodar and northwestsoutheast aligned Son-Mahanadi valleys. The northern limit of the coalfield is defined by the east-west trending boundary fault, which is probably an offshoot of the Son-Narmada lineament. In the eastern part of the coalfield, the Talchir sediments rest unconformably on the Precambrian basement where as in the northern part, the younger Lower Gondwana sediments abut against the Precambrian rocks along an east-west running fault (Figure 1). The comprehensive stratigraphy of the coalfield is given in Table 1. The Precambrian basement, on which the Gondwana sediments rest with a profound unconformity, comprises schists and gneisses in south as well as quartzites and phyllites in the north. In the eastern
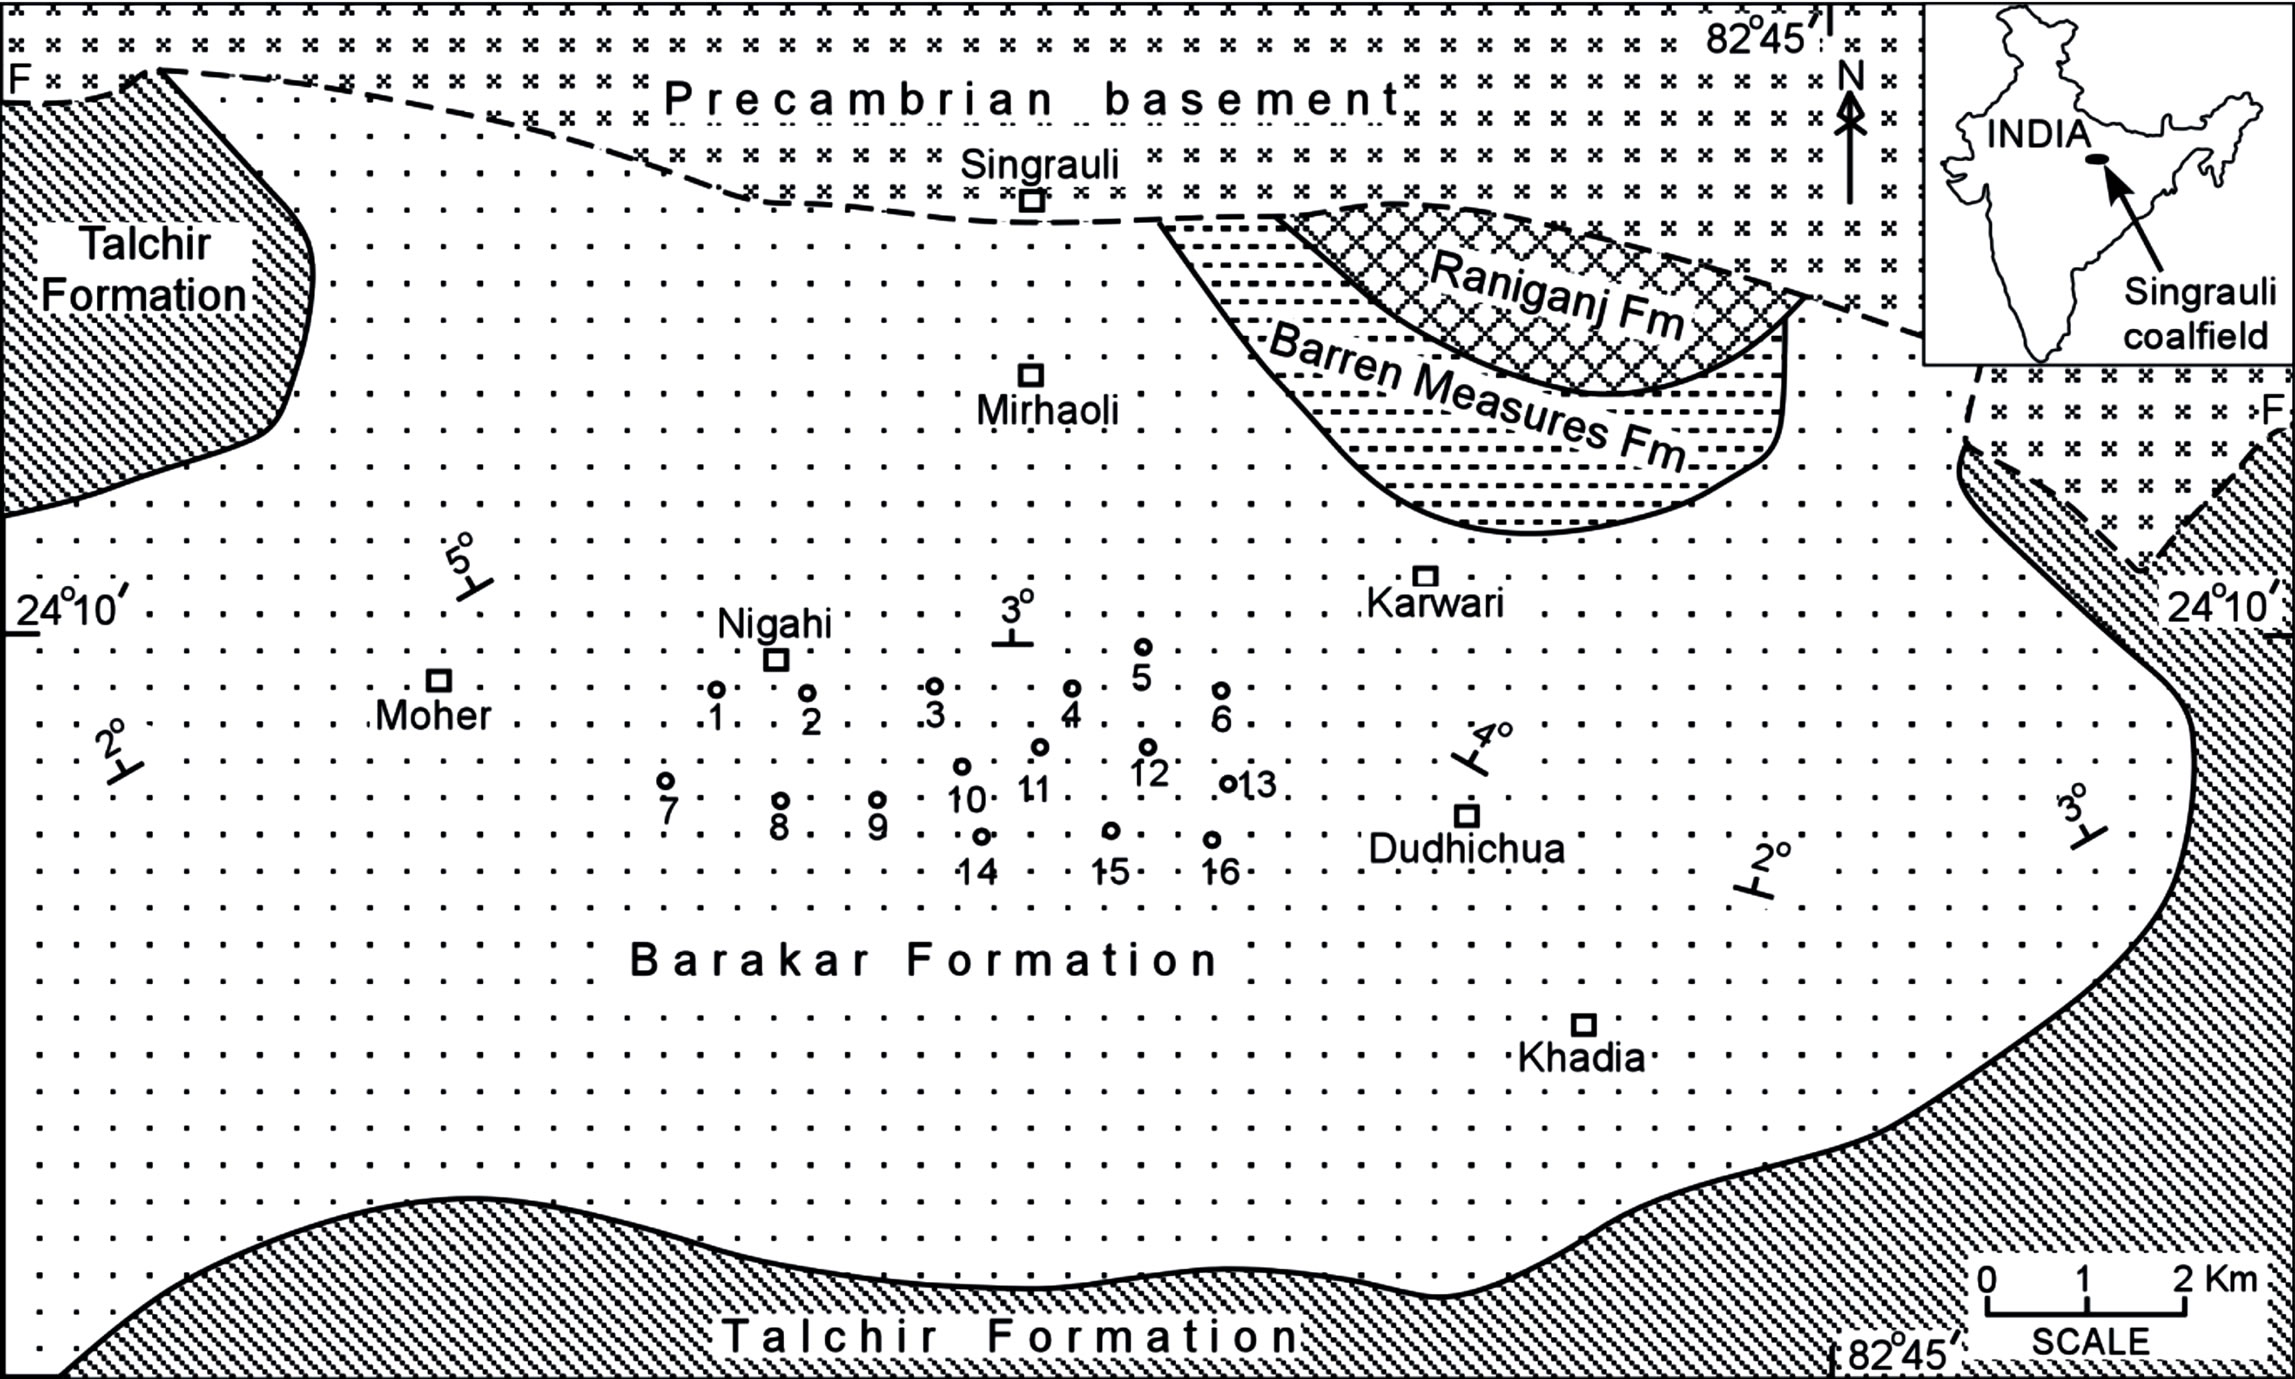
Figure 1. Geological map of a part of the Singrauli coalfield with location of boreholes (modified after Mishra and Singh [27]).
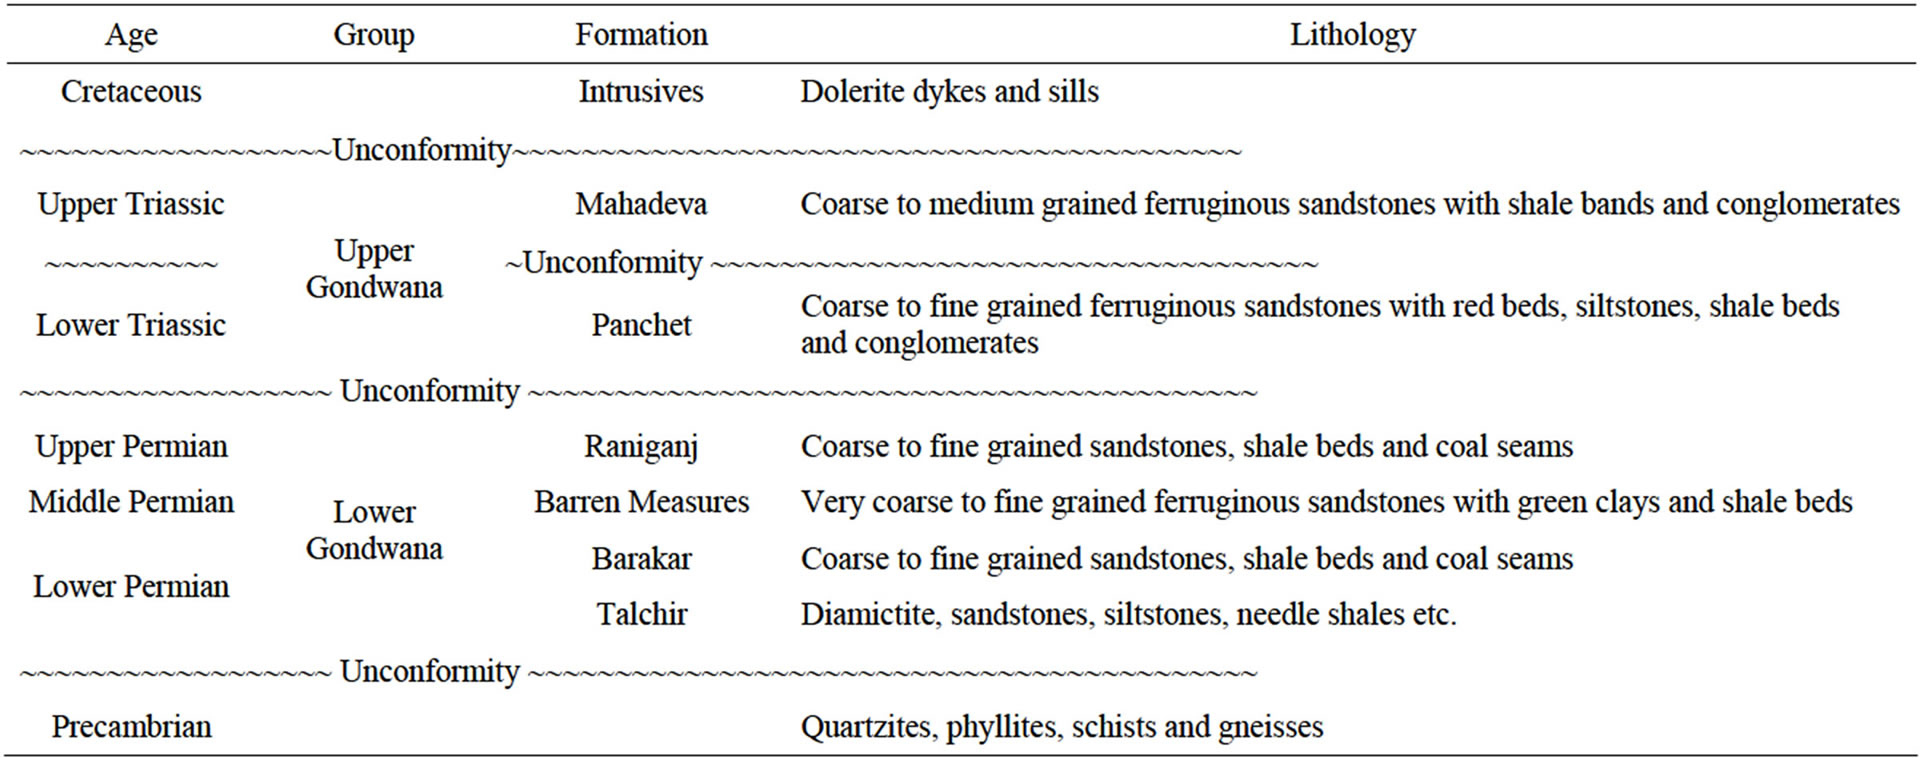
Table 1. Comprehensive stratigraphic sequence of the Singrauli coalfield (after Raja Rao [18]).
part of the coalfield, the Talchir Formation is exposed in the south and east. The basal diamictite horizon (boulder bed) is made up of an assortment of pebbles and boulders of granite, gneisses, quartzites etc of variable size. The boulders are egg and wedge shaped and a few of them are faceted with distinct striations indicative of their glacial derivation. The boulder bed is overlain by shale, siltstone and sandstone, which contain fossil plant debris. The Barakar Formation, to which the study pertains, covers a large tract in the eastern part of the coalfield. It consists of hard and compact, coarseto fine-grained, gray, pink and white coloured sandstones, gray and carbonaceous shale beds and coal seams. Locally there is significant concentration of garnet, which imparts a pinkish tint to the sandstones. The Barakar Formation hosts six coal seams viz. Kota, Turra, Purewa Bottom, Purewa Top, Khadia and Pani Pahari seams from bottom to top separated by inter-seam partings of sandstone and shale (Table 2). The Kota, Khadia and Pani Pahari seams are relatively thinner (@2 m) whereas the Turra, Purewa Bottom and Top seams are of considerable thickness (10-18 m). On the average the Barakar Formation is constituted of 68% sandstone, 6% shale and 26% coal. The succeeding Barren Measures Formation is composed of very coarseto fine-grained ferruginous sandstones, green clays and shale beds. The sandstone is locally pebbly and the formation is devoid of carbonaceous material. In the eastern part of the coalfield, the Raniganj Formation is disposed in a semi-circular pattern (Figure 1). This formation is represented by sandstones of various grain size, white and gray clays, carbonaceous shales and coal seams. The Panchet and Mahadeva formations of the Upper Gondwana Group are exposed in the western part of the basin (not shown in Figure 1). The rocks of the Panchet Formation lie unconformably over the Lower Gondwana Group of rocks and crop out in deep gorges cutting across the Mahadeva ranges. It comprises basal conglomerate bed consisting of sand, shale and coal pebbles derived from the underlying beds, coarseto finegrained ferruginous sandstones, yellowish to reddish clays, siltstones and shale beds. The Panchet Formation is overlapped by the Mahadeva Formation by an angular discordance. The latter attains huge thickness forming isolated hillocks as outliers. It is composed of massive, thickly bedded, highly resistant to weathering, coarseto medium-grained ferruginous sandstones with shale beds of different colours and lenses of conglomerates comprising pebbles of chert, jasper and vein quartz. The Gondwana succession is intruded by dolerite dykes and sills, the former being more common, in the western part of the basin. These are composed of bytownite, olivine and titanaugite, extensively weathered and occur in form of elongated ridges and mounds. At places, near the contacts of the intrusives, the sandstones are hardened and appear to be slightly baked.
Structurally, the Singrauli Gondwana basin is composed of two tectono-sedimentary domains, the main basin towards the west (not shown in Figure 1) and the Moher sub-basin to the east. These two sub-basins are separated from each other by a N-S trending basement high, which is flanked by a shallow cover of basal Barakar strata [18]. The Moher sub-basin that includes the study area is flanked by Talchir sediments both in east and west and delineated to the north by the prominent
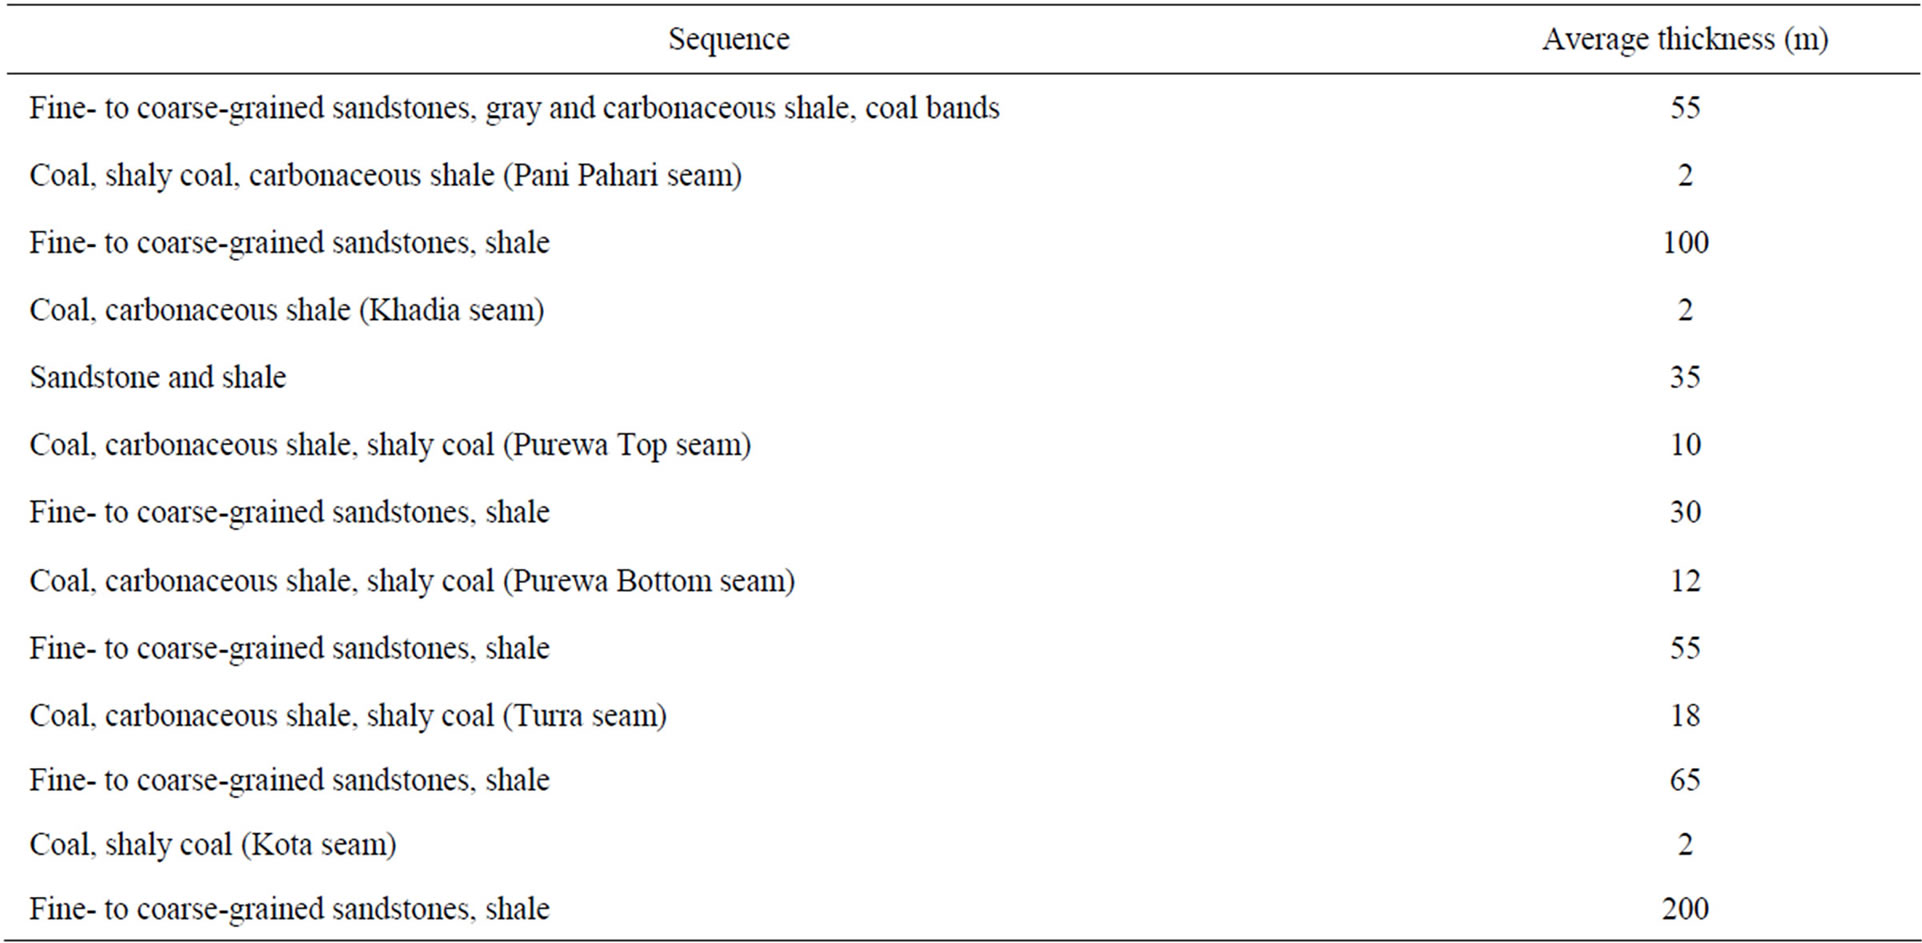
Table 2. Generalized sequence of the coal-bearing Barakar sediments (Modified after Mishra and Singh [27])
east-west trending boundary fault (Figure 1). In this sub-basin, the beds dip northerly at low angles ranging from 2 - 5 degrees with swerveing strike from east to west. In the west of Moher, the strike is SW-NE that assumes E-W trend around Nigahi and swings to NW-SE near Dudhichua. Further east near the eastern boundary of the basin, the strike veers to SW-NE.
3. Methodology
Fieldwork was carried out to study the Barakar rocks exposed in the study area. Due to erratic nature and paucity of continuous exposures, vertical relationship between different lithofacies could not be ascertained from surficial studies. Sixteen borehole sections penetrating through the Barakar formation in the Jayant coal mine area around Moher, Nigahi and Dudhichua (Figure 1) drilled and logged by the Central Mining Planning and Design Institute, Ranchi were used in the present study.
There is disagreement among different workers regarding the scale and boundary of a coal cycle. According to Udden [19] a cycle commences at the base of coal seam whereas Weller [20] gave a formation status to each cycle with sandstone at the base and coal seam at the top. Read and Dean [21] suggested the minimum thickness of a cycle to be 0.3 m while Casshyap [5] put it 1 m. In the present work, the sequence of strata of more than 1 m thickness with basal coarse member (conglomerate or sandstone) and terminating with a coal seam has been considered to constitute a cycle. For simplicity of analysis and to avoid the risk of error [4,5], the lithologies observed in the surficial study were condensed into five facies states on the basis of lithology and texture as observed in the borehole records. These are:
Facies-A: Coarse-grained sandstone that includes massive conglomerate, trough cross-bedded pebbly sandstone, flat-bedded coarse-grained sandstone, large-scale trough and tabular cross-bedded coarse-grained sandstones.
Facies-B: Medium-grained sandstone that includes planar, trough and tabular cross-bedded coarse to mediumand medium-grained sandstones.
Facies-C: Fine-grained sandstone that includes parallel and ripple-drift cross-laminated medium to fine and fine-grained sandstones.
Facies-D: Shale that includes interbedded sandstoneshale and gray shale.
Facies-E: Coal that includes carbonaceous shale, shalycoal and coal, which commonly constitute the coal seam.
Condensation of lithologies into the above five lithofacies seems appropriate as A and B represent midand distal-channel deposits of braided rivers respectively; C is characteristic of point bar and bar-top deposit; D represents proximal flood plain and over bank deposits and E is the deposit in the peat swamps [22].
The upward facies transition data of all the sixteen boreholes (Figure 1) were summed up to form a transition count matrix (fij), which was processed into transition probability (pij) random probability (rij) and difference (dij) matrices using the following equations proposed by Miall, Casshyap and Tewari et al. [4,5,23].
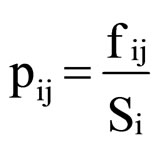 (1)
(1)
 (2)
(2)
 (3)
(3)
where Si and Sj are the sum of the ith and jth row of the fij respectively
 ; n = the rank of the matrix i.e. the number of rows or columns (five in the present case).
Facies relationship diagram was constructed on the basis of difference matrix results to arrive at the preferred upward transition of facies states. The cyclicity (Markovian property) of facies states has been tested by chi-square statistics proposed by Billingsley [1] and Harbaugh and Bonham-Carter [2] as given below.
 (4)
(4)
 (5)
(5)
The degrees of freedom for the above two equations are “(n2 – 2n)” and “(n – 1)2 – n” respectively.
The extent and nature of ordering of facies states were investigated by the concept of entropy [3]. The entropies of each facies states before deposition E(pre) were computed from the probability matrix (Q) obtained from the frequency matrix (fij) by dividing the corresponding entry by the corresponding column total. The formula is:
 (6)
(6)
where  s are the entries of the matrix Q.
The entropies of each facies states after deposition E(post) were computed from the transition probability matrix (pij). The formula is
 (7)
(7)
Since the entropy values are dependent on the number of facies states, it is necessary to normalize them by the formula Normalized entropy  (8)
(8)
where
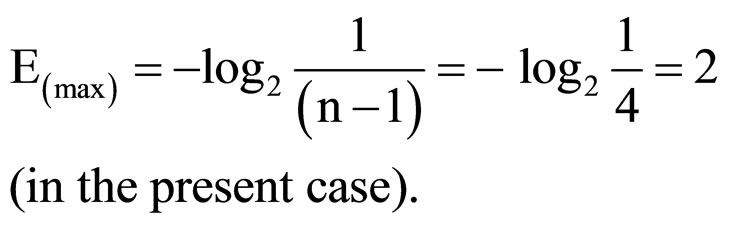 (9)
(9)
Entropy of the sedimentation process
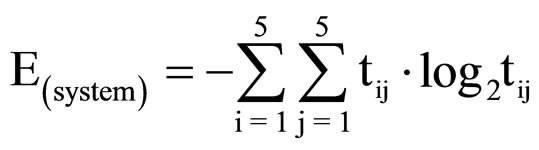 (10)
(10)
where 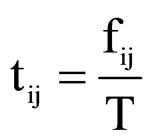
Relations between total thickness of strata (net subsidence) and number as well as thickness of sedimentary cycles were studied by regression analysis. Since the dip of the Barakar Formation varies from 2 - 5 degrees, there is negligible difference between the strata cut by bore and their true thickness. The data of 16 boreholes shown in Figure 1 were used in the present study. The length of each borehole section was taken into consideration for the calculation of total thickness of strata and number of cycles. Total thickness of strata (x in m), number of coal cycles (y) and average thickness of coal cycle (z in m) were computed for all the borehole sections. The methods of linear and curvilinear regression analysis outlined by Davis [15] were used in the present case. Firstand second-degree polynomial regression lines were fitted to the data sets of the study area using the least-square criteria and the proportions of total sum of squares satisfied (percentage of goodness of fit) by each regression line and 95% confidence (fiducial) limits were calculated. Analysis of variance was performed using the F-test to test the significance of each regression line and whether each second-degree polynomial line is making a significant additional contribution to the regression variance already explained by the first degree line or not. Correlation coefficients for each pair of variables were computed and their significance was tested by Student’s t-test. To ascertain the influence of number and thickness of sandstone, shale and coal beds on the net subsidence of the basin (total thickness of strata), principal component and multiple regression analyses have been carried out using SPSS, Statistica and MS-Excel softwares.
4. Results and Discussion
4.1. Markov Chain Analysis
The transition count (fij), transition probability (pij), random probability (rij) and difference (dij) matrices of the Barakar Formation facies states are summarised in Table 3. The computed values of chi-squares exceed the limiting values at 0.1% significance level suggesting the presence of Markovity and cyclic arrangement of facies states. The facies relationship diagram (Figure 2) constructed from the difference matrix results suggests that the Barakar cycles are asymmetric fining-upward type.
The complete Barakar cycle starts with a thin conglomerate or pebbly to coarse-grained sandstone (Facies A) at the base, which is often marked by basal scour. Facies A is succeeded by facies B with dij value of 0.60; facies B is overlain by facies C with dij value of 0.46; facies C is overlain by facies D and E with dij values of 0.32 and 0.02 respectively and facies E is succeeded by facies A and D with dij values of 0.26 and 0.12 respectively. In geological terms, the channel sediments succeeded each other preferentially with decreasing grain size and are followed by over bank and peat swamp deposits. In other words, due to lateral migration of the stream, the channel lag and proximal channel deposits were covered by distal channel sediments, which in turn were succeeded by point bar and bar top sediments. Due to further migration of the stream, the levee and flood plain environments prevailed at the site of point and braid bars and peat swamps occupied the distal part of the flood plain. Interbedding of shale and coal facies (Figure 2) was possibly due to over-flooding of streams as a result of which fine clastics were deposited over the accumulated peat. With waning of flood, the swamp environment got re-established once again. Due to lateral migration of the stream channel, the peat swamp deposits were buried under channel deposits with initiation of a new cycle. This is testified by the transition from coal to coarse-grained sandstone with dij value of 0.26 (Table 3 and Figure 2).
4.2. Entropy Analysis
E(pre) > E(post) relationship (Table 4) in case of facies A, D and E suggests that the facies states following them

Figure 2. Facies relationship diagram for the Barakar Formation of the study area.

Table 3. Markov matrices and c2 test statistics of facies states of the Barakar formation.
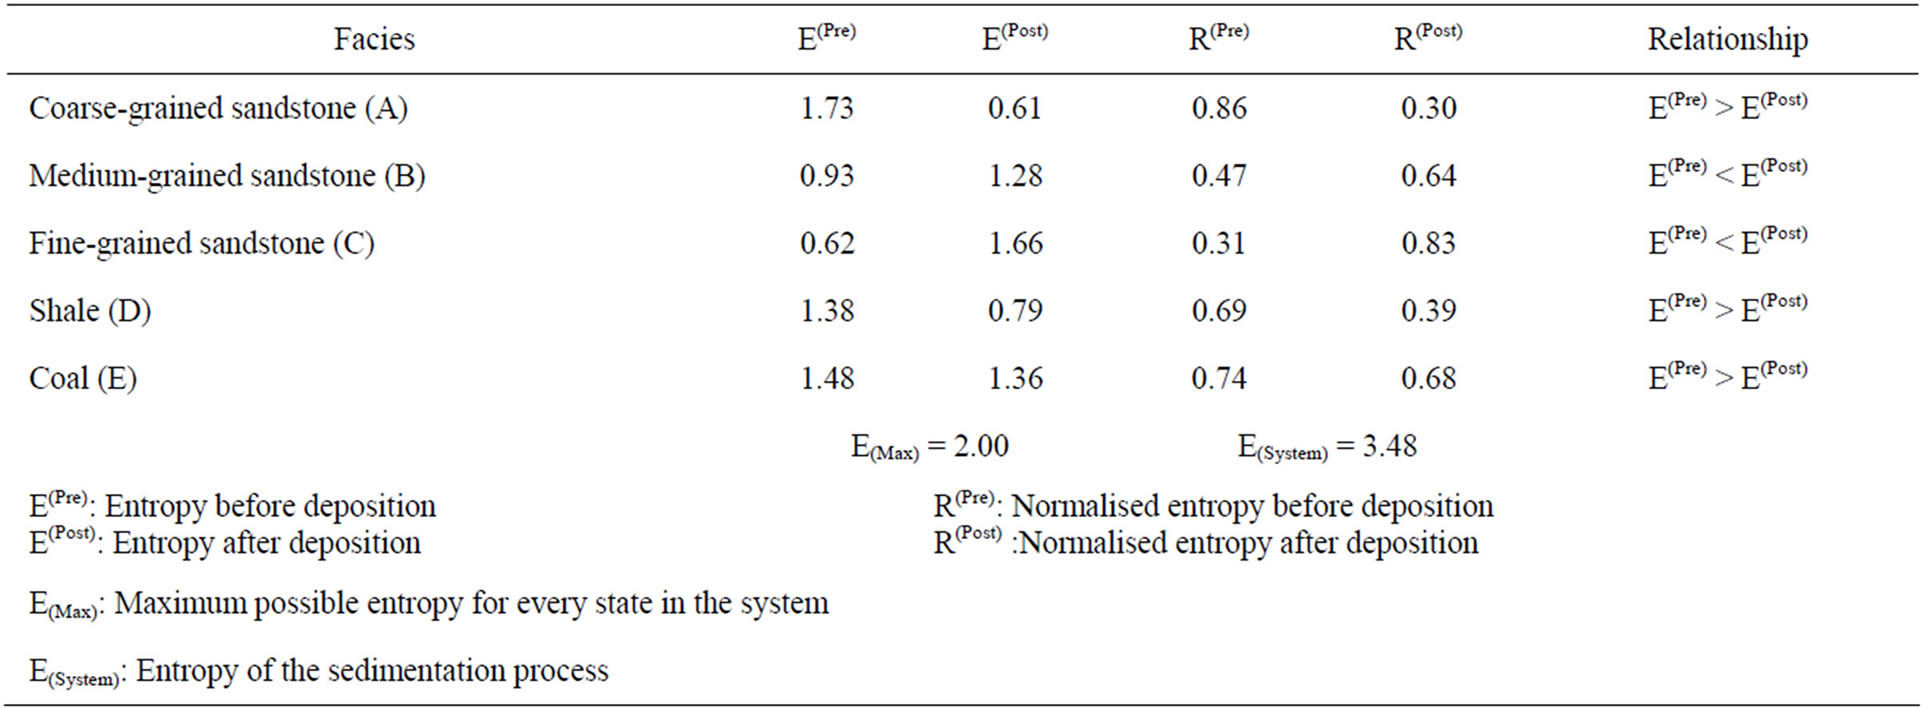
Table 4. Entropy values of facies states of the Barakar Formation.
can be ascertained with more certainty than those preceding them. In other words, these facies states exert strong influence on their successors while relatively less influenced by their precursors. This is evident from the Markov matrices (Table 3) and facies relationship diagram (Figure 2). E(pre) < E(post) relationship in case of mediumand fine-grained sandstones (facies B and C) indicates their strong dependence on its precursor which is visualised from the Markov metrics. In other words, the distal channel and point bar/bar-top deposits were preferentially deposited over proximal channel and distal channel deposits.
The entropy sets for facies states (Figure 3) belong to the A-4 type of Hattori [3], which consists of different

Figure 3. Entropy sets for facies states of the Barakar Formation. A: Coarse-grained sandstone; B: Medium-grained sandstone; C: Fine-grained sandstone; D: Shale; E: Coal.
proportions of lower-, upperand side-truncated cycles of lithologic states. The borehole data and facies relationship diagram (Figure 2) suggest that very often, the Barakar cycles terminate with a point bar/bar-top deposit (Facies C) at the top and thus, are upper truncated. The D«E pair constitutes lower truncated cycle. Some of the cycles in the point bar areas are C → E type formed by growth of vegetation in point bar hollows. These cycles are side truncated with facies D missing. The entropy of the Barakar sedimentation system as shown in Figure 4 plots within coal-measure field (2) and fluvial-alluvial successions (4) in the succession discrimination diagram of Hattori [3], which suggests fluvial nature of the Barakar Formation.
4.3. Regression Analysis
The equations of firstand second-degree polynomial regression lines along with the 95% confidence (fiducial) limits and F-test results are given in Table 5 and the corresponding lines are plotted in Figures 5 - 7. The lines are comparable with each other and with those given by Read and Dean [13], Johnson and Cook [12], Casshyap [5] Hota and Pandya [24], Hota and Sahoo [8], Hota and Das [9] and Hota [10]. It is interesting to note that the three second-degree polynomial regression lines belong to two groups. In case of x versus y and y versus z (Table 5) the coefficient of the first-degree term is negative and that of second-degree term is positive. These lines show upward concavity with respect to the first-degree lines (Figure 5). In case of x versus z, (Table 5) the coefficient of the first-degree term is positive and that of second-degree term is negative. This line shows upward convexity with respect to the first-degree line (Figure 6). This is due to the fact that the second-degree line is a parabola with general regression equation “y = a + bx + cx2”, the second derivative (d2y/dx2) of which is 2c. Depending on the positive or negative sign of c (the coefficient of second-degree term), the curve shows upward concavity or convexity with base line (X-axis). The
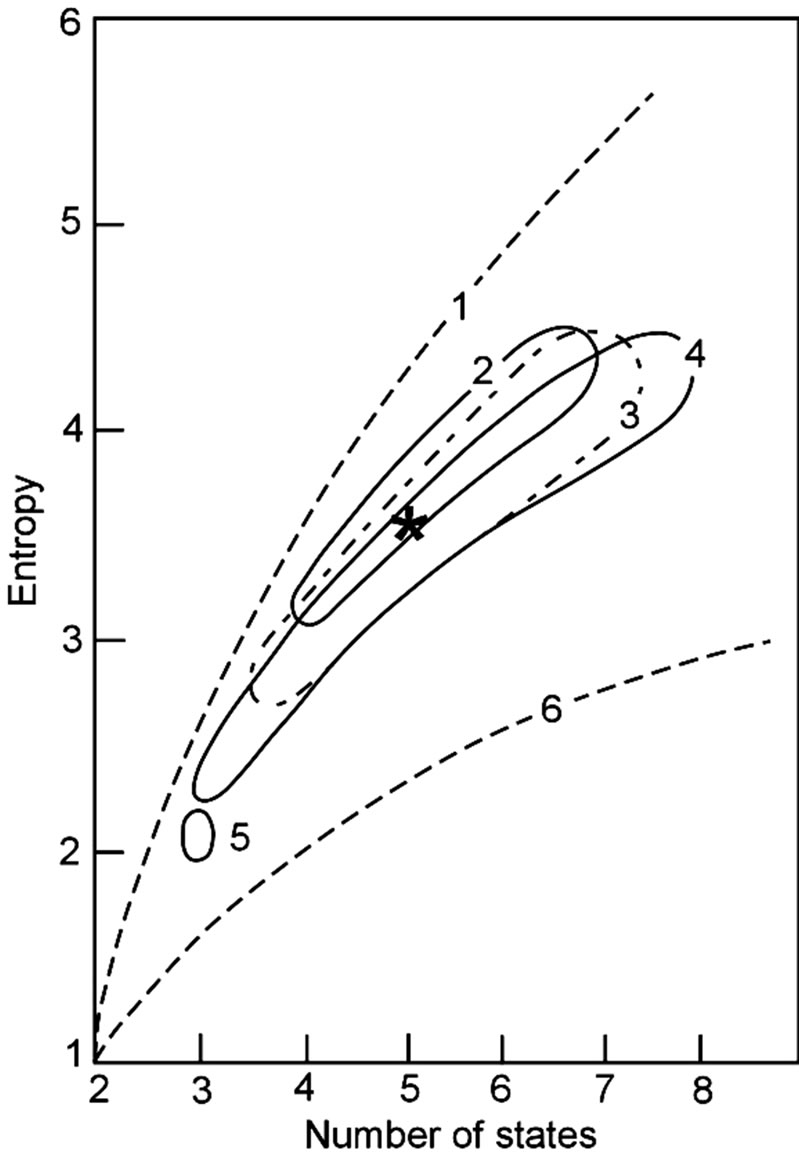
Figure 4. Relationship between entropy and depositional environment of lithological sequences (after Hattori, 1976). 1: Maximum entropy; 2: Entropies for the coal-measure successions; 3: Entropies for fluvial-alluvial successions; 4: Entropies for neritic successions; 5: Entropies for flysch sediments; 6: Minimun entropy. *: Entropy for the Barakar Formation, Singrauli coalfield.
computed values of “F” in case of first-degree lines (x versus y and y versus z) exceed the critical value at the 5% significance level (Table 5). Thus, the null hypothesis (H0) that the variance about the regression line is not different from the variance in the observation is rejected and the alternative hypothesis (H1) that there is significant difference of variance about the regression line and the variance in the observation is accepted. These two lines are statistically significant at the 0.05 significance level. The computed value of “F” in case of variable pair x and z is less than the critical value and thus, the line is statistically insignificant. The computed value of ‘F’ in case of second-degree line of x versus y is greater than the critical value at the 0.05 significance level (Table 5). This line is statistically significant. The second-degree lines for x versus z and y versus z are statistically insignificant as the computed values of “F” are less than the critical value.
The percentage of total sum of squares satisfied (percentage of goodness of fit) by first and second-degree lines in case of x versus y are reasonably high, moderate in case of y versus z, and low to moderate in case of data sets x versus z (Table 6). The computed values of “F” to test the significance of increase of fit of second-degree line over the first-degree line in cases of x versus z and y versus z are less than the critical values at the 0.05 significance level (Table 6). In these two cases, the null
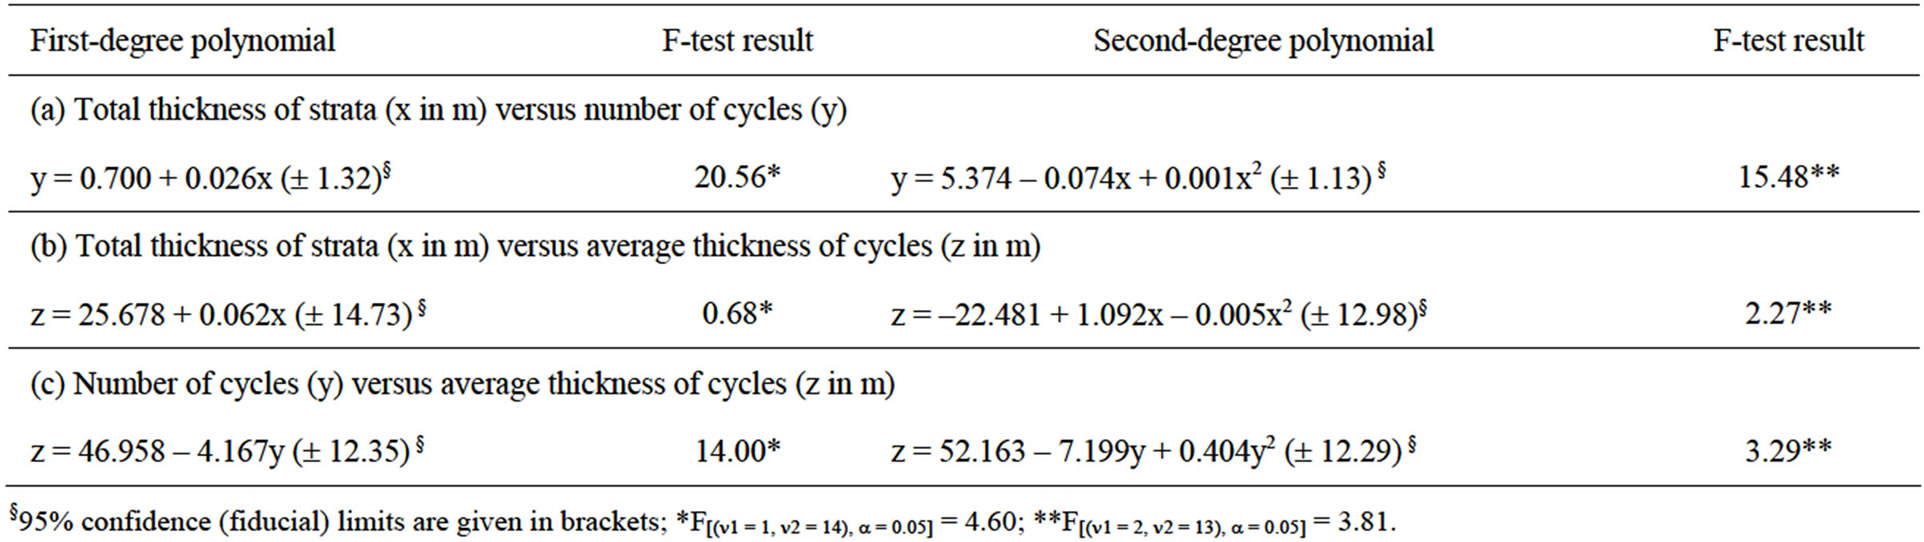
Table 5. Equations of firstand second-degree polynomial regression lines and F-test results

Figure 5. Firstand second-degree lines showing statistical relationship between total thickness of strata (x in m) and number of cycles (y) of the Barakar Formation of the study area.
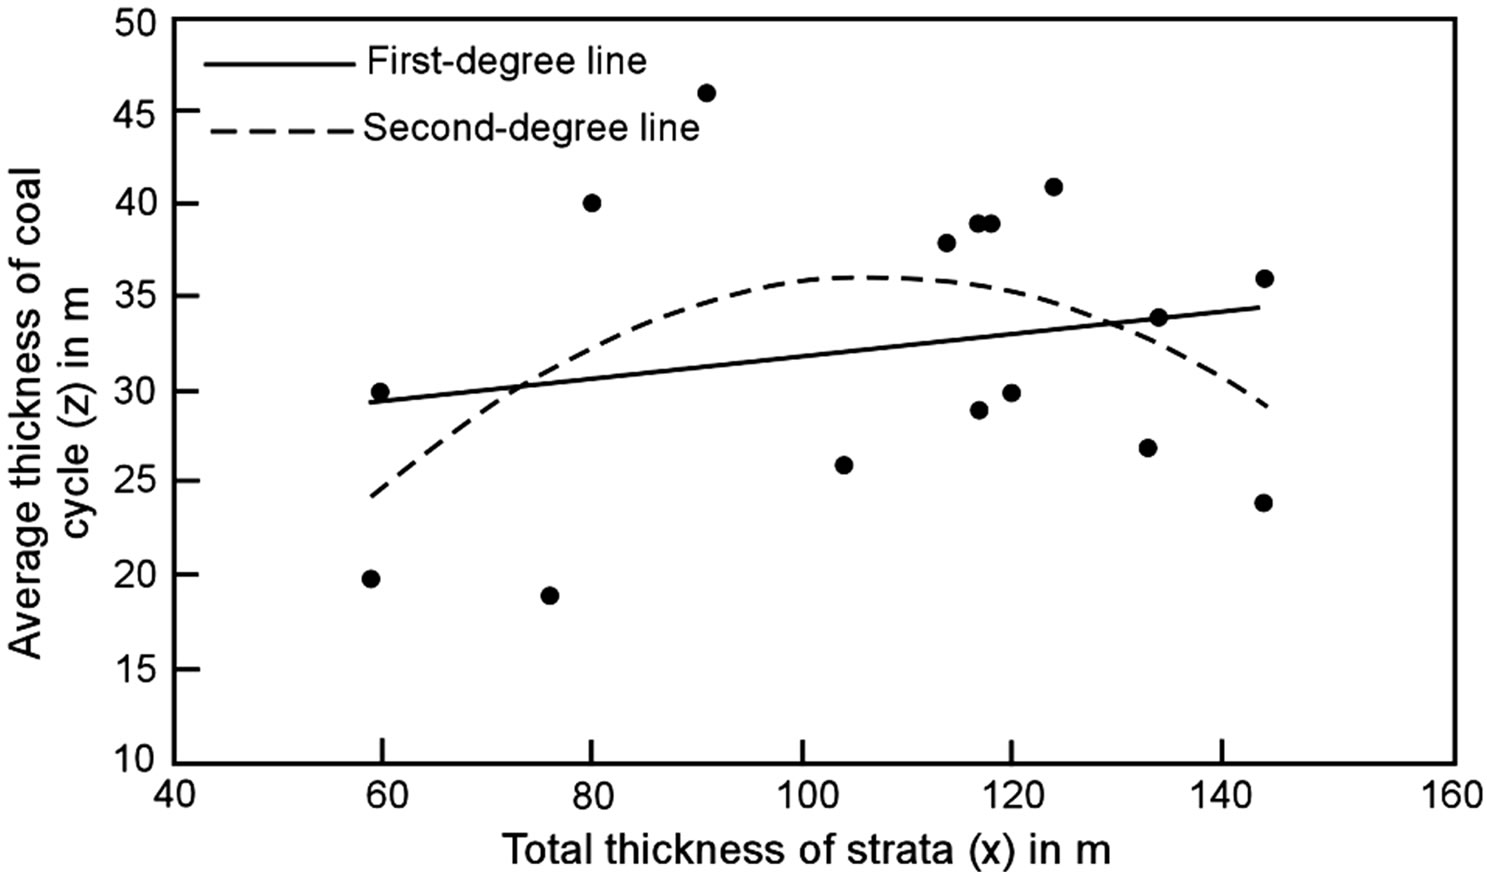
Figure 6. Firstand second-degree lines showing statistical relationship between total thickness of strata (x in m) and average thickness of cycles (z in m) of the Barakar Formation of the study area.
hypothesis (H0) that the added term in the regression equation does not make a significant contribution to the regression variance is accepted. In case of x versus y, the computed value of “F” is greater than the critical value that leads to rejection of the null hypothesis and acceptance of the alternative hypothesis (H1) that the added term in the regression equation makes a significant contribution to the regression variance is accepted, i.e. the second-degree line is fitted better than the corresponding first-degree line. In this case the third-degree line is “y =
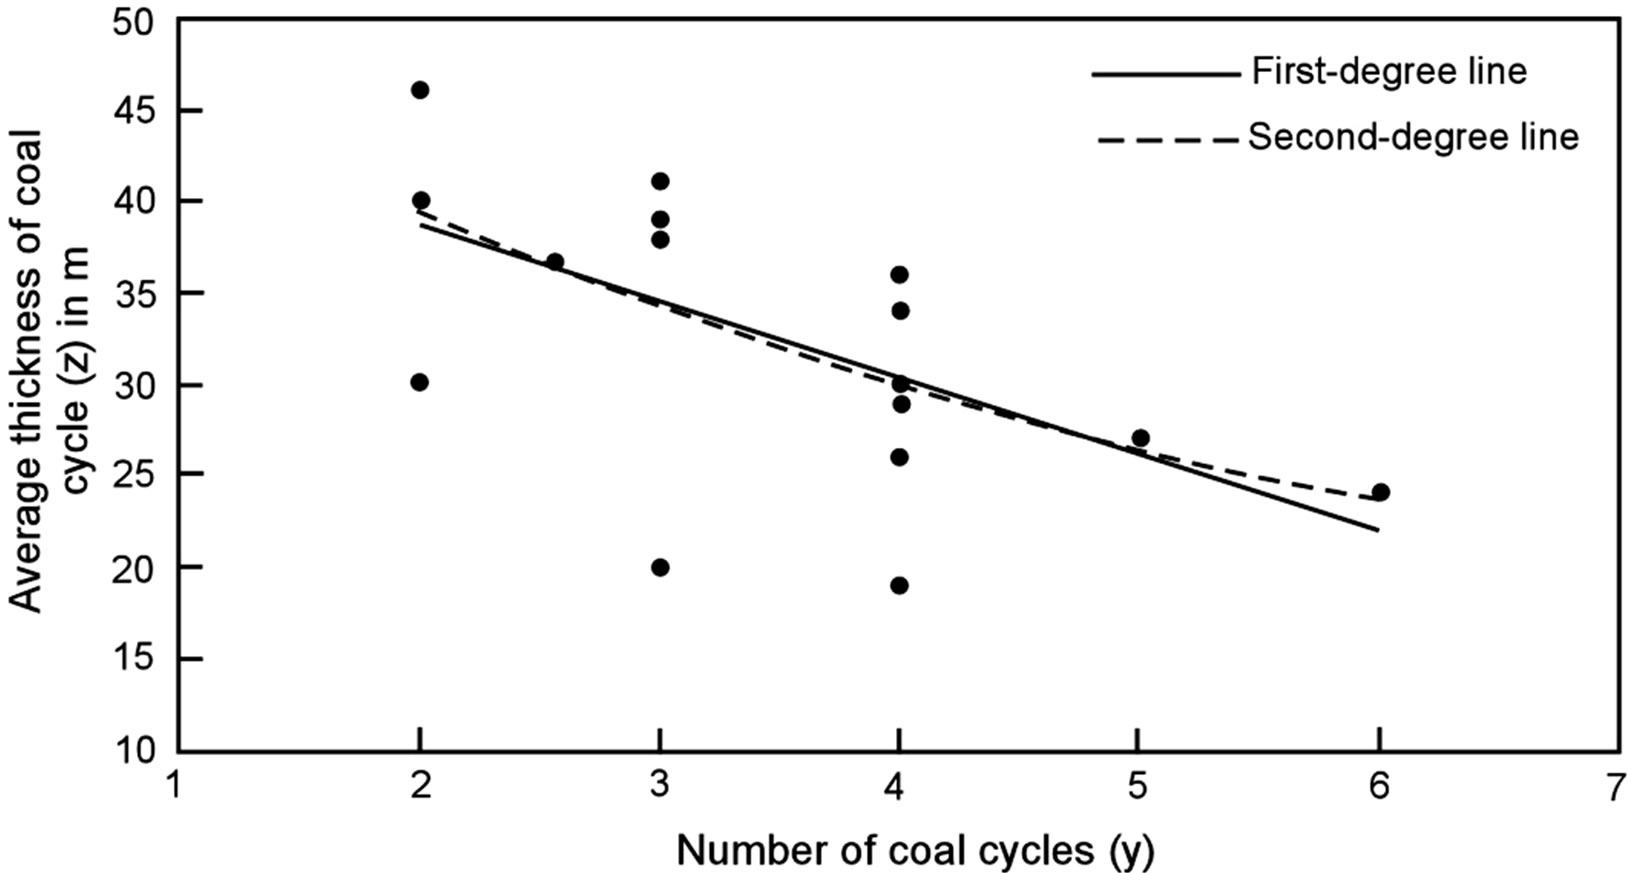
Figure 7. Firstand second-degree lines showing statistical relationship between number of coal cycles (y) and average thickness of cycles (z in m) of the Barakar Formation of the study area.
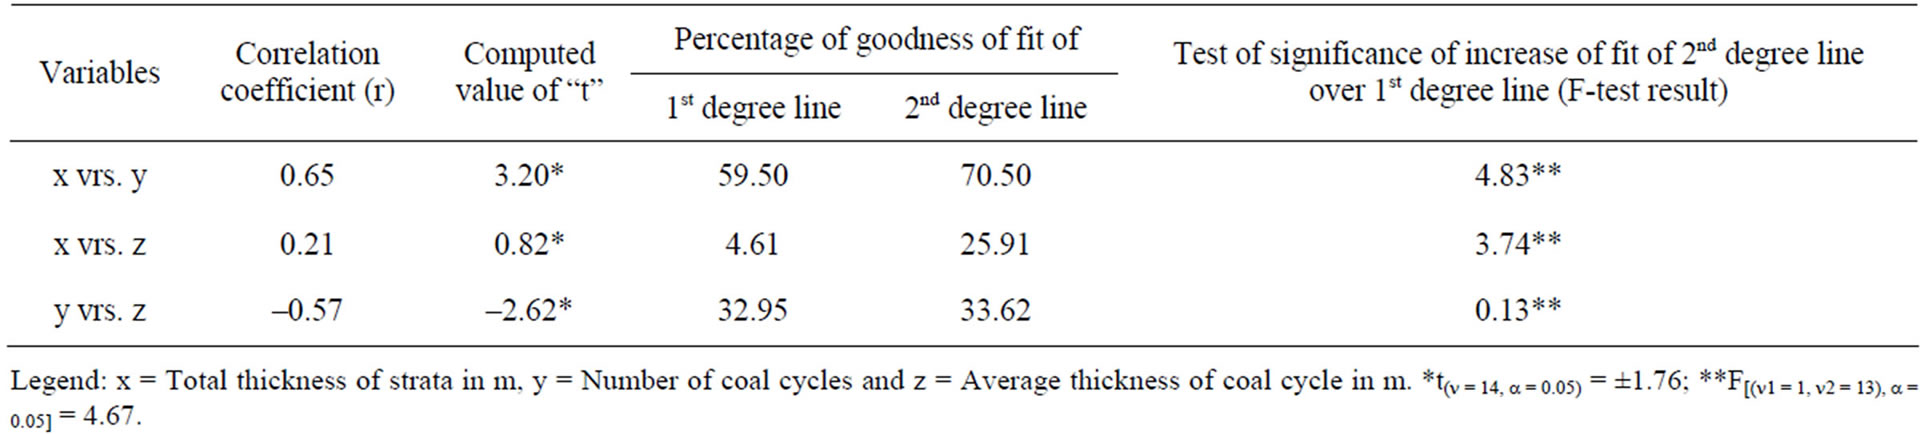
Table 6. Correlation coefficients between variable pairs, percentages of goodness of fit of regression lines and F-test results of increase of fit of 2nd degree line over 1st degree line.
–0.5241 + 0.1155x – 0.0014x2 + 0.000006x3” with goodness of fit of 52.31%. This line does not add significantly to the regression variance already explained by the corresponding second-degree line. The computational results seem to justify that the first-degree lines (Figures 5 - 7) depict the systematic variations between the datasets and thus, the correlation coefficients adequately explain the relationship between the variable pairs.
The computed values of “t” in x versus y and y versus z exceed the critical value (Table 6). This leads to the rejection of the null hypothesis (H0) that the correlation coefficients are not significantly different from zero and acceptance of the alternative hypothesis (H1) that the correlation coefficients are statistically significant and demonstrate the relationship between these variable pairs. Thus, significant positive correlation (0.65, Table 6) between the total thickness of strata (x) and the number of coal cycles (y) and significant negative correlation (–0.57, Table 6) between the number of coal cycles (y) and their average thickness (z) exist. However, in case of x versus z, the computed value of “t” is less than the critical value that leads to the acceptance of the null hypothesis (H0) and insignificant nature of the correlation coefficient.
The first-degree polynomial regression line (Figure 5) and the correlation coefficient value (r = 0.65, Table 6) demonstrate a direct relationship between the total thickness of strata (net subsidence) and the number of coal cycles. This is in conformity with the findings of Casshyap [5], Hota and Sahoo [8] and Hota and Das [9], Duff [11], Johnson and Cook [12], Read and Dean [13], Hota and Pandya [24]. Thicker the succession i.e. larger the subsidence of the depositional basin, greater is the number of cycles present. This direct relationship suggests that the cyclic sedimentation of the Barakar Formation of the Singrauli coalfield was controlled by autocyclic process, which operated within the depositional basin rather than beyond the basin territory. A well known autocyclic process is the sedimentation that is manifested by one or more of the factors like accumulation of peat, compaction of sediments and instability of channel development in the flood plain. Because, the Barakar sediments are fluvial in nature, these might have been deposited by laterally migrating river channels and their associated deposits. Had the cyclic development been in response to allocyclic processes like extensive diastrophic movements, climatic control or eustatic rise in the sea level, then the number of cycles would have remained constant and the regression line would have been horizontal in Figure 5. Thus, the Barakar sedimentation of the Singrauli coalfield is closely associated with the lateral migration of streams or drainage diversion activated by intrabasinal differential subsidence.
Insignificant positive correlation (r = –0.21, Table 6) exists between total thickness of strata (net subsidence) and average thickness of sedimentary cycles (Figure 6), which matches well with the findings of Casshyap [5], Hota and Das [9], Hota [10] and Johnson and Cook [12]. Such relationship implies inconsistent relation between the factors, which determine the total thickness of strata (net subsidence), and those which control coal formation (peat accumulation). Different parts of the depositional basin subsided differentially and possibly the development of peat swamp and growth of vegetation was not uniform throughout. These factors may account for the weak relationship between subsidence and average thickness of coal cycle.
Significant negative correlation (r = –0.57, Table 6) exists between the number and average thickness of cycles (Figure 7). This inverse relationship matches well with the findings of Casshyap [5], Hota and Sahoo [8], Hota and Das [9] and Hota [10] Hota and Pandya [24] and Johnson and Cook [12]. The possible explanation may be that, peat accumulation was frequently interrupted by clastic sediments issued from the migrating rivers by channel diversion, crevassing and/or avulsion that resulted in thinning of the coal cycles and in increasing their number. This conclusion is supported by the occurrence of laterally extensive coal seams which split frequently enclosing arenaceous and argillaceous partings.
4.4. Multivariate Analysis
The principal component and multiple regression analyses are multivariate statistical techniques, which have been recommended to find out interrelationships between several variables simultaneously [15]. The first method has been used to quantify the variation of lithic fill of Scottish Namurian basin [16,25] as well as interrelationship between lithologic variables of coal-bearing sediments of Indian coalfields [17]. The second method has been applied to discern the role of different lithologic variables of coal cycles on basin subsidence [9,10].
In the present study the sequence of strata comprising a basal coarse member (conglomerate or sandstone) and terminating with a coal seam has been considered to constitute a cycle. The lithologic parameters are total thickness and number of constituent lithologies like sandstone and shale beds and coal seams. It has been recommended that only those principal components, in which the eigenvalues are greater than unity, are statistically significant and can be used for geological interpretation [25]. The analytical results are presented in Table 7. It is seen that the communality of all the variables are appreciably high and only two of the principal components are statistically significant. The principal component 1 with eigenvalue of 3.313 explains 47.334% of the total variance. It includes total thickness of strata as well as number and thickness of sandstone beds and coal seams. The principal component 2 with eigenvalue of 2.367 explains 33.817% of total variance. It is strongly loaded on the number and thickness of shale beds. Thus, the number and thickness of sandstone beds and coal seams contribute significantly to the total thickness of strata (net subsidence) during Barakar sedimentation.
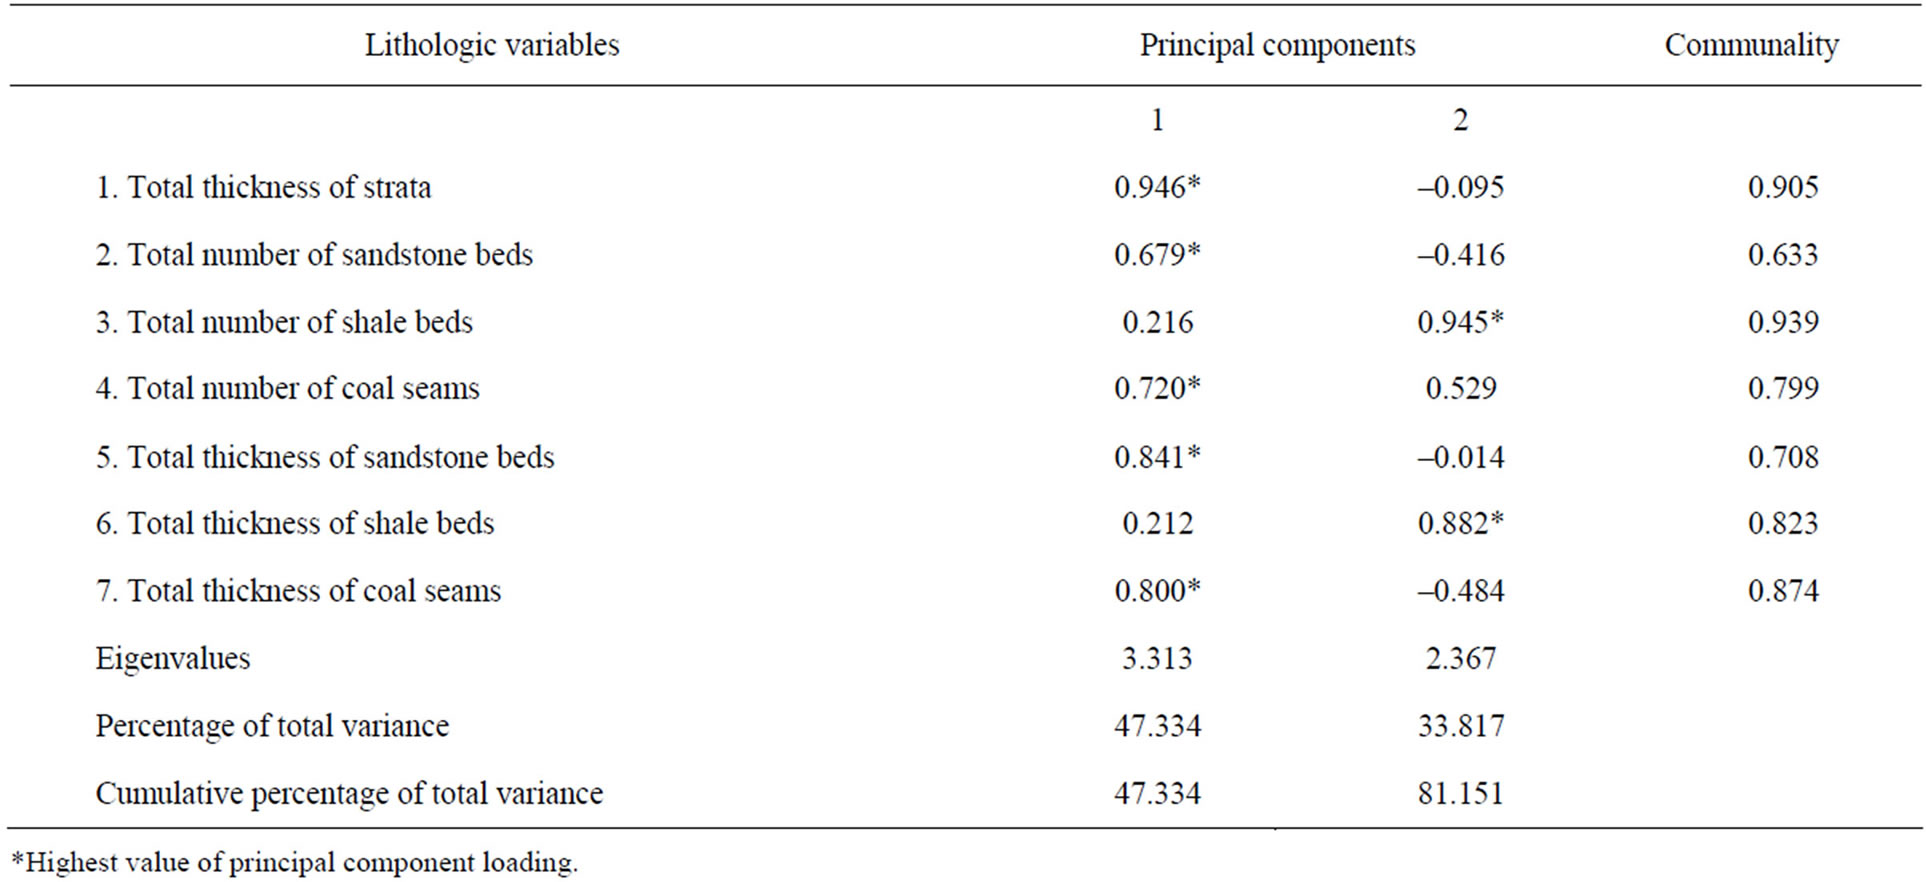
Table 7. Matrix of the two principal components for the seven lithologic variables of the Barakar formation.
While principal component analysis classifies the variables into different groups, the multiple regression analysis combines all the independent variables in a polynomial form to estimate the dependent variable quantitatively. In the present case, total thickness of strata (net subsidence of the basin) has been taken as the dependent variable and the coal cycle parameters (thickness and number of sandstone and shale beds and coal seams) as the independent variables. The F-test results are given in Table 8. The analysis of variance confirms the statistical significance of the regression equation (Total thickness of strata = 0.210 – 0.115 × number of sandstone bed – 0.084 × number of shale bed + 0.105 × number of coal seam + thickness of sandstone bed + 1.01 × thickness of shale bed + thickness of coal seam) for the Barakar Formation at 0.05 significance level. Though the contributions of all the parameters are statistically significant, the contributions of the thickness values are more significant in comparison to number values (Table 8). The findings of the principal component and multiple regression analyses in conjunction suggest that the thickness of sandstone bed and coal seam largely account for the net subsidence of the depositional basin during Barakar sedimentation in the Singrauli coalfield. The result agrees well with the deductions of Khan and Tewari [26] made by R-mode factor analysis.
5. Conclusions
Following conclusions have been drawn from the present study:
1) Markov chain analysis suggests the preferential arrangement of facies states and their organisation in the form of fining-upward asymmetric coal cycles. Each complete cycle exhibits upward decrease in grain size, which is possibly due to decline of flow intensity and current velocity coupled with lateral migration of streams during deposition of each cycle.
2) The lithofacies constituting the fining-upward cycles of the Barakar Formation can be linked with different sub-environments of braided stream fluvial system and their organization may be attributed to lateral migration of streams in response to intrabasinal differential subsidence. Each complete cycle with basal conglomerate or sandstone and terminating with a coal seam, suggest the establishment of some kind of channel system and subsequently its abandonment by stream and burial under peat swamp.
3) The Barakar cycles belong to the A-4 type cyclic sequences of Hattori (1976), which consists of different proportions of lower-, sideand upper-truncated cycles of lithologic states. The deposition of sandstones represents the most random event, which was possibly brought about by unsystematic change in the depositional mechanism activated by differential subsidence of the depositional area. Intrabasinal differential subsidence is responsible for the lateral migration of the river system and consequent initiation of new cycle with freshly transported coarse sediments.
4) Linear relationship between total thickness of strata and sedimentary cycles worked out by different workers for the cyclic sedimentation at other places is also applicable to the fluvial sediments of Barakar Formation of Singrauli coalfield. The number of cycles closely relates to the total thickness of strata. Since the Barakar Formation is essentially fluvial and the cycles are autocyclic in nature, the sedimentary distributive mechanism by lateral migration of streams might have been the probable means for the development of coal cycles. Thus, the cyclic sedimentation of Barakar Formation could have resulted due to intrabasinal differential subsidence of the
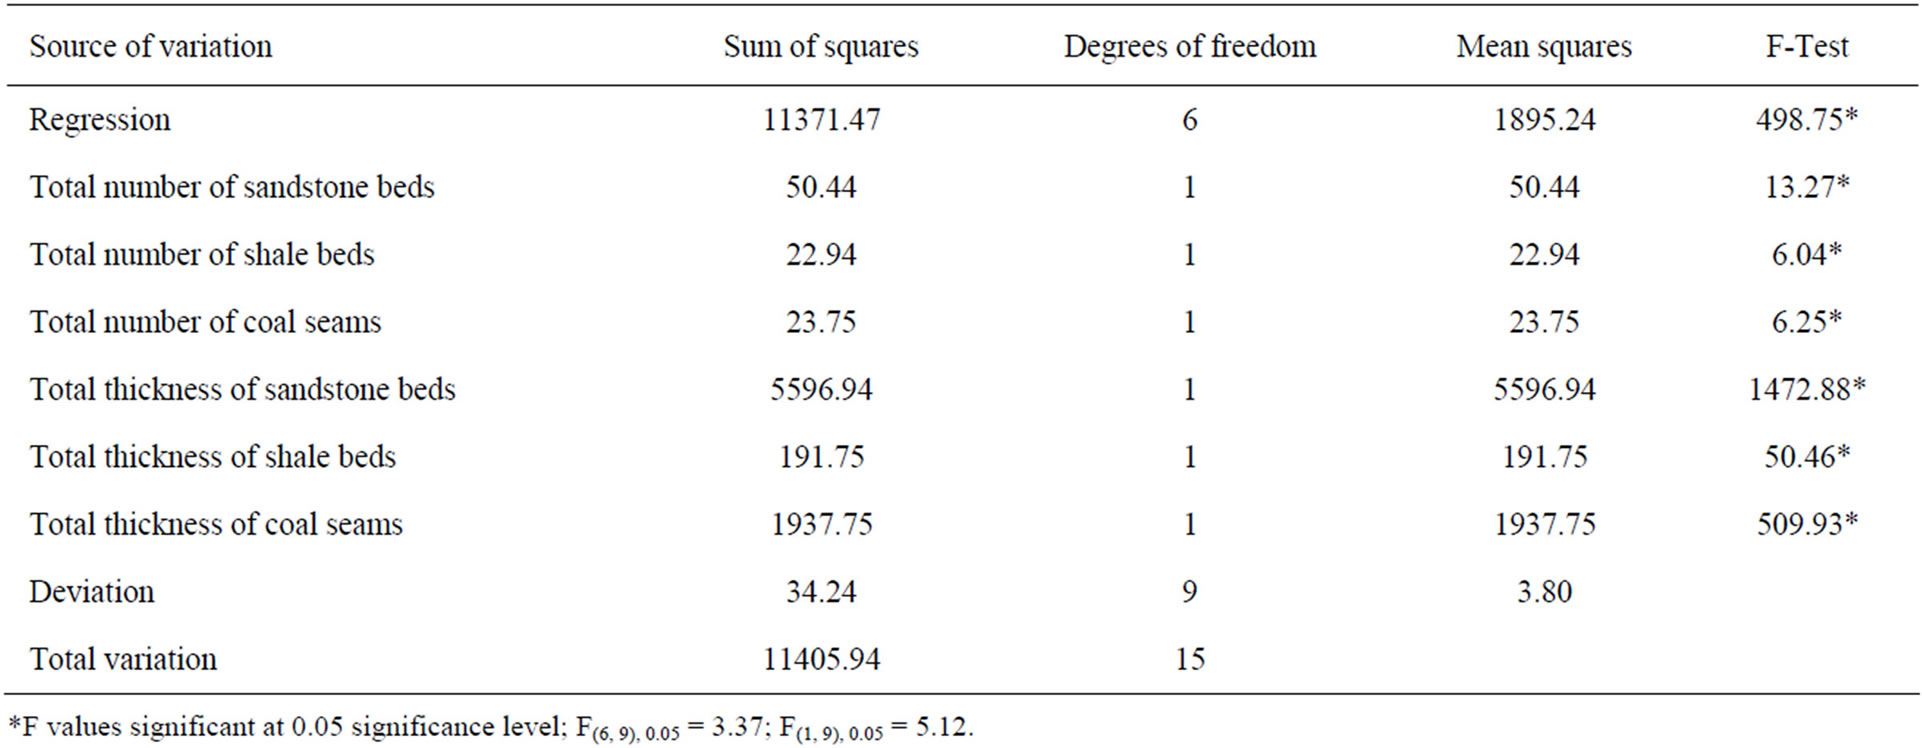
Table 8. Completed ANOVA for testing the significance of regression of individual lithologic variables on the total thickness of strata of the Barakar formation.
depositional surface. Poor correlation between total thickness of strata and average thickness of coal cycles suggests inconsistent relationship between subsidence and vegetation growth. The inverse relationship between number and average thickness of cycles might be due to frequent disruption of peat accumulations by clastic sediments issued by crevassing and/or avulsion from laterally migrating streams.
5) The multivariate methods of principal component and multiple regression analyses suggest that thickness of sandstone beds and coal seams largely account for the subsidence of the basin during Barakar sedimentation.
6. Acknowledgements
The authors are thankful to the authorities of the Central Mine Planning and Design Institute, Ranchi for providing the borehole data used in the present study and to the authorities of the Jayant coal mine for their cooperation during fieldwork. The authors are also thankful to the reviewer of the journal for critical scrutiny of the manuscript and valuable suggestions.
REFERENCES
- P. Billingsley, “Statistical Methods in Chains”, Annals of Mathematical Statistics, Vol. 32, No. 1, 1961, pp. 12-40. doi:/10.1214/aoms/1177705136
- J. W. Harbaugh and G. Bonham-Carter, “Computer Simulation in Geology,” Wiley Interscience, New York, 1970, p. 575.
- I. Hattori, “Entropy in Markov Chain and Discrimination of Cyclic Pattern in Lithologic Successions,” Mathematical Geology, Vol. 8, No. 4, 1976, pp. 477-497. doi:10.1007/BF01028983
- A. D. Miall, “Markov Chain Analysis Applied to an Alluvial Plain Succession,” Sedimentology, Vol. 20, No. 3, pp. 347-364. doi:10.1111/j.1365-3091.1973.tb01615.x
- S. M. Casshyap, “Cyclic Characteristics of Coal-Bearing Sediments in the Bochumer Formation (Westphal A2) Ruhrgebiet, Germany,” Sedimentology, Vol. 22, No. 2, 1975, pp. 237-255. doi:10.1111/j.1365-3091.1975.tb00292.x
- R. N. Hota, K. L. Pandya and W. Maejima, “Cyclic Sedimentation and Facies Organization of the Coal Bearing Barakar Formation, Singrauli Coalfield, Orissa, India: A Statistical Analysis of Subsurface Logs,” Journal of Geoscience, Vol. 46, 2003, pp. 1-11.
- R. N. Hota and W. Maejima, “Comparative Study of Cyclicity of Lithofacies in Lower Gondwana Formations of Talchir Basin, Orissa, India: A Statistical Analysis of Subsurface Logs,” Gondwana Research, Vol. 7, No. 2, 2004, pp. 353-362. doi:10.1016/S1342-937X(05)70789-9
- R. N. Hota and M. Sahoo, “Cyclic Sedimentation of the Karharbari Formation (Damuda Group), Talchir Gondwana Basin, Orissa,” Journal of the Geological Society of India, Vol. 73, No. 4, 2009, pp. 469-478. doi:10.1007/s12594-009-0032-x
- R. N. Hota and B. Das, “Cyclic Sedimentation of the Barren Measures Formation (Damuda Group), Talchir Gondwana Basin: Statistical Appraisal from Borehole Logs,” Journal of the Geological Society of India, Vol. 75, No. 3, 2010, pp. 549-559. doi:10.1007/s12594-010-0044-6
- R. N. Hota, “Relationship between Net Subsidence and Coal Cycle Parameters—A Statistical Appraisal from Subsurface Logs of Damuda Group, Talchir Gondwana Basin, India,” Mathematical Geosciences, Vol. 42, No. 2, 2010, pp. 223-242. doi:10.1007/s11004-009-9243-3
- P. McL. D. Duff, “Cyclic Sedimentation in the Permian Coal Measures of New South Wales,” Journal of the Geological Society of Australia, Vol. 14, No. 2, 1967, pp. 293-307. doi:10.1080/00167616708728667
- K. R. Johnson and A. C. Cook, “Cyclic Characteristics of Sediments in the Moon Island Beach Subgroup, New Castle Coal Measures, New South Wales,” Mathematical Geology, Vol. 5, No. 1, 1973, pp. 91-110. doi:10.1007/BF02114089
- W. A. Read and J. M. Dean, “Cycles of Subsidence: Their Relationship in Different Sedimentary and Tectonic Environments in the Scottish Carboriferous,” Sedimentology, Vol. 23, No. 1, 1976, pp. 107-120. doi:10.1111/j.1365-3091.1976.tb00041.x
- Z. A. Khan and R. C. Tewari, “Net Subsidence and Number of Coal Cycles; Their Interrelationship in Different Permian Gondwana Basins of Peninsular India,” Sedimentary Geology, Vol. 73, No. 1-2, 1991, pp. 161-169. doi:10.1016/0037-0738(91)90028-C
- J. C. DAVIS, “Statistics and Data Analysis in Geology,” John Wiley and Sons, Hoboken, 2002, p. 639.
- W. A. Read and J. M. Dean, “Quantitative Relationships between Numbers of Fluvial Cycles, Bulk Lithological Composition and Net Subsidence in a Scottish Namurian Basin,” Sedimentology, Vol. 29, No. 2, 1982, pp. 181-200. doi:10.1111/j.1365-3091.1982.tb01718.x
- R. C. Tewari, “Net Subsidence and Evolution of Coal Swamps in Early Permian Coal Measures of Eastern India Gondwana Basins Using Principal Component Analysis,” Journal of Geosciences, Vol. 51, No. 4, 2008, pp. 27-34.
- C. S. Raja Rao, “On Singrauli Coalfield,” In: C. S. Raja Rao, Ed., Coalfields of India—Coal resources of Madhya Pradesh and Jammu and Kashmir, Geological Survey of India, Kolkata, 1983, pp. 130-153.
- J. A. Udden, “Geology and Mineral Resources of Peoria Quadrangle, Illinois,” US Geological Survey Bulletin, No. 506, 1912, p. 103.
- J. M. Weller, “Cyclical Sedimentation of the Pensylvanian Period and Its Significance,” Journal of Geology, Vol. 38, No. 2, 1930, pp. 97-135. doi:10.1086/623695
- W. A. Read and J. M. Dean, “Cycles of Subsidence: Their Relationship in Different Sedimentary and Tectonic Environments in the Scottish Carboriferous,” Sedimentology, Vol. 23, No. 1, 1976, pp. 107-120. doi:10.1111/j.1365-3091.1976.tb00041.x
- S. Sengupta, “Introduction to Sedimentology,” CBS Publishers and Distributors, New Delhi, 2007, p. 314.
- R. C. Tewari, D. P. Singh and Z. A. Khan, “Application of Markov Chain and Entropy Analysis to Lithologic Succession—An Example from the Early Permian Barakar Formation, Bellampalli Coalfield, Andhra Pradesh, India,” Journal of Earth System Science, Vol. 118, No. 5, 2009, pp. 583-596. doi:10.1007/s12040-009-0037-2
- R. N. Hota and K. L. Pandya, “Quantitative Relationship between Net Subsidence and Coal Cycles in Barakar Formation, Talchir Coalfield, Orissa,” Journal of the Geological Society of India, Vol. 60, 2002, pp. 203-211.
- W. A. Read and J. M. Dean, “Principal Component Analysis of Lithologic Variables from Some Namurian (E2) Paralic Sediments in Central Scotland,” Bulletin of Geological Survey of Grate Britain, Vol. 40, 1972, pp. 83-99.
- Z. A. Khan and R. C. Tewari, “R-mode Factor Analysis of Lithologic Variables from Cyclically Deposited Late Paleozoic Barakar Sediments in Singrauli Gondwana Sub-Basin, Peninsular India,” Journal of Asian Earth Sciences, Vol. 40, No. 1, 2011, pp. 144-149. doi:10.1016/j.jseaes.2010.08.013
- B. K. Mishra and B. D. Singh, “The Lower Permian Coal Seams from Singrauli Coalfield (M. P.), India: Petrochemical Nature, Rank, Age and Sedimentation,” International Journal of Coal Geology, Vol. 14, No. 4, 1990, pp. 309-342. doi:10.1016/0166-5162(90)90086-E