Open Journal of Discrete Mathematics
Vol.2 No.2(2012), Article ID:18866,6 pages DOI:10.4236/ojdm.2012.22008
Some New Features and Algorithms for the Study of DFA
Department of Mathematics, Bar-Ilan University, Ramat Gan, Israel
Email: avraham.trakhtman@gmail.com
Received December 1, 2011; revised January 20, 2012; accepted February 17, 2012
Keywords: finite automaton; synchronizing word; algorithm; visualization
ABSTRACT
The work presents some new algorithms realized recently in the package TESTAS. The package decides whether or not DFA is synchronizing, several procedures find relatively short synchronizing words and a synchronizing word of the minimal length. We check whether or not a directed graph has a road coloring that turns the graph into a synchronizing deterministic finite automaton (DFA). The algorithm finds the coloring if it exists. Otherwise, the k-synchronizing road coloring can be found. We use a linear visualization of the graph of an automaton based on its structural properties.
1. Introduction
The problem of synchronization of a DFA is natural and various aspects of this problem were touched upon the literature. Synchronization makes the behavior of an automaton resistant against input errors since, after detection of an error, synchronizing word resets the automaton back to its original state, as if no error had occurred [1,2].
The early version of the package TESTAS was described in [3] in 2003. There exists some interest in the original algorithms of the package, sometimes even quite exotic [4]. The features of the package are considered also favorably for educational purposes: “The Road Coloring Conjecture makes a nice supplement to any discrete mathematics course” [5].
A problem with a long story is the estimation of the minimal length of a synchronizing word, (černy’s conjecture). Jan černy found in 1964 [6] n-state complete DFA with shortest synchronizing word of length (n − 1)2 for alphabet size q = 2. The problem can be reduced to automata with strongly connected graph. The best known upper bound is now equal to n(7n2 + 6n − 16)/48 [7]. černy’s conjecture together with the road coloring problem belong to the most fascinating problems in the theory of finite automata [8,9].
The package decides whether or not DFA is synchronizing, several procedures find relatively short synchronizing words (O(n3d) time complexity in the worst case) and a synchronizing word of the minimal length (nonpolynomial algorithm) [3,7,10]. The space complexity is quadratic. These procedures were successfully checked, in particular, in the program that has studied all transition graphs of automata with 10 states or less in a search of long synchronizing words [10]. The size of the set of studied objects was about 1020.
Imagine a map with roads which are colored in such a way that fixed sequence of colors, called a synchronizing sequence, leads to fixed place whatever is the starting point. Finding such a coloring is called road coloring problem. The roads of the map are considered as edges of a directed graph.
The road coloring conjecture [11-13] was stated over forty yeas ago for a complete strongly connected directed finite graph with constant outdegree of all its vertices where the greatest common divisor (gcd) of lengths of all its cycles is one. The edges of the graph being unlabelled, the task is to find a labeling that turns the graph into a deterministic finite automaton possessing a synchronizing word.
The problem was mentioned in “Wikipedia” on the list of the interesting unsolved problems in mathematics many years ago. The positive solution of the road coloring problem [14,15] is a basis of a polynomial-time implemented algorithm of O(n3) complexity in the worst case. The space complexity is quadratic.
For arbitrary complete graph the program finds ksynchronizing (or generalized [16]) road coloring [17].
The visualization of the transition graph of an automaton is an important tool for the study of automata. A tool for the visualization of the inner structure of a digraph is without any doubt an interesting matter, not only for the road coloring problem but also for a wide range of applications on directed graphs with labels on edges. For these reasons, the visual perception of the structural properties of an automata is an important goal.
The visualization algorithm is linear in the size of the automaton [17,18]. This property of the package is handy.
2. Preliminary
As usual, we regard a directed graph (digraph) with letters assigned to its edges as a finite automaton, whose input alphabet S consists of these letters. The graph is called a transition graph of the automaton. The letters from S can be considered as colors and the assigning of colors to edges will be called coloring.
A path in a digraph G is a sequence of edges e1, ···, ek such that the end vertex of ei is the start vertex of ei+1 for i = 1, 2, ···, k − 1. The path is called a cycle if e1 = ek.
A digraph is strongly connected if for every pair of vertices q, p there exists a path from q to p. An arbitrary digraph consists of some strongly connected components (SCC). An SCC is sink if from every vertex of digraph there exists a path to vertex of the SCC.
A finite directed strongly connected graph with constant outdegree of all its vertices where the gcd of lengths of all its cycles is one will be called an AGW graph (as introduced by Adler, Goodwyn and Weiss).
An automaton is deterministic if no state has two outgoing edges of the same color. In complete automaton each state has outgoing edges of any color.
If there exists a path in an automaton from the state p to the state q and the edges of the path are consecutively labeled by = a1···ak, then for s = a1. ak є S+ we shall write
q = ps
Let Ps be the set of states ps for p є P, s є S+. For the transition graph Г of an automaton let Гs denote the map of the set of states of the automaton.
The word s є S+ is called a synchronizing word of the automaton with transition graph Г if .
.
A coloring of a directed finite graph is synchronizing if the coloring turns the graph into a deterministic finite automaton possessing a synchronizing word.
Let the integer q denote the size of alphabet and let n be the number of nodes.
3. Algorithms for Testing Synchronizing Automata
The package TESTAS presents three distinct versions of polynomial time algorithm for synchronizing word based on different approaches [3,10,17]. The algorithms have O(n3d) time complexity in the worst case.
Every version finds synchronizing word of length near minimal. The last statement is a result of a lot of experiments. For instance, no synchronizing word of length greater than n2 was found. As for synchronizing word of minimal length, the problem is NP-hard [8].
The Algorithm for Synchronizing Word of Minimal Length
The algorithm is a revision of an algorithm for finding the syntactic semi-group of an automaton on the base of its transition graph [19]. The first step is a verifying of the existence of a sink state in Г. It is a necessary condition for to be synchronizing. We verify the relation of reachability r and form on the vertices of Г a quadratic table of reachability ( ) time and space complexity). Then let us find all sink states of Г (The columns of the table of reachability with equal elements.) The graph without sink has no synchronizing word. Otherwise, we continue.
For every pair of states ((p, q)), let us find their minimal length synchronizing word. ( time and space complexity). Let us denote the length of this word by l(p, q) and let l(M) be the length of the synchronizing word of mapping M. Obvious is the following.
Proposition 1 Let L be an upper bound of the length of synchronizing word of a pair of states. Then any mapping M such that the states p, q belong to M and l(p, q) > L does not belong to any sequence of mappings of minimal length synchronizing word.
Then by use an algorithm of polynomial time and space complexity let us find some synchronizing word and create a sequence of mappings M for every synchronizing word obtained on this way.
Proposition 2 Let L be an upper bound of the length of synchronizing word. Let S Ì M be two mappings, M is obtained by help of word of minimal length k, S belongs to some sequence of mappings of minimal length synchronizing word. Then the mapping M could belong to a sequence of mappings of minimal length synchronizing word only if k + l(S) £ L.
Mappings of the graph of the automaton induced by the letters of the alphabet of the labels are considered. They correspond to semi-group elements. Mappings with the same set of vertices are identified. Distinct mappings are saved. For this aim, any two mappings are compared, so we have  steps. We exclude mappings that do not satisfy the conditions of propositions 1, 2. So we have
 ) operations for the proposition 1 and
 ) operations for the proposition 2 on every step of creation of the set of mappings. Let us notice that the size of the syntactic semi-group is in general not polynomial in the size of the transition graph. Therefore the time and space complexity of the algorithm is not polynomial in the size of the graph in the worst case. Finding synchronizing word of minimal length is NP-hard [7]. Nevertheless, the use of the propositions 1 and 2 can essentially reduce the number of considered mappings. With any mapping let us connect a previous mapping and the letter that creates the mapping. On this way, the path on the graph of the automaton can be constructed. Any synchronizing mapping of the set of vertices presents a synchronizing word. The word can be restored from letters connected with mappings.
The algorithm founds a list of all words (elements of syntactic semi-group) of length k where k is growing. The first synchronizing word of the list is a synchronizing word of the minimal length.
The algorithm is valid for both complete and noncomplete graphs. The time complexity of the considered procedure is  with
with  space complexity.
4. The Algorithm for Synchronizing Coloring
The positive solution of the road coloring problem [14,15] is a base of a polynomial-time implemented algorithm of O(n3) complexity in the worst case. The study uses the following theorems.
Theorem 1 [14] Let every vertex of a strongly connected directed graph Г have the same number of outgoing edges. Then Г has synchronizing coloring if and only if the greatest common divisor of lengths of all its cycles is one.
Theorem 2 [9,14] Let us consider a coloring of an AGW graph Г. Let r be the transitive and reflexive closure of the stability relation on the obtained automaton. Then r is a congruence relation,  is also an AGW graph and a synchronizing coloring of
  implies a synchronizing recoloring of Г.
The input of the algorithm is a graph with an arbitrary coloring. The algorithm changes some colors of edges of the graph. At the end of the work of the implemented version, on the screen appears the layout of the graph without coloring and then in a second of artificial delay the desired coloring appears.
The Algorithm for k-Synchronizing Coloring
A k-synchronizing word of a deterministic automaton is a word in the alphabet of colors at its edges that maps the state set of the automaton at least on k element subset. A coloring of edges of a directed strongly connected finite graph of a uniform outdegree (constant outdegree of any vertex) is k-synchronizing the coloring turns the graph into a deterministic finite automaton possessing a ksynchronizing word.
The solution of the problem of k-synchronizing coloring based on the method from [14] appeared first in [20] and repeated later independently in [16].
Some consequences for coloring of an arbitrary finite digraph as well as for coloring of such a graph of a uniform outdegree are a matter of our interest. The minimal value of k for k-synchronizing coloring exists for any finite digraph and so a partially synchronized coloring can be obtained. The polynomial-time algorithm for k-synchronizing coloring has also O(n3) complexity at worst and quadratic space complexity [17].
5. The Visualization
The layout of the deterministic graph is demonstrated by a high-speed visualization program. The visualization of the transition graph of the automaton is an important help tool of the study of automata. However, the visibility of inner structure of a digraph without doubt is a matter of interest not only for the road coloring, the range of the application may be significantly wider and includes all directed graphs with labels on edges. The visual perception of the structure properties of the graph is an important goal.
Crucial role in the visualization plays the correspondence of the layout to the human intuition, the perception of the structure properties of the graph and the rapidity of the appearance of the image. The automatically drawn graphical image must resemble the last one of a human being and present the structure of the graph. We use and develop for this aim some known approaches [21,22].
The algorithm for the visualization is linear in the size of the automaton. This algorithm successfully solves a whole series of tasks of the disposal of the objects. Thus the linearity of the algorithm is comfortably and important. The pictorial diagram demonstrates the graph structure highlighting strongly connected components, paths and cycles. So this kind of visualization can be considered as a structure visualization.
Our main objective is a visual representation of a directed graph with labels on its edges and, in particular, of the transition graph of a deterministic finite automaton based on the structure properties of the graph. Among the important visual objects of a digraph one can mention paths, cycles, strongly connected components, cliques, bunches etc. These properties reflect the inner structure of the digraph. The strongly connected components (SCC) are here of special significance.
We choose here a cyclic layout [21,22]. According to this approach the vertices are placed at the periphery of a circle. Our modification of the approach considered two levels of circles, the first level consists of strongly connected components, the second level corresponds to the whole graph with SCC at the periphery of the circle. The visual placement is based on the structure of the graph considered as a union of the set of strongly connected components.
Clearly, the curve edges (used, for instance, in the package GraphViz [23,24]) hinder to recognize the cycles and paths. Therefore, we use only direct and, hopefully, short edges. Some priorities of the layout are changed and, in particular, is eliminated the goal of reducing the number of intersections of the edges. It was an important aim in some algorithms [24]. The intersections of the edges are even not considered in our algorithm. This approach gives us an opportunity to simplify essentially the procedure and to reduce its complexity.
Our main intent is only not to stir by the intersections of the edges to conceive the structure of the graph. The intersections are placed in our algorithm far from the vertices due to the cyclic layout [21,22] we use. The area of vertices differs of the area of the majority of intersections.
Visualization Algorithm
The strongly connected components (SCC) are of special significance in the algorithm. Thus our first step is the selection of the SCC. The quick linear algorithm for finding SCC [25] is implemented in the program. All SCC are placed on the periphery of a big circle and are ordered according to the size [18]. So strongly connected components can be easily recognized by the observer. The pictorial diagram demonstrates the structure of the graph and the visualization can be considered as a kind of a structure visualization.
According to the cyclic approach, the vertices arranged in a circle of SCC in the graph layout.
The periphery of a circle of SCC is the most desirable area for placing the edges because the edges in this case are relatively short. We choose the order of the vertices of the SCC on the circle according to this purpose. The length of some edges can be reduced in such a way. It also helps to recognize paths and cycles on the screen.
Otherwise, the edges between distinct SCC are relatively longer than the inner edges of strongly connected components.
The problem of the placing of the labels near corresponding edges is sometimes very complicated and frequently the connection between the edge and its label is not clear. Our solution is to use colors on the edges instead of labels and exclude the placing of labels.
The set of loops of arbitrary vertex is placed around the vertex with some shift that depends on the size of the set. The problem of parallel edges is solved analogously, the origins of the edges must belong to the vertex. The complexity of the algorithm shows the following.
Lemma 1 The time and space complexity of the visualization algorithm described above is linear in the sum of states and edges of the transition graph of the automaton.
The transition graph of any deterministic finite automaton is accepted by the visualization algorithm. The transitions graphs of non-complete automata also can be reproduced.
6. Input of Data in the Package
The input file is an ordinary txt file for all algorithms used in the package TESTAS. We open the source file and then check different properties from menu bar. The graph is shown on the display by help of a rectangular table. More precisely, the transition graph of an automaton as well as an arbitrary directed graph with distinct labels on outgoing edges of every vertex is presented by the matrix (Cayley graph):
vertices X labels
First two numbers in input file are the size of alphabet of labels and the number of vertices. The integers from 0 to n – 1 denote the vertices. i-th row is a list of successors of i-th vertex according to the label in the column (number o the vertex from the end of edge with label from the j-th column and beginning in i-th state is placed in the (i,j) cell). The User defines the data: the number of nodes, size of the alphabet of edge labels and the values in the matrix. For example, the input 2 6 1 0 2 1 0 3 5 2 3 2 4 5 presents the Cayley graph with 2 labels and 6 vertices and the next input 2 5 1 0 2 1; 3 5; 3; presents the Cayley graph (non complete) with 2 labels and 5 vertices. The values are divided by a gap. The semicolon corresponds to empty cell of the table.
The graph from Figure 1 with matrix representation in Table 1 and the graph from Figure 2 with matrix representation in Table 2.
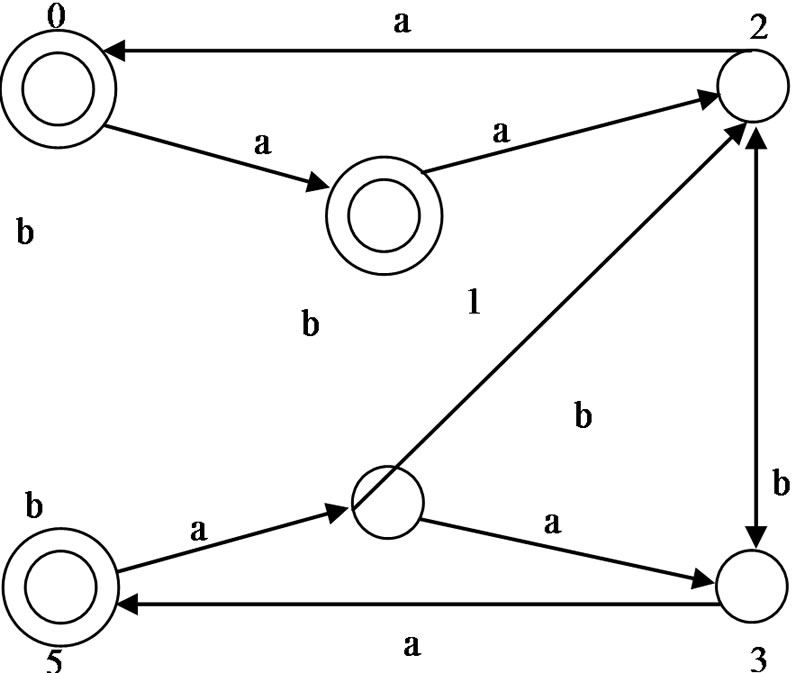
Figure 1. Cayley graph with 2 labels and 6 vertices.
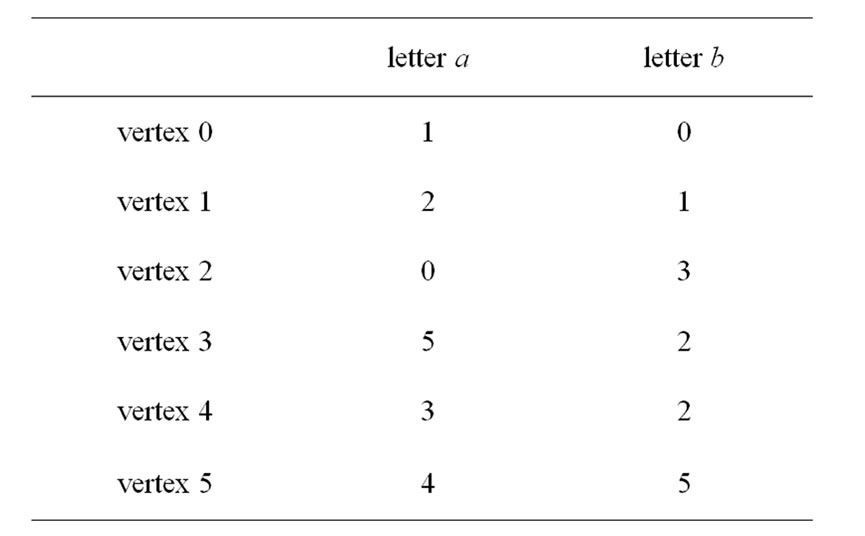
Table 1. Matrix representation.
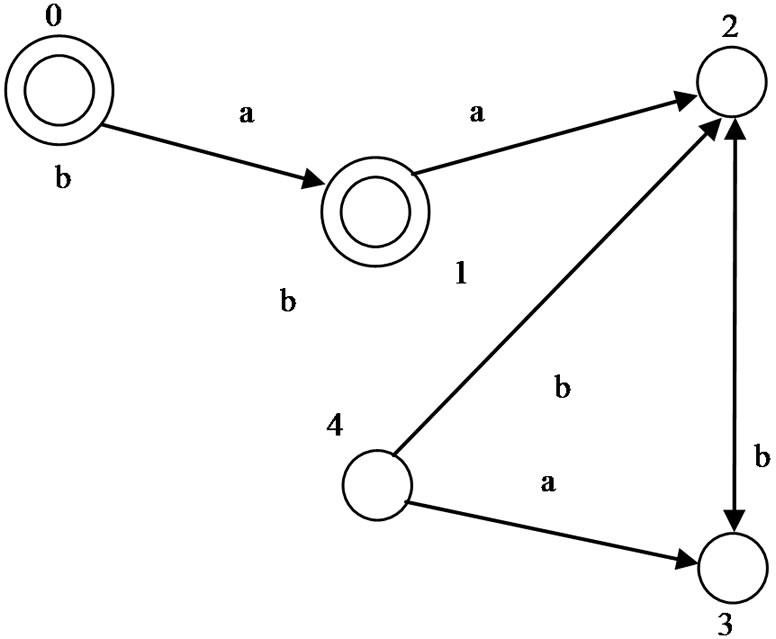
Figure 2. Cayley graph (non complete) with 2 labels and 5 vertices.
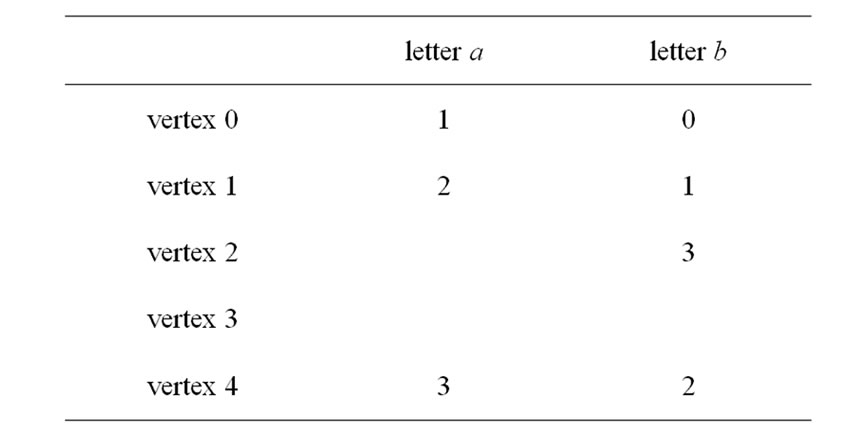
Table 2. Matrix representation.
An important verification tool of the package is the possibility to study the semi-group of an automaton. The program finds syntactic semi-group of the automaton, its size and generators. The semi-group is presented by a quadratic table of the form elements X generators (letters). In the cell (i, j) is a product of element i and generator j. The first line of the table presents the size of the semi-group and the number of generators.
REFERENCES
- M. P. Beal, E. Czeizler, J. Kari and D. Perrin, “Unambiguous Automata,” Mathematics and Computer Science, Vol. 1, No. 4, 2008. pp. 625-638. doi:10.1007/s11786-007-0027-1
- D. Perrin and M. P. Schutzenberger, “Synchronizing Prefix Codes and Automata, and the Road Coloring Problem,” Symbolic Dynamics and Applications, Contemporary Mathematics, Vol. 135, 1992, pp. 295-318. doi:10.1090/conm/135/1185096
- A. N. Trahtman, “A Package TESTAS for Checking Some Kinds of Testability,” Implementation and Application of Automata, Vol. 2608, 2003, pp. 228-232. doi:10.1007/3-540-44977-9_22
- C. Robert Berwick, K. Okanoya, Z. Gabriel, J. L. Beckers and J. J. Bolhuis, “Songs to Syntax: The Linguistics of Birdsong,” Trends in Cognitive Science, Vol. 15, No. 3, 2011, pp. 113-121. doi:10.1016/j.tics.2011.01.002
- J. V. Rauff, “Way Back from Anywhere: Exploring the Road Coloring Conjecture,” Mathematical and Computer Education, Vol. 43, No.1, 2009, pp. 6-17.
- J. Černy, “Poznamka k Homogenym Eksperimentom s Konechnymi Automatami,” Matematicko Fyzicalny Časopis, Vol. 14, 1964, pp. 208-215.
- A. N. Trahtman, “Modifying the Upper Bound on the Length of Minimal Synchronizing Word,” Fundamentals of Computation Theory, Vol. 6914, 2011, pp. 173-180. doi:10.1007/978-3-642-22953-4_15
- A. Mateescu and A. Salomaa, “Many-Valued Truth Functions, Černy’s Conjecture and Road Coloring,” Bulletin of European Association for TCS, Vol. 68, 1999. pp. 134- 148.
- K. Culik II, J. Karhumaki and J. Kari, “A Note on Synchronized Automata and Road Coloring Problem,” Journal of Foundations of Computer Science, Vol. 13, No. 3, 2002, pp. 459-471. doi:10.1142/S0129054102001217
- A. N. Trahtman, “An Efficient Algorithm Finds Noticeable Trends and Examples Concerning the Černy Conjecture,” Mathematical Foundations of Computer Science, Vol. 4162, 2006, pp. 789-800.
- R. L. Adler and B. Weiss, “Similarity of Automorphisms of the Torus,” Memoirs of the American Mathematical Society, Providence, RI, 1970, p. 98.
- R. L. Adler, L. W. Goodwyn and B. Weiss, “Equivalence of Topological Markov Shifts,” Israel Journal of Mathematics, Vol. 27, No. 1, 1977, pp. 49-63. doi:10.1007/BF02761605
- B. A. Rubshtein, “Generating Partitions of Markov Endomorphisms,” Functional Analysis Applications, Vol. 8, No. 1, 1974, pp. 84-85. doi:10.1007/BF02028320
- A. N. Trahtman, “Synchronizing Road Coloring,” 5-th IFIP World Computer Congress—Theoretical Computer Science, Vol. 273, 2008, pp. 43-53.
- A. N. Trahtman, “The Road Coloring Problem,” Israel Journal of Mathematics, Vol. 172, No. 1, 2009, pp. 51- 60. doi:10.1007/s11856-009-0062-5
- G. Budzban and Ph. Feinsilver, “The Generalized Road Coloring Problem and Periodic Digraphs,” Applied Algebra in Engineering, and Computing, Vol. 22, No. 1, 2011, pp. 21-35. doi:10.1007/s00200-010-0135-z
- A. N. Trahtman, “A Partially Synchronizing Coloring,” Computer Science—Theory and Applications, Vol. 6072, 2010, pp. 362-370.
- A. N. Trahtman, T. Bauer and N. Cohen, “Linear Visualization of a Road Coloring,” Proceedings of 9th Cologne Twente Workshop on Graphs and Combinatorial Optimization, 2010, pp. 13-16.
- A. N. Trahtman, “Verification of Algorithms for Checking Some Kinds of Testability,” In: F. Spoto, G. Scollo and A. Nijholt, Eds., Algebraic Methods in Language Processing, TWLT 21, Universiteit Twente, Holland, 2003, pp. 253-263.
- M. P. Béal and D. Perrin, “A Quadratic Algorithm for Road Coloring,” arXiv: 0803.0726v2 [cs.DM], 2008.
- J. M. Six and I. G. Tollis, “A Framework for UserGrouped Circular Drawings,” Graph Drawing, Vol. 2912, 2004, pp. 135-146. doi:10.1007/978-3-540-24595-7_13
- J. M. Six and I. G. Tollis, “A Framework for Circular Drawings of Networks,” Graph Drawing, Vol. 1731, 1999, pp. 107-116. doi:10.1007/3-540-46648-7_11
- J. Ellson, E. Gansner and L. Koutsofios, “GraphViz— Open Source Graph Drawing Tools,” Graph Drawing, Vol. 2265, 2002, pp. 594-597. doi:10.1007/3-540-45848-4_57
- M. Simonato, “An Introduction to GraphViz,” Linux & Unix, Excerpts, Linux Devcenter, 2004.
- A. Aho, J. Hopcroft and J. Ulman, “The Design and Analysis of Computer Algorithms,” Addison-Wesley, Boston, 1974.