Optics and Photonics Journal
Vol.3 No.4A(2013), Article ID:35643,7 pages DOI:10.4236/opj.2013.34A001
Synthesis and Optical Investigations on (Ba,Sr)TiO3 Borosilicate Glasses Doped with La2O3
Advanced Glass and Glass Ceramic Research Laboratory, Department of Physics, University of Lucknow, Lucknow, India
Email: *gautam_ceramic@yahoo.com
Copyright © 2013 C. R. Gautam, Avadhesh Kumar Yadav. This is an open access article distributed under the Creative Commons Attribution License, which permits unrestricted use, distribution, and reproduction in any medium, provided the original work is properly cited.
Received May 1, 2013; revised June 11, 2013; accepted July 16, 2013
Keywords: (Ba,Sr)TiO3; Infrared Spectroscopy; UV-Vis Spectroscopy; Raman Spectroscopy
ABSTRACT
In this research paper we are reporting synthesis, structural and optical investigations of barium strontium titanate borosilicate glasses with addition of La2O3. Glasses were synthesized by conventional rapid melt quench method. Infrared absorption spectra, for various (Ba,Sr)TiO3 borosilicate glass samples having glass system 64[(Ba1-xSrx)TiO3]- 35[2SiO2-B2O3]-5[K2O]-1[La2O3] (x = 0.3, 0.5, 0.6, 0.8 and 1.0), were recorded over a continous spectral range from 450 - 4000 cm−1. IR spectra were analyzed to determine and differentiate the various vibrational modes in the structural changes. Raman spectroscopy of all glass samples were also carried out wavenumber range form 200 - 1500 cm−1. These two complementary spectroscopic techniques revealed that the network structure of the studied glasses is mainly based on BO3, pentaborate groups linked to BO4 tetrahedra and units placed in different structural groups, the BO3 units are dominanting. The recorded IR and Raman spectra of different glasses are used to clarify the optical properties of the prepared glass samples correlating with their structure and compositions. UV-Vis spectroscopy was carried out in range of 200 - 800 nm. The optical band gap was found between 2.023 - 3.320 eV.
1. Introduction
Glasses are defined as inorganic product of fusion which has been cooled to a rigid condition without crystallization without crystallization [1]. The main distinction between glass and crystals is the presence of long range order in the crystal structure. A widespread set of very different borate glasses with optical, magnetic, superionic conductivity and other technologically interesting properties are currently produced. The optimization of such properties as a function of compositions and other synthesis parameters are required a good knowledge of the microscopic glassy structure. For many years, glasses containing transition metal ions have attracted attention because of their potential applications in electrochemical, electronic and electro-optic devices [2]. IR spectroscopy is one of the most common spectroscopic techniques used by organic and inorganic chemists. Simply, it is the absorption measurement of different IR frequencies by a sample positioned in the path of an IR beam. The main goal of IR spectroscopic analysis is to determine the chemical functional groups of the samples. Using various sampling accessories, IR spectrometers can accept a wide range of types of sample such as gases, liquids, and solids. Thus, IR spectroscopy is an important and popular tool for structural elucidation and compound identification [3]. Raman spectroscopy is also an essential tool for characterization of the structure, environment, and dynamics of glassy materials. Furthermore, the portability of the technique allows for its use in on-line process monitoring [4]. In Raman spectroscopy, the nature of the light matter interaction is not same as in IR spectroscopy and the fundamental differences between the two processes determine the selection rules, which control Raman or IR activity of normal mode of vibrations. Interaction of IR radiation with a normal mode of vibration only occurs when the electric field of radiation oscillates with same frequency as instant dipoles caused by atomic vibrations. A normal vibration can be IR active only if a change in the dipole moment of the vibration occurs and is a one photon process, as only photon is absorbed [5]. Therefore, IR spectra give addition information than Raman spectra by which the symmetries of normal modes of vibration of molecules and crystal lattices are determined [6-8]. Addition of various alkali modifiers, A2O (A: Li, Na, K, Rb, Cs), to the borate glasses brings drastic changes in the structural units. The structure of alkali borates glassy matrix is a complex three-dimensional network of boron and oxygen composed of larger structural units. The added modifier can act in two different ways: by forming four-coordinated boron ( ) and by forming non-bridging oxygen (NBO). These two structural units are described by reaction given bellow:
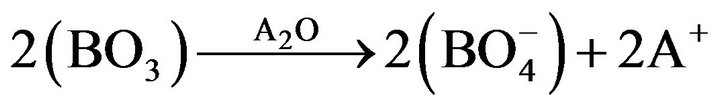 (1)
(1)
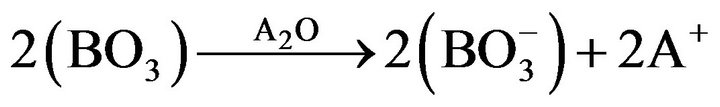 (2)
(2)
The existence of four coordinated boron in alkalidoped borate glasses has been studied extensively for a wide variety of modifiers through various spectroscopic techniques such as IR, Raman, NMR, and NQR spectroscopy [9,10]. Recently, our group reported few publications on structural, crystallization and dielectric studies of (Pb,Sr)TiO3 borosilicate glass and glass ceramics. These studies shows very high dielectric constant and La2O3 was act as nucleating agent as well as network modifier [11-13]. More recently, we are reported on results of structure, crystallization kinematics of (Ba,Sr) TiO3 borosilicate glasses. These glasses are technologically important for making optical active devices due to high refractive index and their glass ceramics shows the sluggishness of the crystallization in glass matrix due to doping of La2O3 [14,15].
2. Experimental Procedure
2.1. Sample Preparation
High purity analytical reagent grade chemicals BaCO3 (Himedia 99%), SrCO3 (Himedia 99%), TiO2 (Himedia 99%), SiO2 (Himedia 99.5%), H3BO3 (Himedia 99.8%), K2CO3 (Himedia 99.9%), La2O3 and (Himedia 99.9%) were used for the preparation of various glass samples having glass system 64[(Ba1-xSrx)TiO3]-30[2SiO2-B2O3]- 5[K2O]-1[La2O3] (x = 0.3, 0.5, 0.6, 0.8 and 1.0). Appropriate amounts of raw materials, as per the composition of glasses, were properly weighed and mixed in an agate mortar using acetone as mixing medium and dried the powder. The glass batches of 20 grams were melted in a high-grade alumina crucible in open air atmosphere using a programmable electric furnace. The melting temperatures for different compositions were in the range 1050˚C - 1450˚C. The melt was maintained at the melting temperature in the furnace for 10 minutes for refining and homogenization. The melt was poured into an aluminum mould and pressed by a thick aluminum plate then immediately transferred in to a preheated muffle furnace for annealing at temperature 450˚C for 3 hours to remove the residual stresses due to temperature gradient, which is produced by rapid cooling. The glasses were cooled to room temperature within the furnace after annealing. Nomenclature of prepared glass samples contains six letters (BSTKL and T) and four digit groups (5, 1 and 0.3 to 1.0 digit numbers). First three letters BST refers to barium strontium titanate borosilicate. The term 5 K designates the 5% of K2O while term L indicates, whether La2O3 is used as donar dopants and the numeric term before L denotes molecular percentage of La2O3. The last numeric number denotes the content of strontium or composition, x value.
2.2. Infrared Spectroscopy
The powdered glass samples were mixed with KBr powder and pressed as pellets. Then, these pellets are used as samples for recording the IR spectra. The IR spectra of BST borosilicate glasses are carried out using JASCO FT/IR-5300 in the wave number range 450 - 4000 cm−1 at room temperature.
2.3. Raman Spectroscopy
The powdered glass samples are used as in the wave number range from 200 - 1500 cm−1. Micro Raman setup, Renishaw, UK, equipped with a grating of 1800 lines/ mm and Olympus (model MX-50) A/T was attached with spectrometer which focuses laser light into sample and collect the scattered at 1800 by scattering geometry. The 15.4 nm Ar+ laser was used as an excitation source and GRAM-32 software for data collection.
2.4. UV-Vis Spectroscopy
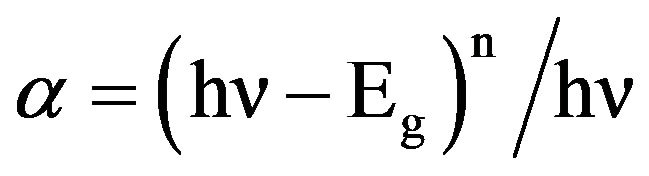
UV-visible absorption spectroscopy is a very useful technique to characterizing the optical and electronic properties of different materials such as thin films, filters, pigments and glasses. Measurement of the optical band gap of glass sample is carried out using the data within range 200 - 800 nm obtained by spectrophotometer. UV-vis spectroscopy of the samples was carried out using UVvisible spectrophotometer (Varian, Carry-50Bio). It measures the percentage of radiation in the different regions such as ultra-violet (200 - 400 nm) and visible (400 - 800 nm) regions that is absorbed at each wavelength within ultra-violet and visible regions. Optical transitions are basically two types, direct and indirect transitions. In these transitions, the electromagnetic radiations interact with the electrons in the valence band and which reaches to conduction band by gaining fundamental band gap. These transitions occur in both crystalline and amorphous semiconductor materials. These transitions are related with Mott and Davis relation. For photon energies just above fundamental edge, the relation between absorption coefficient (α) and photon energy is given below [16,17]:
 (3)
(3)
where A is a constant related to the extent of the band tailing, n =  for allowed direct transition, n = 2 for allowed indirect transition, hυ is the photon energy and Eg is the optical band gap energy of the material. The absorption coefficient, α, was calculated at different photon energies by using the relation, α =
 , where A is the absorbance and d the thickness of the samples. The optical band gap, Eg, was calculated by extrapolating the linear parts of the curves to
  of curve
  verses hυ and extrapolating for the glass samples.
2.5. Density Studies of Glass Samples
The density strongly depends on the composition and structure of the samples Density of the glass samples were determined by liquid displacement method of Archimedes principle [18]. Distilled water was used as the liquid medium. Density of glass and glass ceramic samples were calculated using the formula:
 (4)
(4)
ρ = Density (gram/cc);
W1 = Weight of empty specific gravity bottle (gram);
W2 = Weight of specific gravity bottle with sample (gram);
W3 = Weight of specific gravity bottle with sample and distill water (gram);
W4 = Weight of specific gravity bottle with distill water (gram).
3. Results and Discussion
3.1. Infrared Spectroscopy
The IR spectra for various glass samples of BST borosilicate glasses doped with La2O3 are shown in Figure 1. IR spectra of all glass samples consist of various absorption bands in different regions lies between wavenumbers 450 - 4000 cm−1. These bands are influenced by doping the variation in content of Ba/Sr ratio because the positions of some absorption bands are shifted due to compositional variations. Wavenumbers of different absorption peaks for all the glass samples have been listed in Table 1. The first absorption band lies in wavenumber range 3440 - 3470 cm−1. The position of this broad band slightly shifted towards lower wavenumber side with increasing the concentration of Sr. This absorption band occurs due to molecular water inside the glassy network [19]. Absorption bands were observed in the wavenumber range 2853 - 2924 cm−1 and these absorption bands
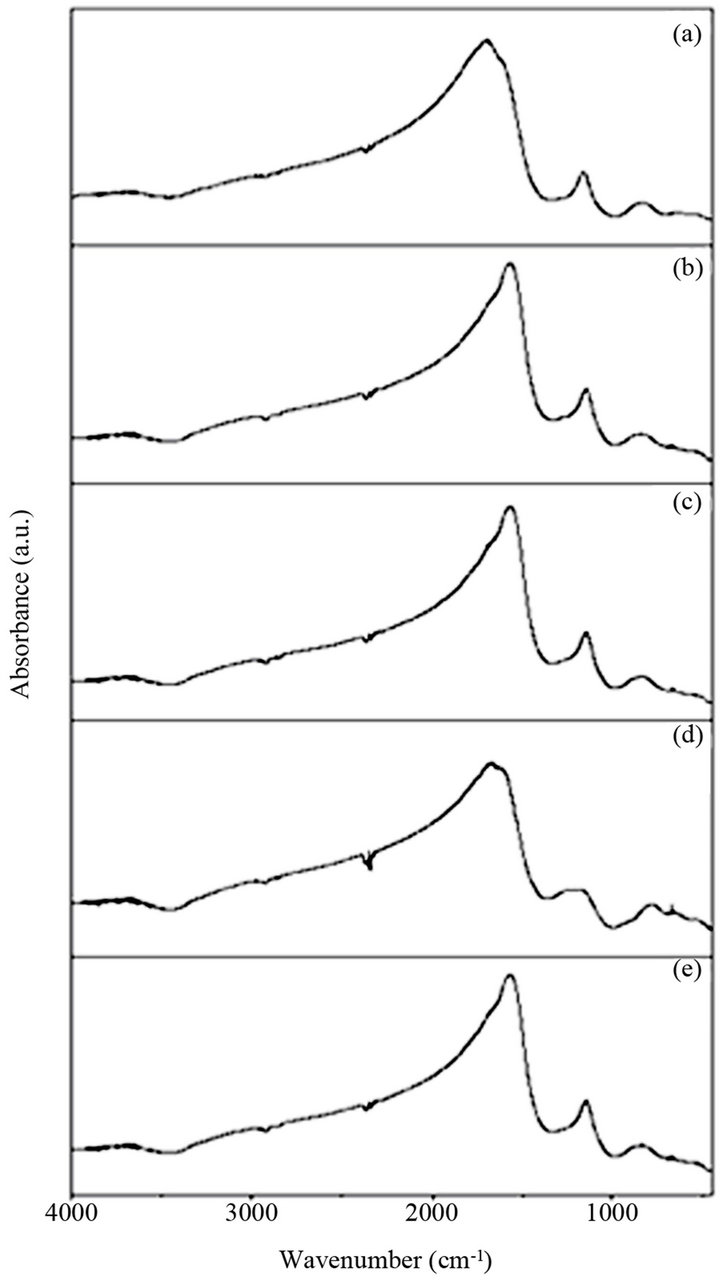
Figure 1. IR spectra of BST borosilicate glass samples: (a) BST5K1L0.3; (b) BST5K1L0.5; (c) BST5K1L0.6; (d) BST 5K1L0.8 and (e) ST5K1lL1.0.
are attributed to formation of hydrogen bonding [20-22]. These bands are almost unaffected by the variations of Ba/Sr ratio. An IR spectrum of these glass samples also shows diffused absorption bands in wavenumbers range 2340 - 2365 cm−1. The doublet splitting was observed in this band and attributed to -OH bonding vibrations which are formed at non-bridging oxygen sites and hydroxyl groups are usually present in borate glasses. The presence of -OH groups may due to the KBr pellet technique used to record IR spectra [23]. There are few absorption bands in the wavenumber range 1275 - 1739 cm−1 are observed due to the asymmetric stretching relaxation of the B-O bonds of trigonal BO3 units. Such types of vibrational modes were observed within wavenumbers range from 1200 - 1750 cm−1 [24,25]. The band at 1560 cm−1 was absent in all glass samples except glass samples BST5K1L0.5 and BST5K1L0.6. The bands near wavenumber 1737 cm−1 are present only in barium rich glass
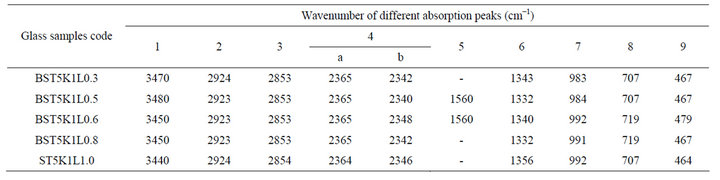
Table 1. Peak positions in IR spectra of glass samples in the system 64[(Ba1-xSrx)TiO3]-35[2SiO2.B2O3]-5 [K2O]-1[La2O3].
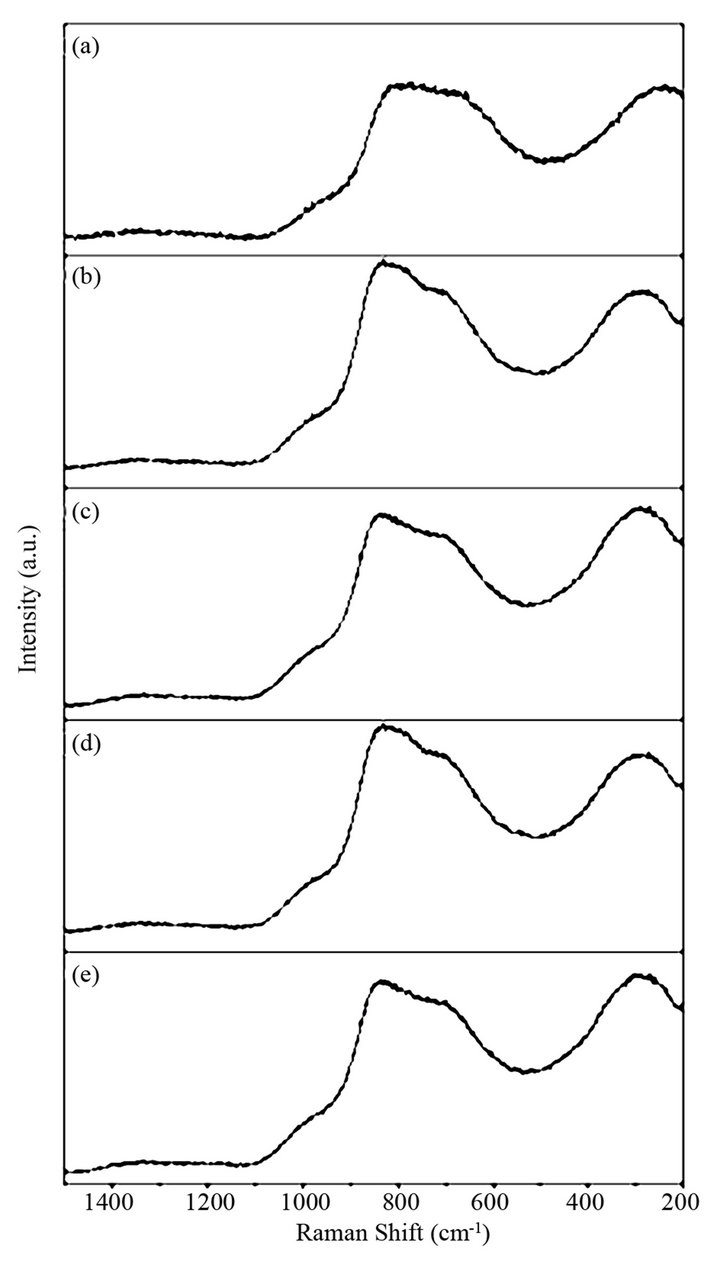
Figure 2. Raman spectra of BST borosilicate glass samples: (a) BST5K1L0.3, (b) BST5K1L0.5, (c) BST5K1L0.6, (d) BST5K1L0.8 and ST5K1lL1.0.
samples. A nonlinear trend for band near 1332 cm−1 was observed. A broad absorption band at around 983 cm−1 is attributed to a stretching vibration of B-O-Si linkage [26]. A weak absorption band is observed within the wavenumber range 707 - 719 cm−1 in IR spectra of all glass
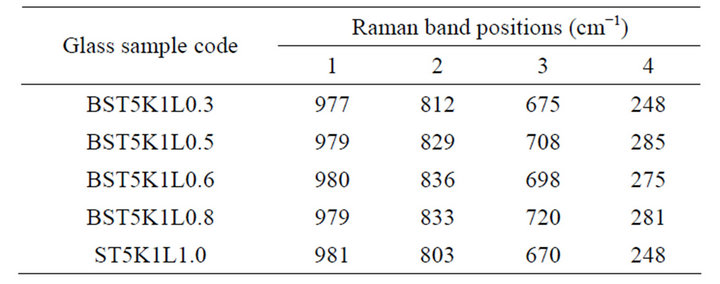
Table 2. Peak positions in Raman spectra of different glass samples in the glass system 64[(Ba1-xSrx) TiO3]-30[2SiO2. B2O3]-5[K2O]-1[La2O3].
samples. This band was present due to the diborate linkage, B-O-B, in the borate glassy network. In this linkage both boron atoms are tetrahedrally coordinated with triborate super structural units [27,28]. In these glass samples no absorption peak at 806 cm−1 was observed and it confirms the absence of boroxol ring in glassy network. The bands at low frequencies are observed in the IR spectra of all glass samples and can be attributed to vibration of metal cation such as Ba2+ and Sr2+. The similar bands were also present in IR spectra of PbO-B2O3 glasses and attributed to the vibrations of Pb2+ cations [29]. Hence network-modifying behavior is observed in which these ions enters the interstices of the network. This is supports to our results, and network-modifying behavior of BaO and SrO are observed.
3.2. Raman Spectroscopy
Raman spectra of different BST borosilicate glass samples doped with La2O3 are shown in Figures 2(a)-(e) and the peak positions of Raman bands have been listed in Table 2. Each Raman spectra indicate four different kinds of peaks. Raman pattern of glass sample BST5K1L 0.3 is shown in Figure 2(a). It shows four broad and overlaped peaks at different wavenumbers 248, 675, 812 and 977 cm−1. The Raman band at wavenumber 977 cm−1 was occured due to B-O− stretching in orthoborate units [30]. The peak at 675 cm−1 is the characteristic of B-O-B stretching in metaborate rings [31,32] while peak at wavenumber 812 cm−1 occurs due to symmetric breathing vibrations of boroxol rings [33,34]. Raman bands of glass sample BST5K1L0.5 shows four bands at various wavenumbers 285, 708, 829 and 979 cm−1 respectively (Figure 2(b)). The Raman band near 829 cm−1 is attributed to B-O-B stretching in pyroborate units [31,32]. Figure 2(c) depicts the Raman spectra of glass sample BST5K1L0.6 and showing three distinct peaks with different intensities at wavenumbers 275, 698, 836 and 980 cm−1. These Raman bands were also present in glass samples BST5K1L 0.8 and ST5K1L1.0 with slight shifting in their wavenumbers (Figures 2(d)-(e)). The non linear variations were observed with changing the Ba/Sr ratio in glassy matrix. When the content of Sr was increased from 0.6 to 0.8 or 1.0, the band at 836 shifted towards lower wavenumber side. This may be due to non uniform variation in symmetry and dipole moment during the measurements. The weak Raman peak were observed their spectra due to metalic cations towards low wavenumber side. The assignment of IR and Raman bands in the spectra of different glass samples are summarized in Table 3.
3.3. UV-Vis NIR Spectroscopy
UV-visible absorption spectra of various (BaSr)TiO3 borosilicate glass samples have shown in Figure 3. The band gap, Eg for BST borosilicate glasses have been listed in Table 4.
There is not any sharp increase in absorption at energies closed to the band gap that manifests itself as an absorption edge in the UV-visible absorption spectra and it is indicating the amorphous nature of glass samples. It is observed that absorption edges shifted towards higher wavelength side with to increasing concentration of SrO. For pure Sr glass sample of composition, a drastic increase in its absorption edge at increasing the content of SrO and which shows red shift due 580 nm, which shows the translucency inside glass sample. The indirect optical band gap of BST borosilicate glasses are determined by using Davis and Mott relation as discussed in section 2.4. The plot of hυ versus (αhυ)1/2 shown in Figure 4. The optical band gap was found to be lie in range of 2.023 3.320 eV. The similar results were also reported on BaTiO3 by Suzuki [35]. The band gap decreases with increasing the concentration of SrO. This shows the composition dependence of optical band gap [36,37]. The pure Sr content glass sample has lowest band gap value 2.023 eV. This sudden difference for band gap value may be due to the variation of non-bridging oxygens. The shift of the absorption edge to a higher wavelength or decrease of Eg with increasing SrO content may be due to more porous nature of Sr rich glass samples than that of Ba rich glass samples, and also increased the oxygen amount inside the samples. Hence, an increase in the formation of bridging oxygen (BO4 units) and which makes the sample more semiconducting [38].
3.4. Density Studies
The density of BST borosilicate glasses was found between 2.55 - 2.84 gm/cc. It decreases with increasing concentration of SrO in the BST borosilicate glasses while it increases with increasing the concentration of La2O3. This may be due to high density of Ba (3.51 g/cc) and Sr (2.61 g/cc). Almost linear trend was observed in the density of glasses following equation y = 3 − 0.46x and this was shown in Figure 5. The values of density of BST borosilicate glasses have been listed in Table 4.
4. Conclusion
Perovskite bulk transparent BST borosilicate glasses were prepared successfully by rapid melt quench method. The IR and Raman bands were found to be composition dependent. IR spectra of BST borosilicate glass samples shows that borate is major network former in this glass system and it is also confirmed by Raman spectroscopic studies. The vibrations due to metallic cations (Ba2+ and Sr2+) are also play important role as a network modifier at lower wavenumber sides in their IR as well as Raman spectra. The optical band gap shows slight dependence on compositions and it was found lowest for the glass sample ST5K1L1.0 (2.023 eV).
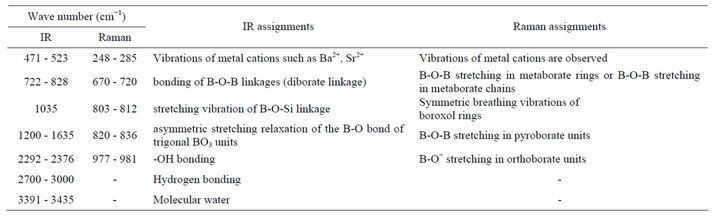
Table 3. Assignment of infrared and Raman bands in the spectra of different glass samples.
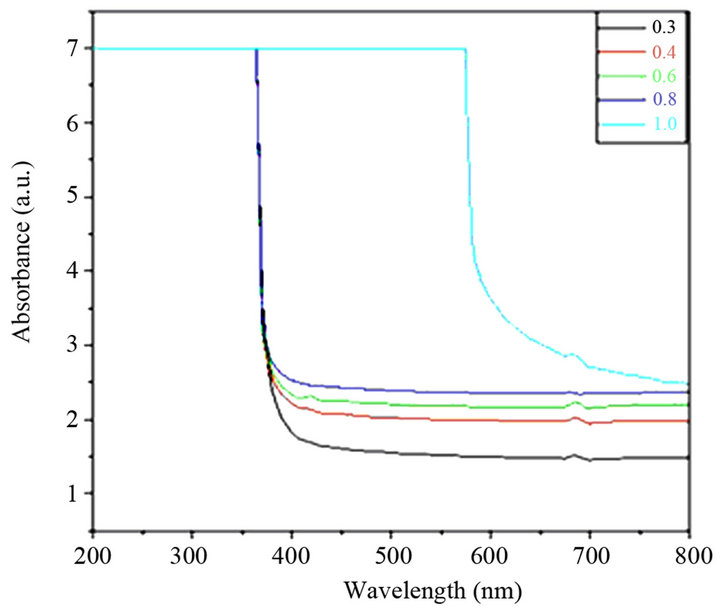
Figure 3. UV-visible absorption spectra of all BST borosilicate glass samples.
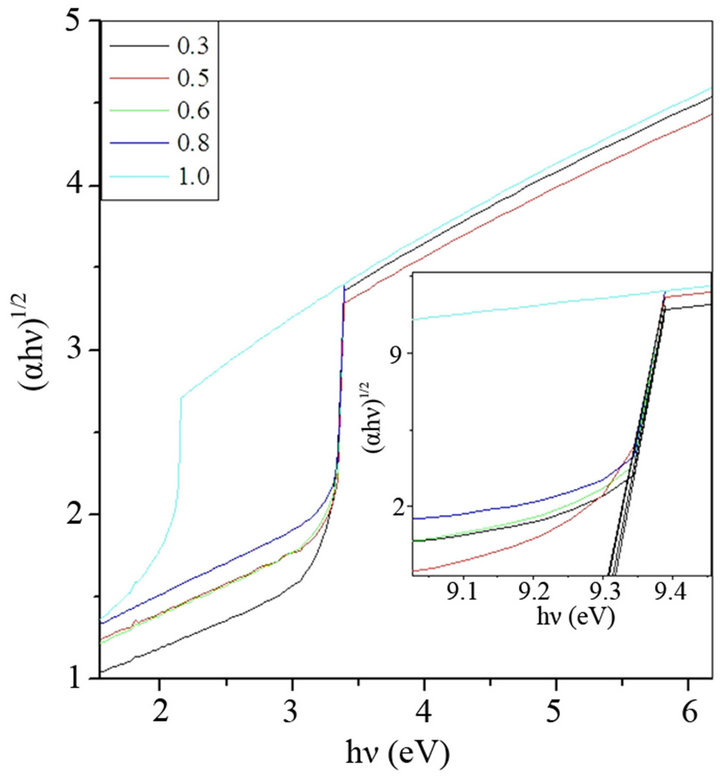
Figure 4. Davis and Mott plot of hυ versus (αhυ)1/2 of glass sample (a) BST5K1L0.3, (b) BST5K1L0.5, (c) BST5K1L0.6, (d) BST5K1L0.8 and (e) ST5K1lL1.0.
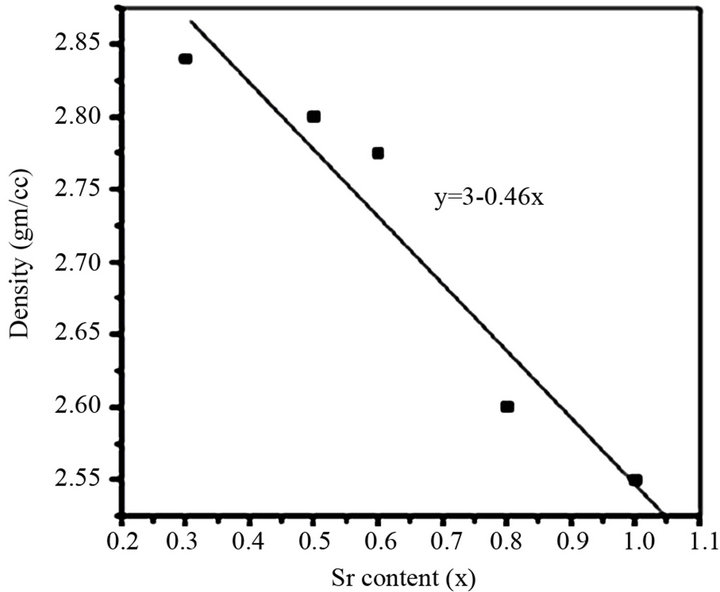
Figure 5. Variation of density vs content of Sr.
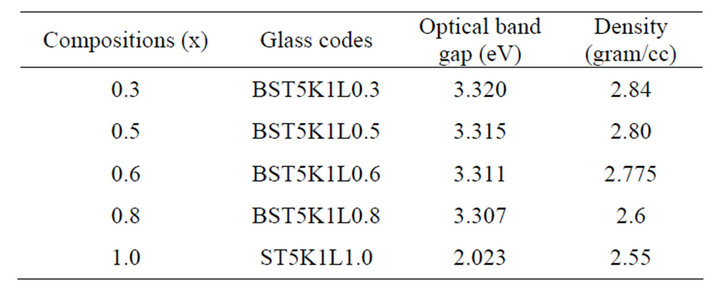
Table 4. Optical band gap and density of glass samples in the system 64[(Ba1-xSrx).TiO3]-35[2SiO2.B2O3]-5[K2O]-1[La2 O3].
5. Acknowledgements
The authors are gratefully acknowledged to the University Grant Commission (UGC), New Delhi, (India) for financial support under the major research project F. No. 37-439/2009 (SR).
REFERENCES
- M. Yamane and Y. Asahara, “Glasses for Photonics,” Cambridge University Press, Cambridge, 2000. doi:10.1017/CBO9780511541308
- A. Abou Shama and F. H. El-Batal, “Structural Analysis of Glassy Lead Borate Containing MoO3 in Relation to Its Optical Properties,” Egyptian Journal of Solids, Vol. 29, No. 1, 2006, pp. 49-67.
- S. Hsu, “Separation Sciences Research and Product Development,” Mallinckrodt Baker Division, Mallinckrodt, Inc.
- L. A. Lyon, C. D. Keating, A. P. Fox, B. E. Baker, H. Lin, S. R. Nicewarner, S. P. Mulvaney and M. J. Natan, “Raman Spectroscopy,” Analytical Chemistry, Vol. 70, No. 12, 1998, pp. 341R-361R. doi:10.1021/a1980021p
- B. Schrader, “Inferared and Raman Spectroscopy,” John Wiley and Sons, London, 1995. doi:10.1002/9783527615438
- J. R. Ferraro and J. S. Jiomek, “Introductory Group Theory and Its Applications to Molecular Structure,” Plenum Press, New York, 1969. doi:10.1007/978-1-4615-4821-8
- D. L. Rouseau, R. P. Bauman and S. P. S. Porto, “Normal Mode Determination in Crystals,” Journal of Raman Spectroscopy, Vol. 10, No. 1, 1981, pp. 253-290. doi:10.1002/jrs.1250100152
- A. M. Efimov, “Quantitative IR Spectroscopy: Applications to Studying Glass Structure and Properties,” Journal of Non-Crystalline Solids, Vol. 203, 1996, pp. 1-11. doi:10.1016/0022-3093(96)00327-4
- R. E. Youngman and J. W. Zwanziger, “On the Formation of Tetracoordinate Boron in Rubidium Borate Glasses,” Journal of the American Chemical Society, Vol. 117, No. 4, 1995, pp. 1397-1402. doi:10.1021/ja00109a026
- R. E. Youngman and J. W. Zwanziger, “Network Modification in Potassium Borate Glasses: Structural Studies with NMR and Raman Spectroscopies,” Journal of Physical Chemistry, Vol. 100, No. 41, 1996, pp. 16720- 16728. doi:10.1021/jp961439+
- C. R. Gautam, D. Kumar and O. Parkash, “IR Study of Pb-Sr Titanate Borosilicate Glasses,” Bulletin of Materials Science, Vol. 33, No. 2, 2010, pp. 145-148. doi:10.1007/s12034-010-0020-1
- C. R. Gautam, D. Kumar, P. Singh and O. Parkash, “Study of Impedance Spectroscopy of Ferroelectric (Pb,Sr)TiO3 Glass Ceramic System with Addition of La2O3,” ISRN Spectroscopy, Vol. 2012, 2012, pp. 1-11. doi:10.5402/2012/410583
- C. R. Gautam, Prabhakar Singh, D. Kumar and O. Parkash, “Synthesis, I R, Crystallization and Dielectric Study of (Pb,Sr)TiO3 Borosilicate Glass Ceramics,” Bulletin of Material Science, 2013 (in Press). doi:10.1007/s12034-013-0489-5
- C. R. Gautam, A. K. Yadav, V. K. Mishra and K. Vikram, “Synthesis, IR and Raman Spectroscopic Studies of (Ba, Sr)TiO3 Borosilicate Glasses With Addition of La2O3,” Open Journal of Inorganic Non-metallic Materials, Vol. 2, 2012, pp. 47-54.
- C. R. Gautam, A. K. Yadav and P. Singh, “Synthesis, Crystallization and Microstructural Study of Perovskite (Ba,Sr)TiO3 Borosilicate Glass Ceramic Doped With La2O3,” Materials Research Innovations, Vol. 17, No. 3, 2013, pp. 148-153. doi:10.1179/1433075X12Y.0000000045
- E. A. Davis and N. F. Mott, “Conduction in Non-Crystalline Systems V,” Philosophical Magazine, Vol. 22, No. 179, 1970, pp. 903-922. doi:10.1080/14786437008221061
- B. Eraiah, “Optical Properties of Samarium Doped ZincTellurite Glasses,” Bulletin of Material Science, Vol. 29, No. 4, 2006, pp. 375-378. doi:10.1007/BF02704138
- A. Venktaraman, V. A. Hiremath, S. K. Date and S. D. Kulkarni, “A New Combustion Route to γ-Fe2O3 Synthesis,” Bulletin of Material Science, Vol. 24, No. 6, 2001, pp. 617-621. doi:10.1007/BF02704010
- P. G. Bray, “Interaction of Radiation with Solids,” Plenum, New York, 1967.
- R. V. Adams and R. W. Douglas, “Infrared Studies on Various Samples of Fused Silica with Special Reference to the Bands Due to Water,” Journal of the Society of Glass Technology, Vol. 43, 1959, pp. 147-158.
- H. Dunken and R. H. Doremus, “Short Time Reactions of a Na2O-CaO-SiO2 Glass With Water and Salt Solutions,” Journal of Non-Crystalline Solids, Vol. 92, No. 1, 1987, pp. 61-72. doi:10.1016/S0022-3093(87)80359-9
- R. D. Husung and R. H. Doremus, “Infrared Transmission Spectra of Four Silicate Glasses before and after Exposure to Water,” Journal of Materials Research, Vol. 5, No. 10, 1990, pp. 2209-2217. doi:10.1557/JMR.1990.2209
- G. Ramadevudu, S. R. L. Srinivasa, M. S. A. Hameed and M. C. Narasimha, “FTIR and Some Physical Properties of Alkaline Earth Borate Glasses Containing Heavy Metal Oxides,” International Journal of Engineering Science and Technology, Vol. 3, No. 9, 2011, pp. 6998-7005.
- N. A. Ghoneim, H. A. El Batal, N. Abdel Shafi and M. H. Azooz, “Synthesis and Characterization of Cadmium Doped Lead-Borate Glasses,” Proceeding of the Egyptian Conference of Chemistry, Cairo, 1996, p. 162.
- F. M. Ezz Eldin, N. A. E. L. Alaily, F. A. Khalifa and H. A. E. L. Batal, “In Fundamental of Glass Science and Technology,” 3rd E.S.G. Conference Germany: Verlag Der Deutschen Lastechnischen Gesellschaft, 1995.
- A. S. Tenny and J. J. Wong, “Vibrational Spectra of Vapor Deposited Binary Borosilicate Glasses,” Chemical Physics, Vol. 56, No. 11, 1972, pp. 5516-5523.
- H. Doweidar, M. A. A. Zeid and G. M. El-Damrawy, “Effect of Gamma Radiation and Thermal Treatment on Some Physical Properties of ZnO-PbO-B2O3 Glasses,” Journal of Physics D, Vol. 24, No. 12, 1991, pp. 2222- 2228. doi:10.1088/0022-3727/24/12/015
- M. Pal and B. Roy, “Structural Characterization of Borate Glasses Containing Zinc and Manganese Oxides,” Journal of Modern Physics, Vol. 2, No. 9, 2011, pp. 1062- 1066. doi:10.4236/jmp.2011.29129
- K. El-Egili, “Infrared Studies of Na2O-B2O3-SiO2 and Al2O3-Na2O-B2O3-SiO2 Glasses,” Physica B, Vol. 325, 2003, pp. 340-348. doi:10.1016/S0921-4526(02)01547-8
- C. N. Santos, D. D. Meneses, P. Echegut, D. R. Neuville, A. C. Hernandes and A. Ibanez, “Structural, Dielectric, and Optical Properties of Yttrium Calcium Borate Glasses,” Applied Physics Letters, Vol. 94, 2009, pp. 151901- 151903. doi:10.1063/1.3115796
- H. Li, Y. Su, L. Li and D. M. Strachan, “Raman Spectroscopic Study of Gadolinium (III) in Sodium-Aluminoborosilicate Glasses,” Journal of Non-Crystalline Solids, Vol. 292, No. 1-3, 2001, pp. 167-176.
- R. K. Brow, D. R. Tallant and G. L. Turner, “Polyhedral Arrangements in Lanthanum Aluminoborate Glasses,” Journal of the American Ceramic Society, Vol. 80, No. 5, 1997, pp. 1239-1244. doi:10.1111/j.1151-2916.1997.tb02970.x
- W. Kern and R. C. Heim, “Chemical Vapor Deposition of Silicate Glasses for Use with Silicon Devices: II. Film Properties,” Journal of The Electrochemical Society, Vol. 117, No. 4, 1970, pp. 568-573. doi:10.1149/1.2407573
- B. N. Meera and J. Ramakrishna, “Raman Spectral Studies of Borate Glasses,” Journal of Non-Crystalline Solids, Vol. 159, No. 1, 1993, pp. 1-21. doi:10.1016/0022-3093(93)91277-A
- K. Suzuki and K. Kijima, “Optical Band Gap of Barium Titanate Nanoparticles Prepared by RF-Plasma Chemical Vapor Deposition,” Japanese Journal of Applied Physics, Vol. 44, 2005, pp. 2081-2082. doi:10.1143/JJAP.44.2081
- H. B. George, C. Vira, C. Stehle, et al., “A Structural Analysis of the Physical Properties of Bismuth and Lead Based Glasses,” Physics and Chemistry of Glasses, Vol. 40, No. 6, 1999, pp. 326-332.
- G. Sharma, K. S. Thind, M. Arora, H. Singh, Manupriya and L. Gerward, “Optical Properties of Heavy Metal Oxide Glasses before and after g-Irradiation,” Physica Status Solidi A, Vol. 204, 2007, pp. 591-601. doi:10.1002/pssa.200622124
- D. Singh, K. Singh, G. Singh, M. Priya, S. Mohan, M. Arora and G. Sharma, “Optical and Structural Properties of ZnO-PbO-B2O3 and ZnO-PbO-B2O3-SiO2 Glasses,” Journal of Physics: Condensed Matter, Vol. 20, No. 7, 2008, pp. 75228-75233.
NOTES
*Corresponding author.