Optics and Photonics Journal
Vol.2 No.2(2012), Article ID:20397,8 pages DOI:10.4236/opj.2012.22010
Comparison between Analytical Solution and Experimental Setup of a Short Long Ytterbium Doped Fiber Laser
1Photonics Research Center, University of Malaya, Kuala Lumpur, Malaysia
2Department of Electrical Engineering, University of Malaya, Kuala Lumpur, Malaysia
Email: *mramoghaddam@siswa.um.edu.my
Received April 10, 2012; revised May 6, 2012; accepted May 16, 2012
Keywords: Ytterbium Doped Fiber; ASE; Rate Equation; Runge-Kutta
ABSTRACT
In this research, Amplified Spontaneous Emission (ASE) spectrum characteristics for a highly Yb3+ doped glass fiber with different pump powers and pump wavelengths are scrutinized. ASE spectral profile and wavelength shift corresponding to different optical fiber lengths are measured. Highly-doped Yb3+ fiber lasers in a linear-cavity are both experimentally and analytically investigated. Rate equations are solved using quasi-numerical models. Numerical results are reported for wide range of operating conditions to enable design optimization. The model takes into account the scattering loss and the distributed laser loss power density in strongly pump condition. The effects of various parameters such as pump power, pump wavelength, signal wavelength and fiber length on the output power and laser threshold are studied. Theoretical results are shown to be in good agreement with the experimental data.
1. Introduction
Fiber lasers have many advantages such as high conversion efficiency, immunity from thermal lensing effect, simplicity of optical construction and excellent beam quality. Ytterbium doping is attractive for high-power fiber lasers because of its high efficiency and strong pump absorption. Ytterbium-doped silica fibers exhibit very broad absorption and emission bands, from 800 nm to 1064 nm for absorption and 970 nm to 1200 nm for emission [1,2]. The simplicity of the level structure provides freedom from unwanted processes such as excited state absorption, multi-phonon nonradiative decay, and concentration quenching [3,4].
Much work on Ytterbium Doped Fiber lasers (YDFLs) focuses on increasing the efficiency of the Laser and some authors have studied Fiber lasers theoretically. In our earlier work a laser action was demonstrated with near 90% slope efficiency using a fabricated YDF as a gain medium [5].
In recent years, the output powers from doped fiber lasers and amplifiers have been scaled and one approach for further power scaling these light sources is to increase the concentration to reduce the required fiber length and avoid nonlinear effects.
However, pumping doped silica fiber with high concentrations can result in excess loss at the pump and signal wavelengths owing to photodarkening, which can significantly reduce the overall conversion efficiency and degrade the long-term performance [6].
In this article, we theoretically and experimentally analyze a YDF which is useful for low noise systems and very short application lengths. Rate equations are solved using semi-numerical models [7,8]. This model takes into account the scattering loss and the distributed laser loss power density in strongly pump condition [9]. The effects of various parameters such as pump power, pump wavelength, signal wavelength and fiber length on the output power and laser threshold are studied.
2. Experimental Setup
The experimental setup used for the lasing experiments is illustrated in Figure 1. In the work, different lengths (L) of YDF are pumped through a WDM by pigtailed diode lasers.
The YDF used is a heavily-doped Ytterbium silica fiber with a core absorption coefficient ( ) of 1200 dB/m at 976 nm .This fiber has a core/cladding diameter of 4/125 µm, a numerical aperture of 0.2 and a cut-off wavelength of 1010 nm. The photodarkening effect in

Figure 1. Experimental setup of laser cavity.
this fiber has been reduced by technique of direct nanoparticle deposition [10].
The output characteristics of the laser are measured using a power meter and an optical spectrum analyzer (OSA).
The reflectivity of output coupler is varied from 4% to 95%. For a lossless fiber laser, the output power is almost constant over reflectivity range since the higher reflectivity increases the power inside the cavity and simultaneously decreases a relative output power. For a lossy system, for example in a resonator with an imperfect back reflector or in an unmatched system with different numerical apertures, the higher output reflectivity increases a propagation length of the signal due to more round trips and it results in a higher loss. Therefore, the output power increases with the transmission of the output coupler.
In this work, the resonator cavity is formed between a Fiber Bragg Grating (FBG) and a perpendicularly cleaved YDF end. The experiments are carried out for two different FBGs having a peak reflectivity of about 95% with the peak wavelengths of 1064.94 nm, and 1028.02 nm. We compared the laser output characteristics for these two signal wavelengths. The forward and backward amplified spontaneous emission (ASE) spectrum at different pump wavelengths and power levels are also compared.
2.1. Comparison of ASE Spectrum
The ASE spectra of a forward 975 nm pumping scheme for five different lengths between 10 to 400 cm are shown in Figure 2. This figure shows that for a given pump power (200 mW), the wavelength corresponding to peak of ASE varies from 1055.42 to 1074 nm by increasing the YDF length from 10 to 400 cm. In other words there is an overall shifting of the ASE spectrum toward the higher wavelength side with increasing the length of the fiber. Meanwhile, the FWHM of the observed spectra decreases from 48 nm to 33 nm as the YDF length is increased from 10 to 400 cm as shown in Figure 3.
In fact, for longer fibers the ASE would be reabsorbed in the fiber as it propagates beyond the point where the pump is attenuated. Since the absorption cross-section is higher on the lower wavelength side, the re-absorption is more prominent in this region.
From residual transmitted pump intensity, it is found that the pump power is completely absorbed even in a short piece of this fiber. Inset figure verifies that the shape of the ASE spectra don’t show any considerable change with the pump power.
For a given fiber length, the experimental results show that the ASE (fluorescence) bandwidth can be further increased as the pumping wavelength decreases. From the result obtained for 100 mW, 975 nm forward pumping, an ASE bandwidth of 32 nm is obtained for 4 m long YDF. While under the same condition, the ASE bandwidth is measured to be 55 nm at a shorter pumping wavelength (967 nm). However the ASE bandwidth decreases from 55 nm to 28 nm as the pump power is increased from 100 to 600 mW.
A comparison of the ASE peak position for two different pumping wavelengths in a forward pumping scheme having a piece of 4 m long YDF is shown in Figure 4. From the figure, we can deduce that moving toward longer pump wavelength results in shifting ASE peak toward longer wavelength.
As shown in Figure 5, the backward ASE does not suffer the ASE re-absorption. Therefore it shows a wider bandwidth in the figure inset.
2.2. Laser Setup
In a lossless fiber laser, the output power does not change with the fiber length. However, in reality, an increase in the fiber length makes a larger absorption and a larger signal loss. Figure 6 shows the 1064 nm laser output power versus 975 nm launched pump power. The output power is compared in this figure for different fiber lengths between 0.3 to 2 m.
Using a numerical aperture (NA) of 0.2 for YDF used and a NA of 0.14 for FBG in the setup, the maximum output power is measured to be 110 mW for 2 m of YDF at maximum pump power. As also shown in the figure lasing starts at a different threshold power depending on the YDF length.
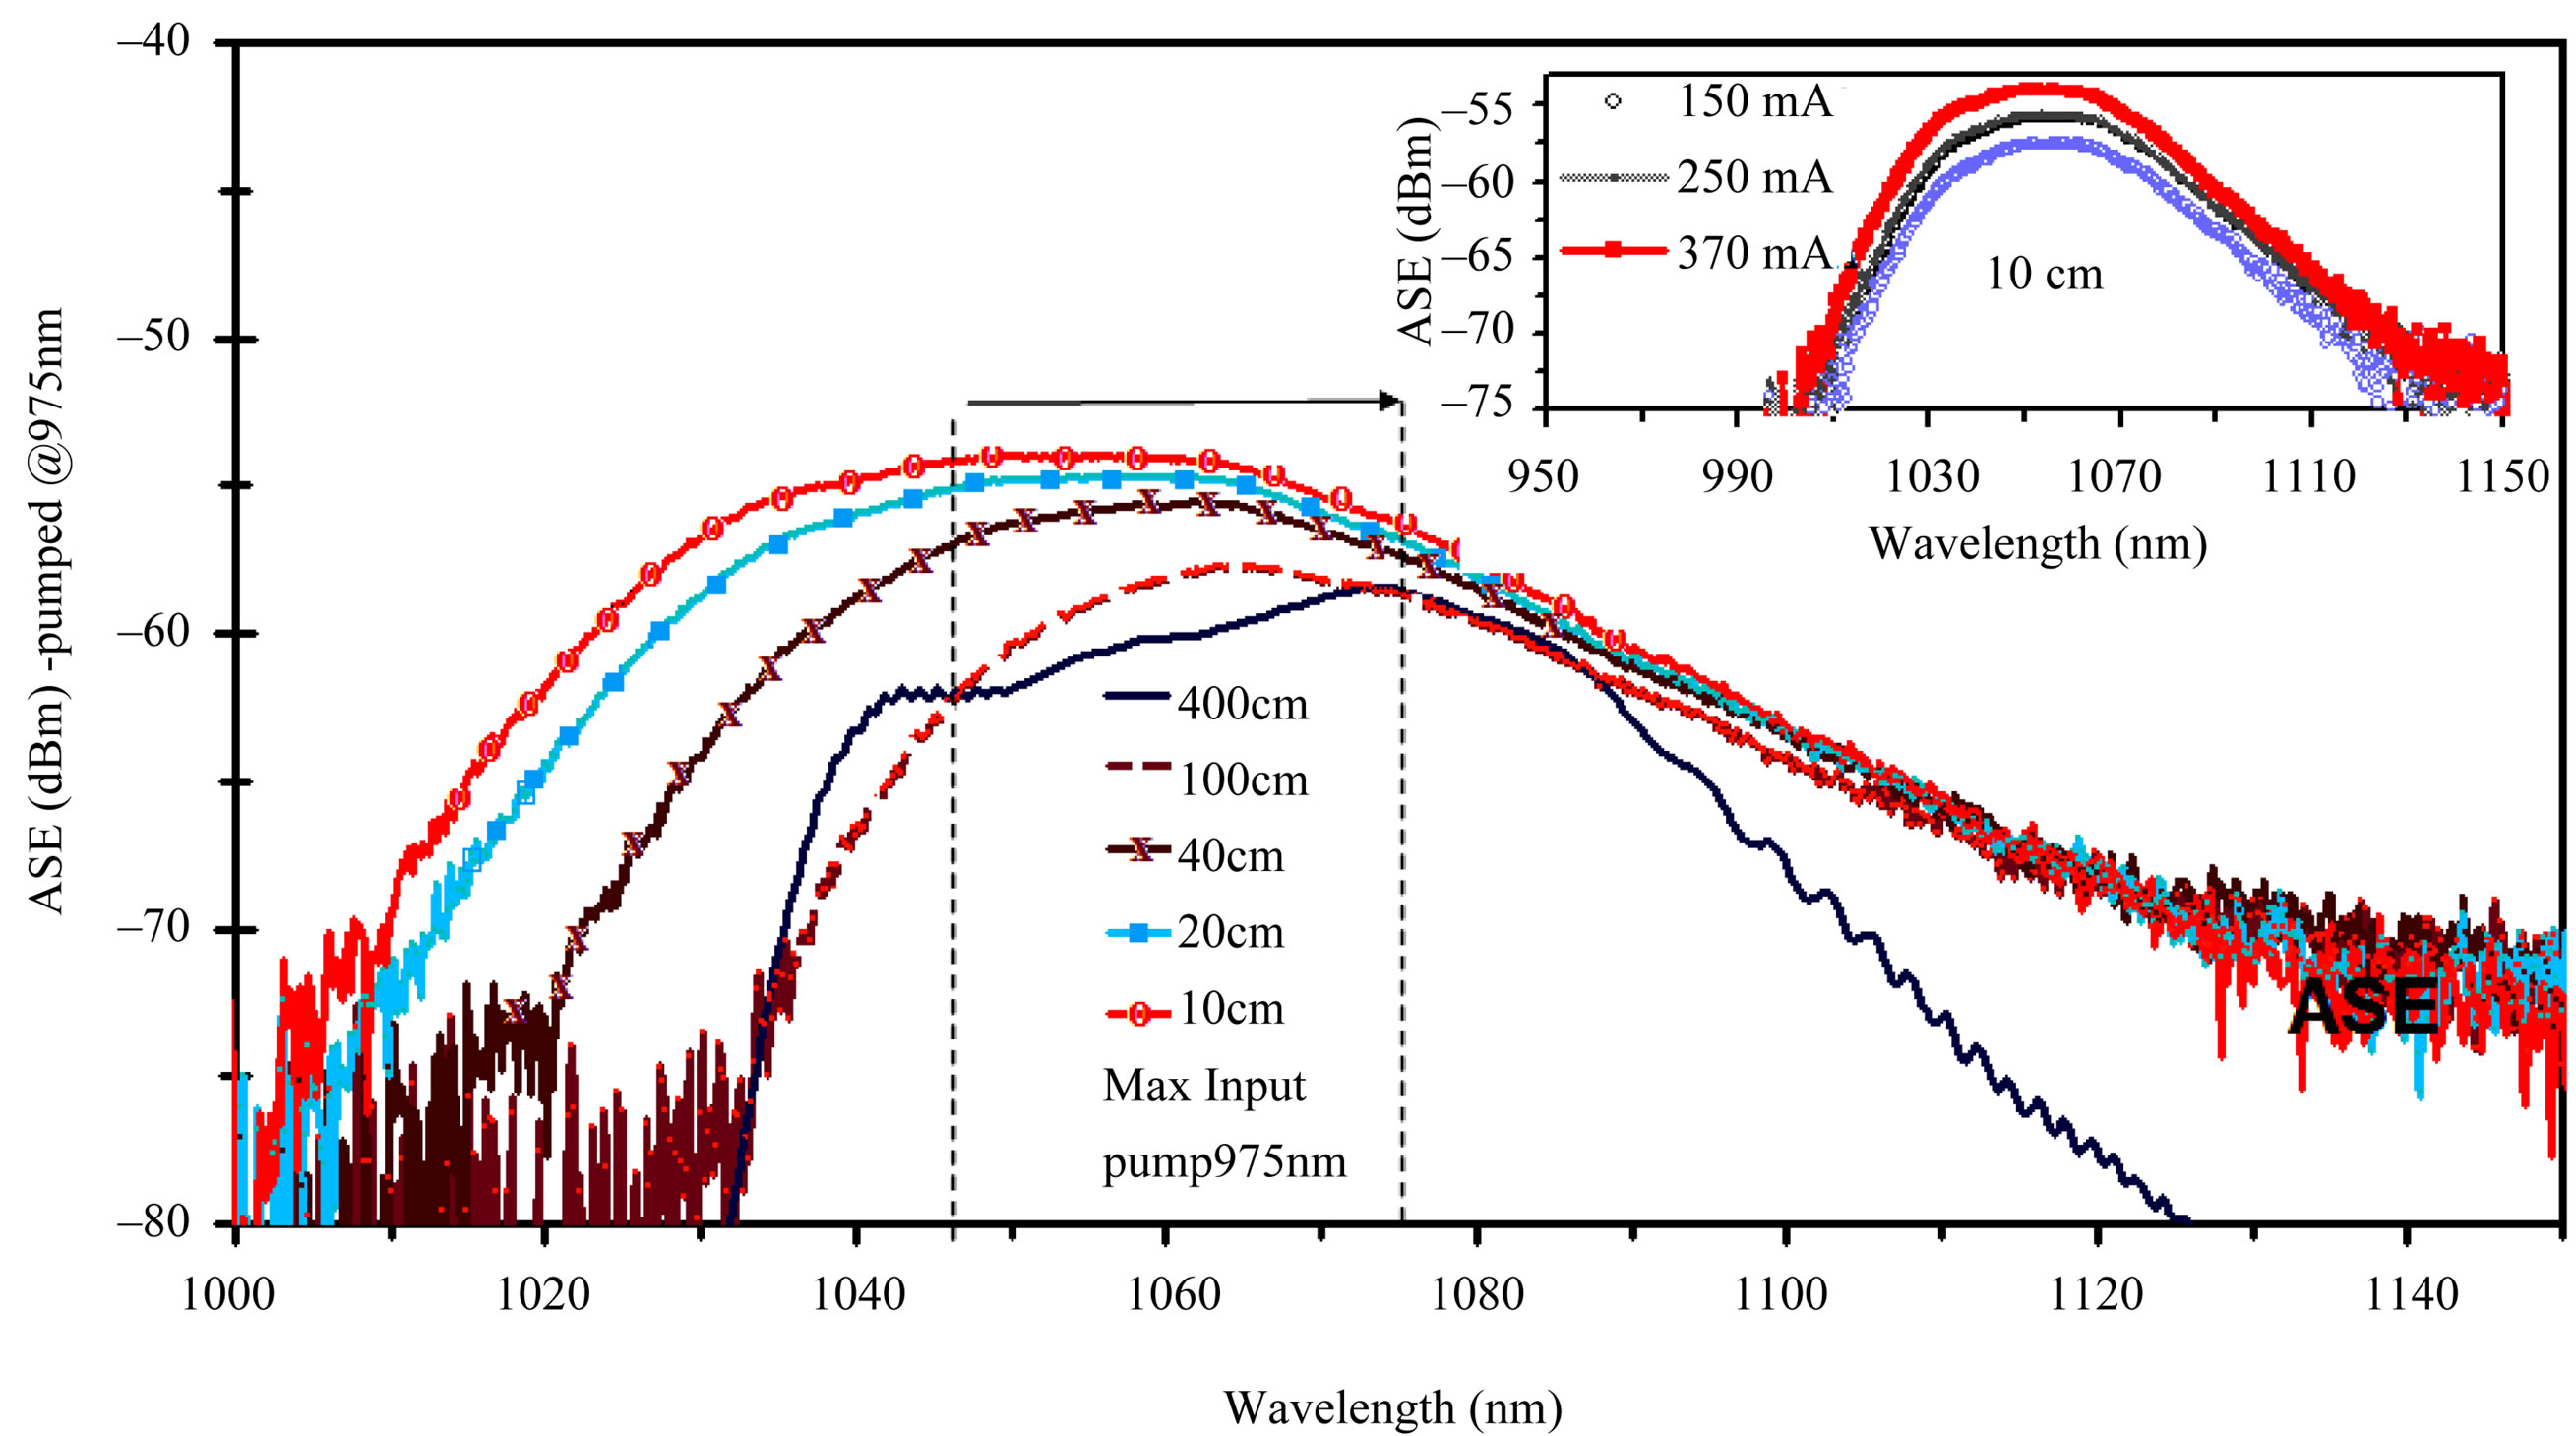
Figure 2. ASE spectrum shift for different fiber lengths and input powers.
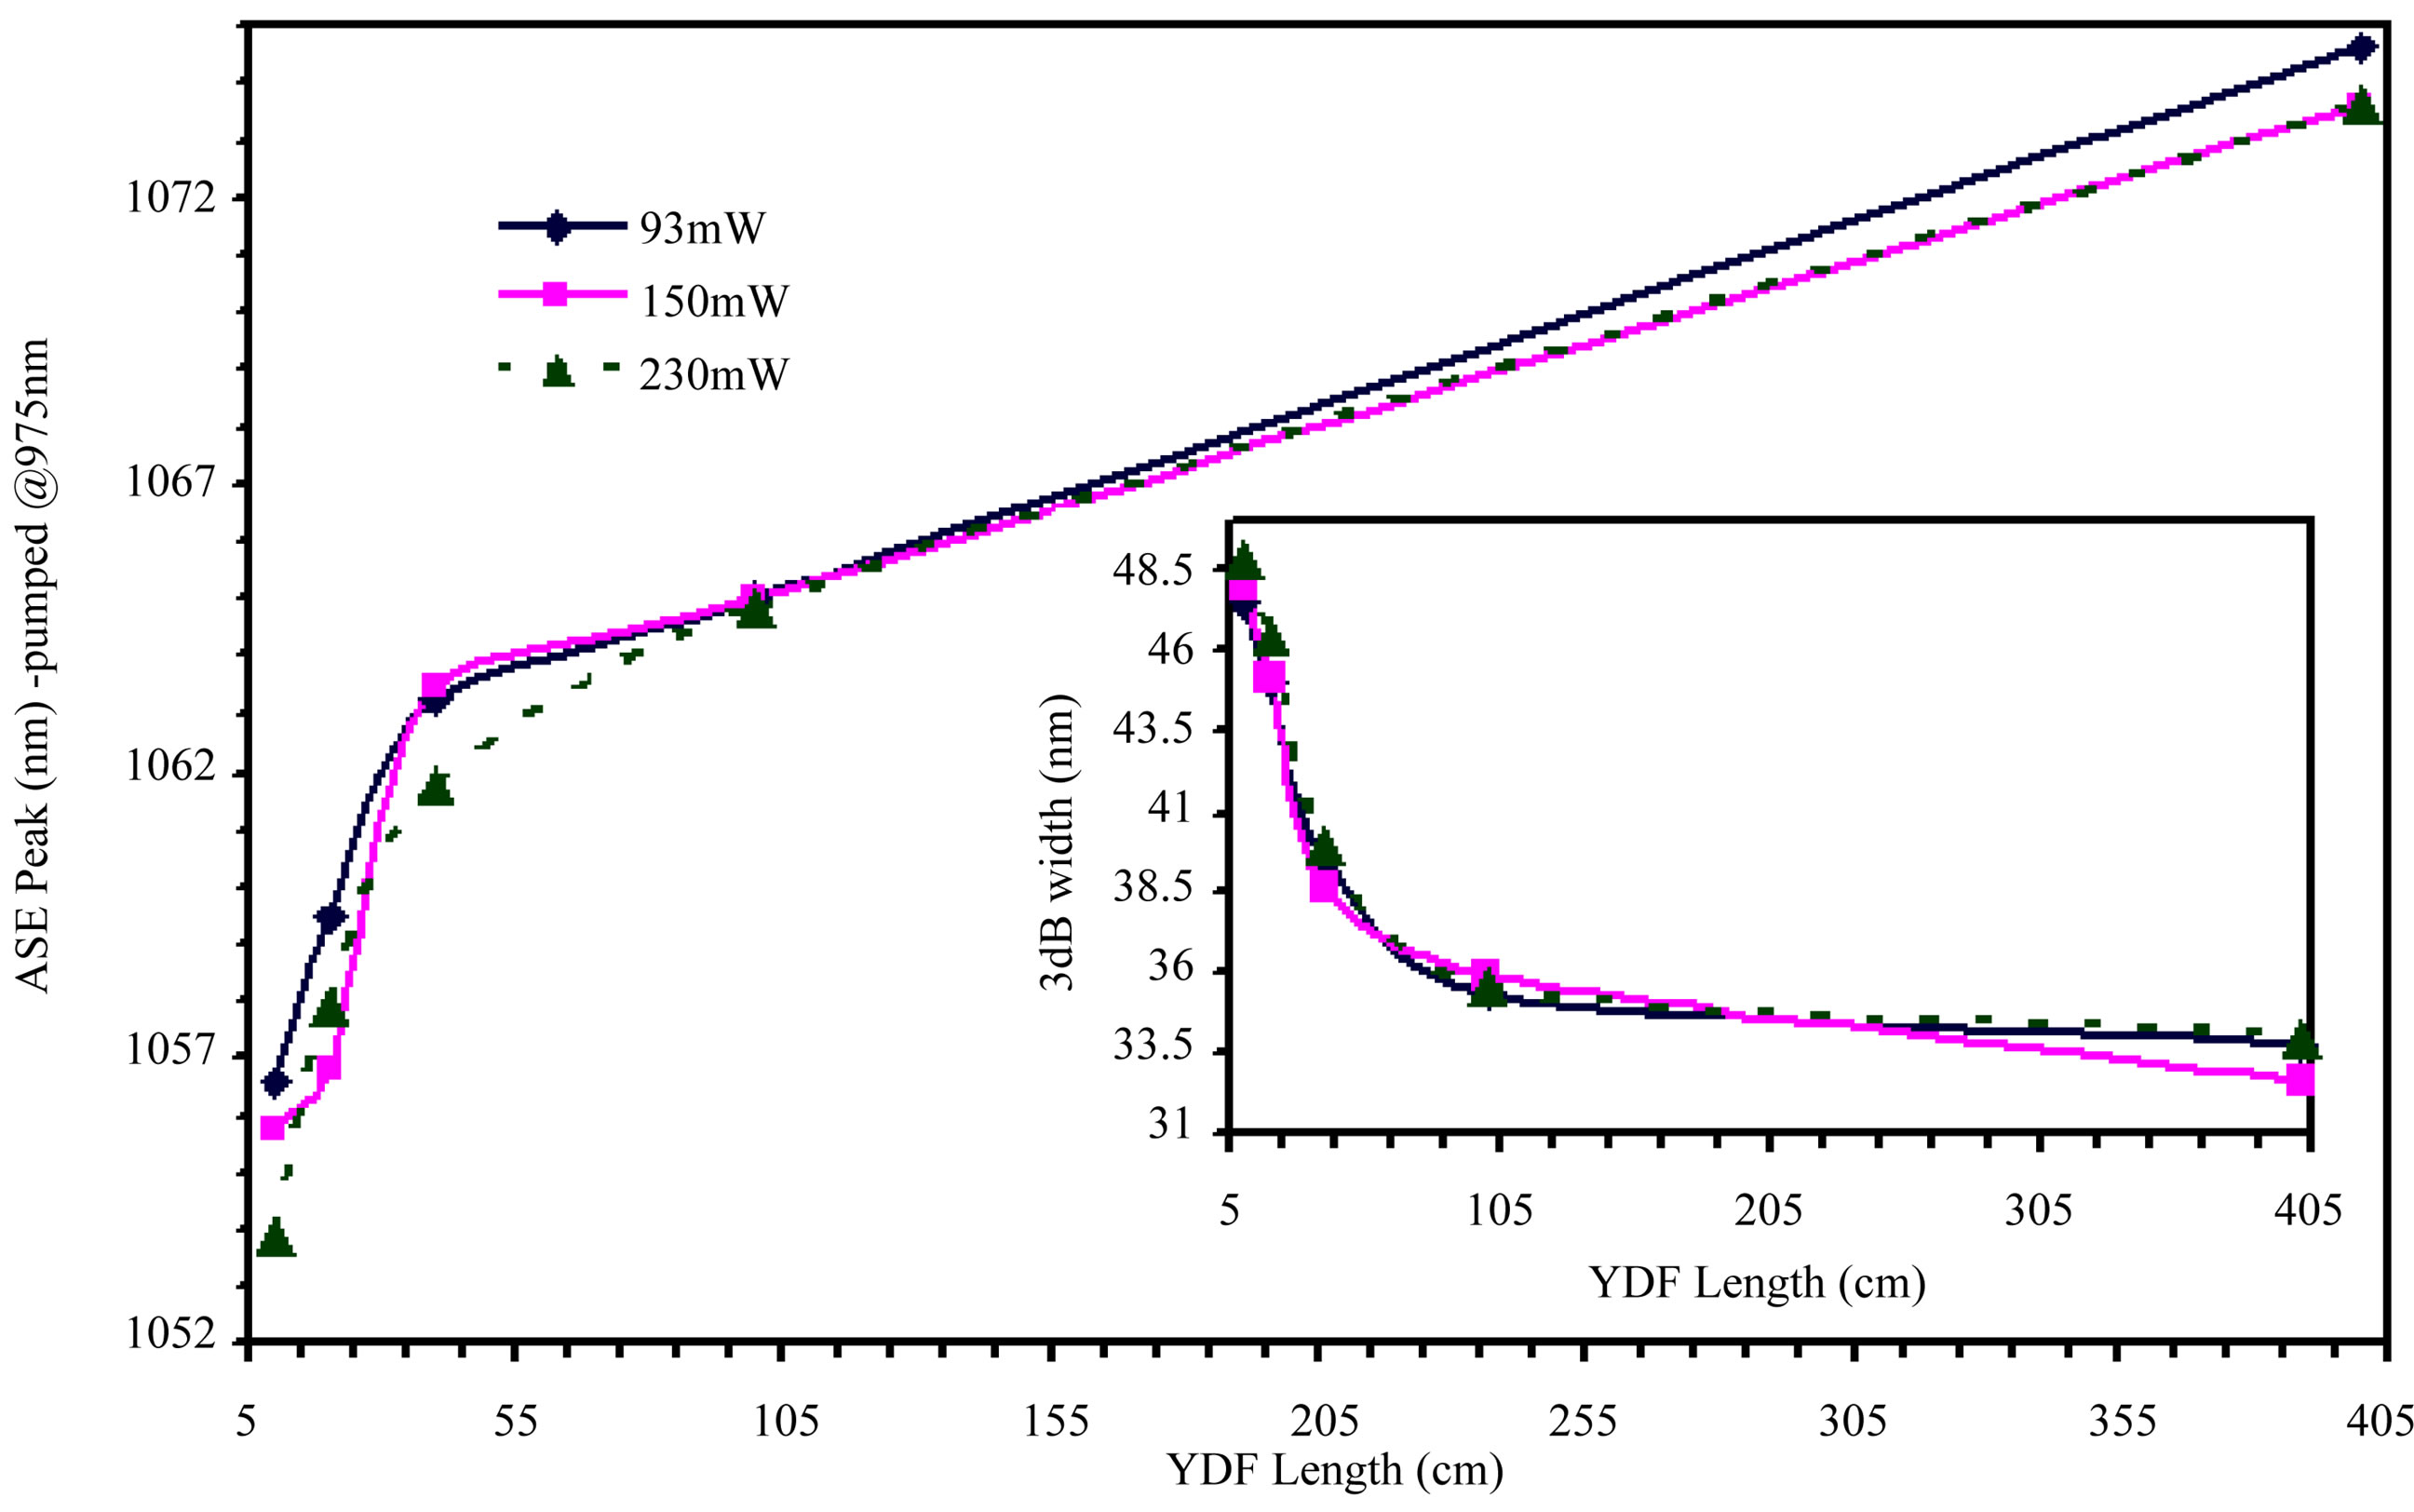
Figure 3. The variation ASE peak and bandwidth under 975 nm forward pumping for different fiber lengths.
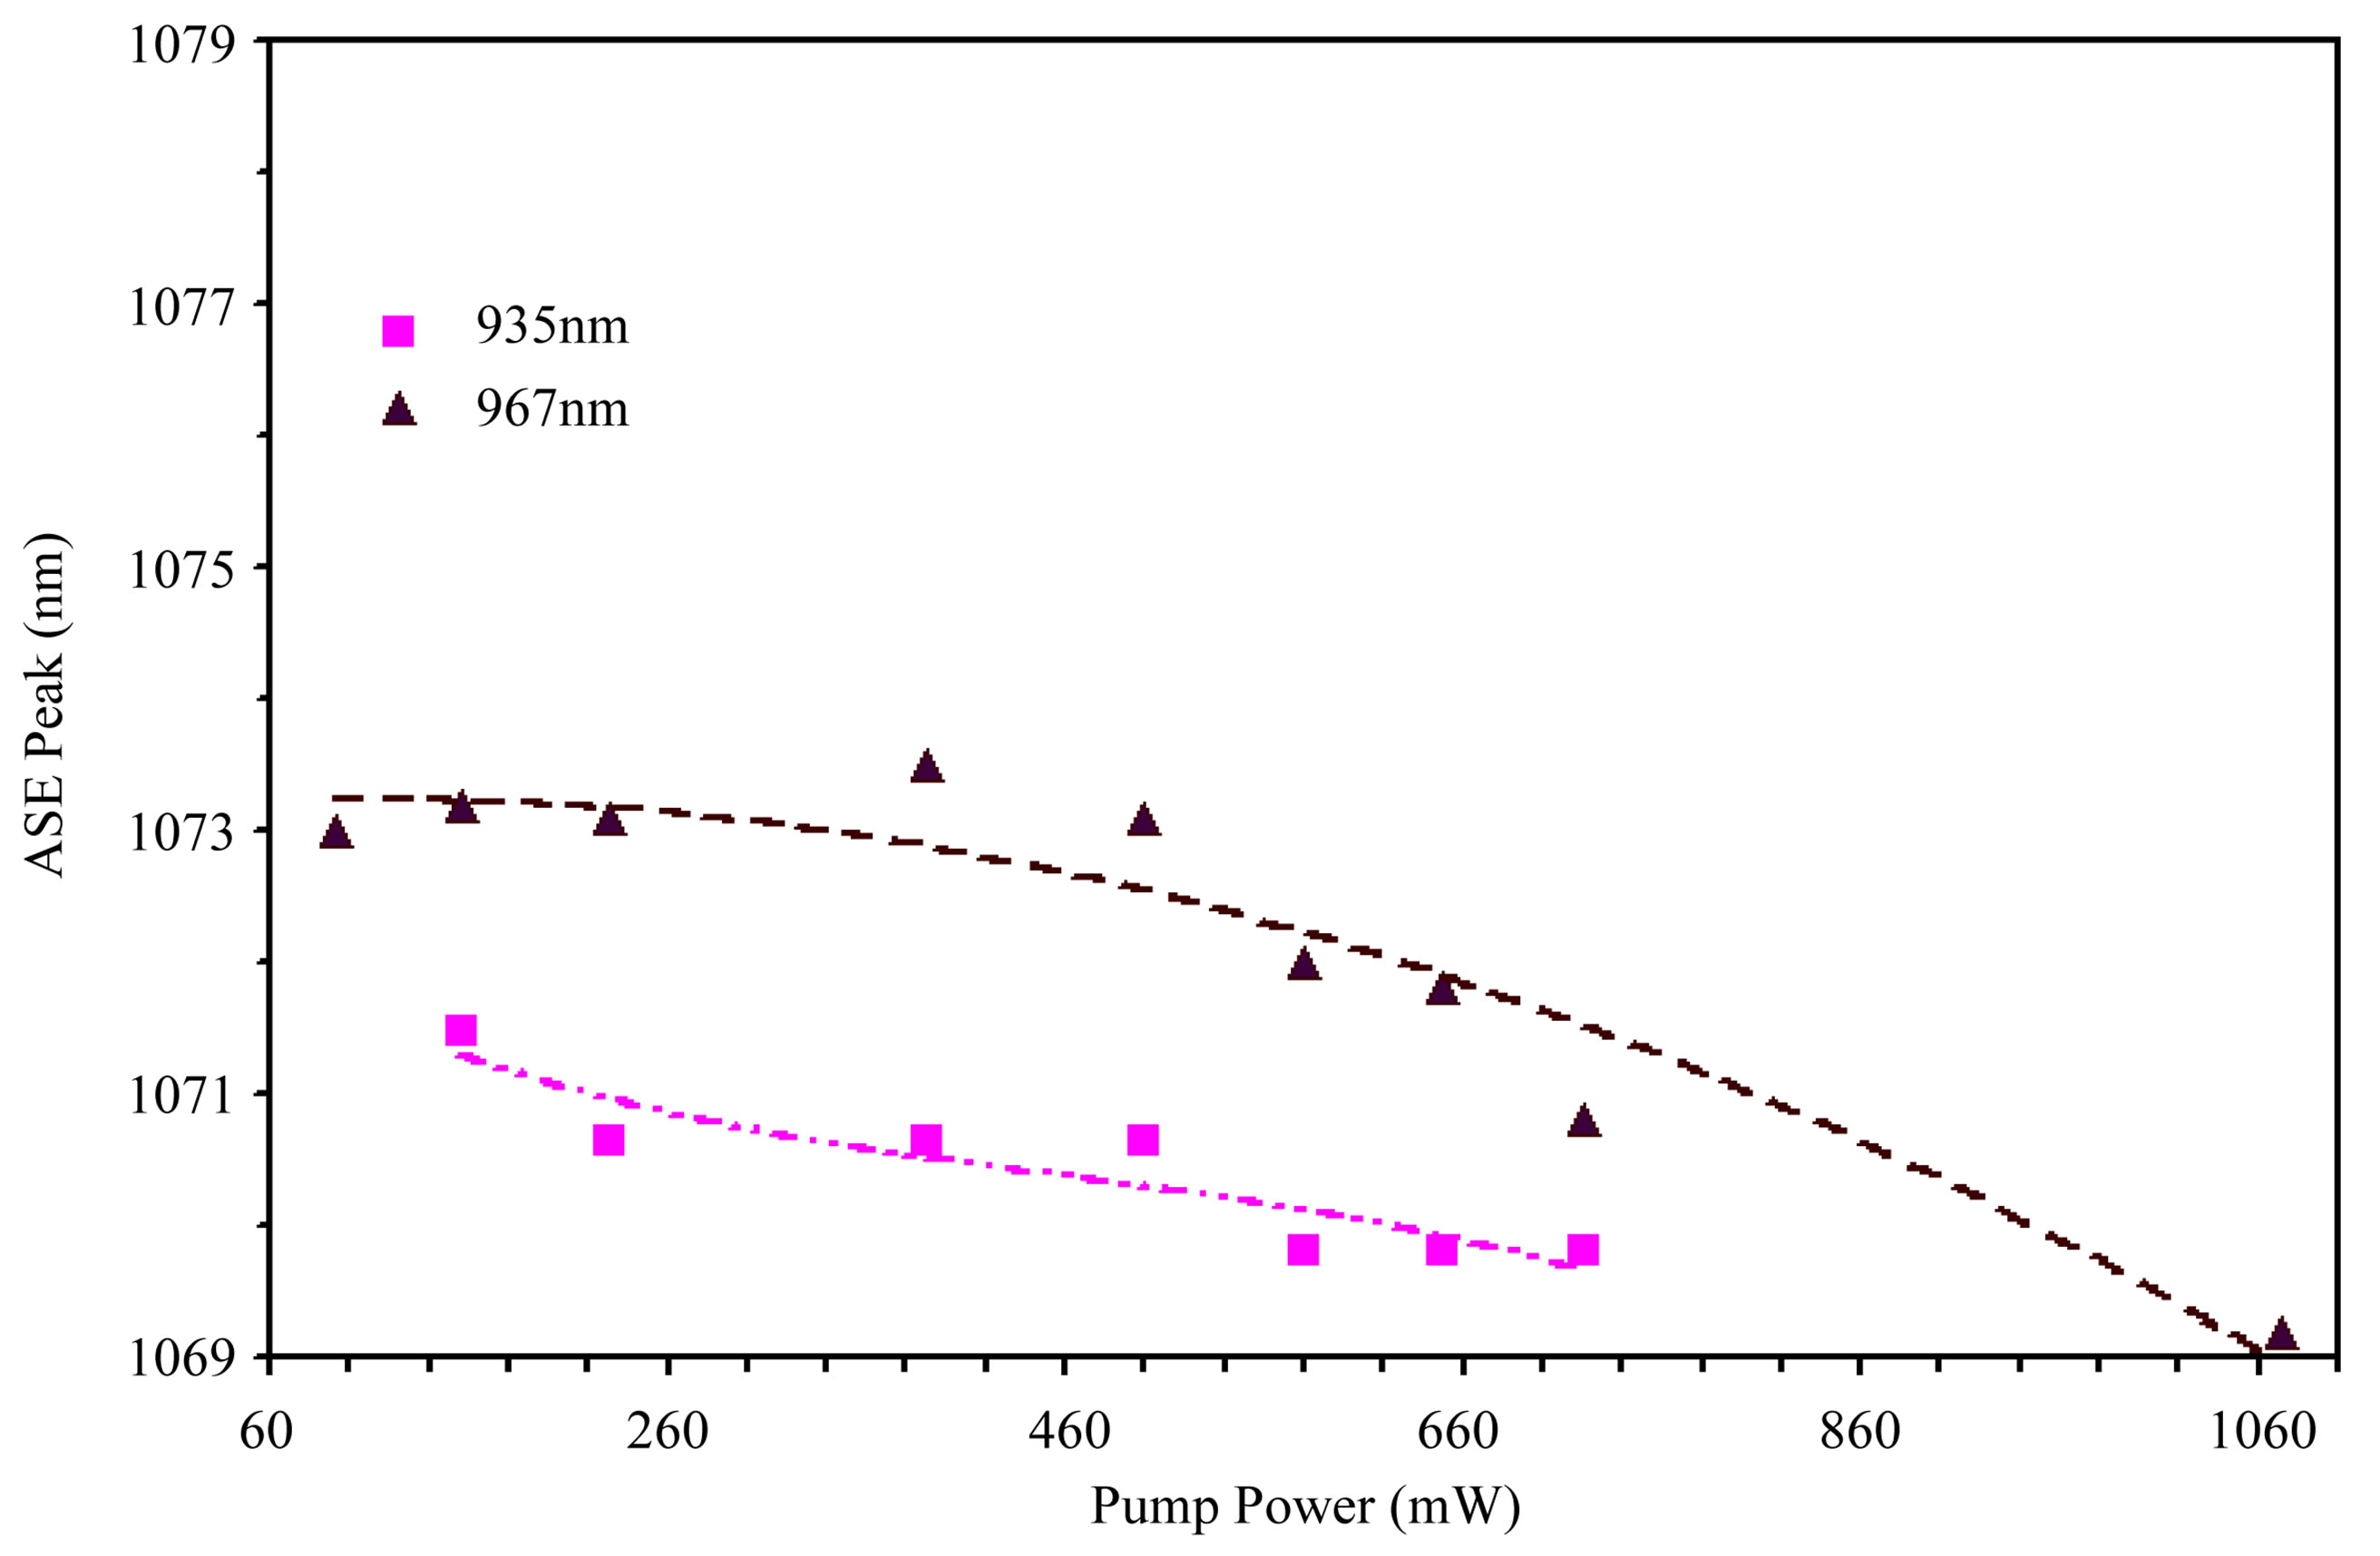
Figure 4. The variation of ASE peak position with pumping wavelength.
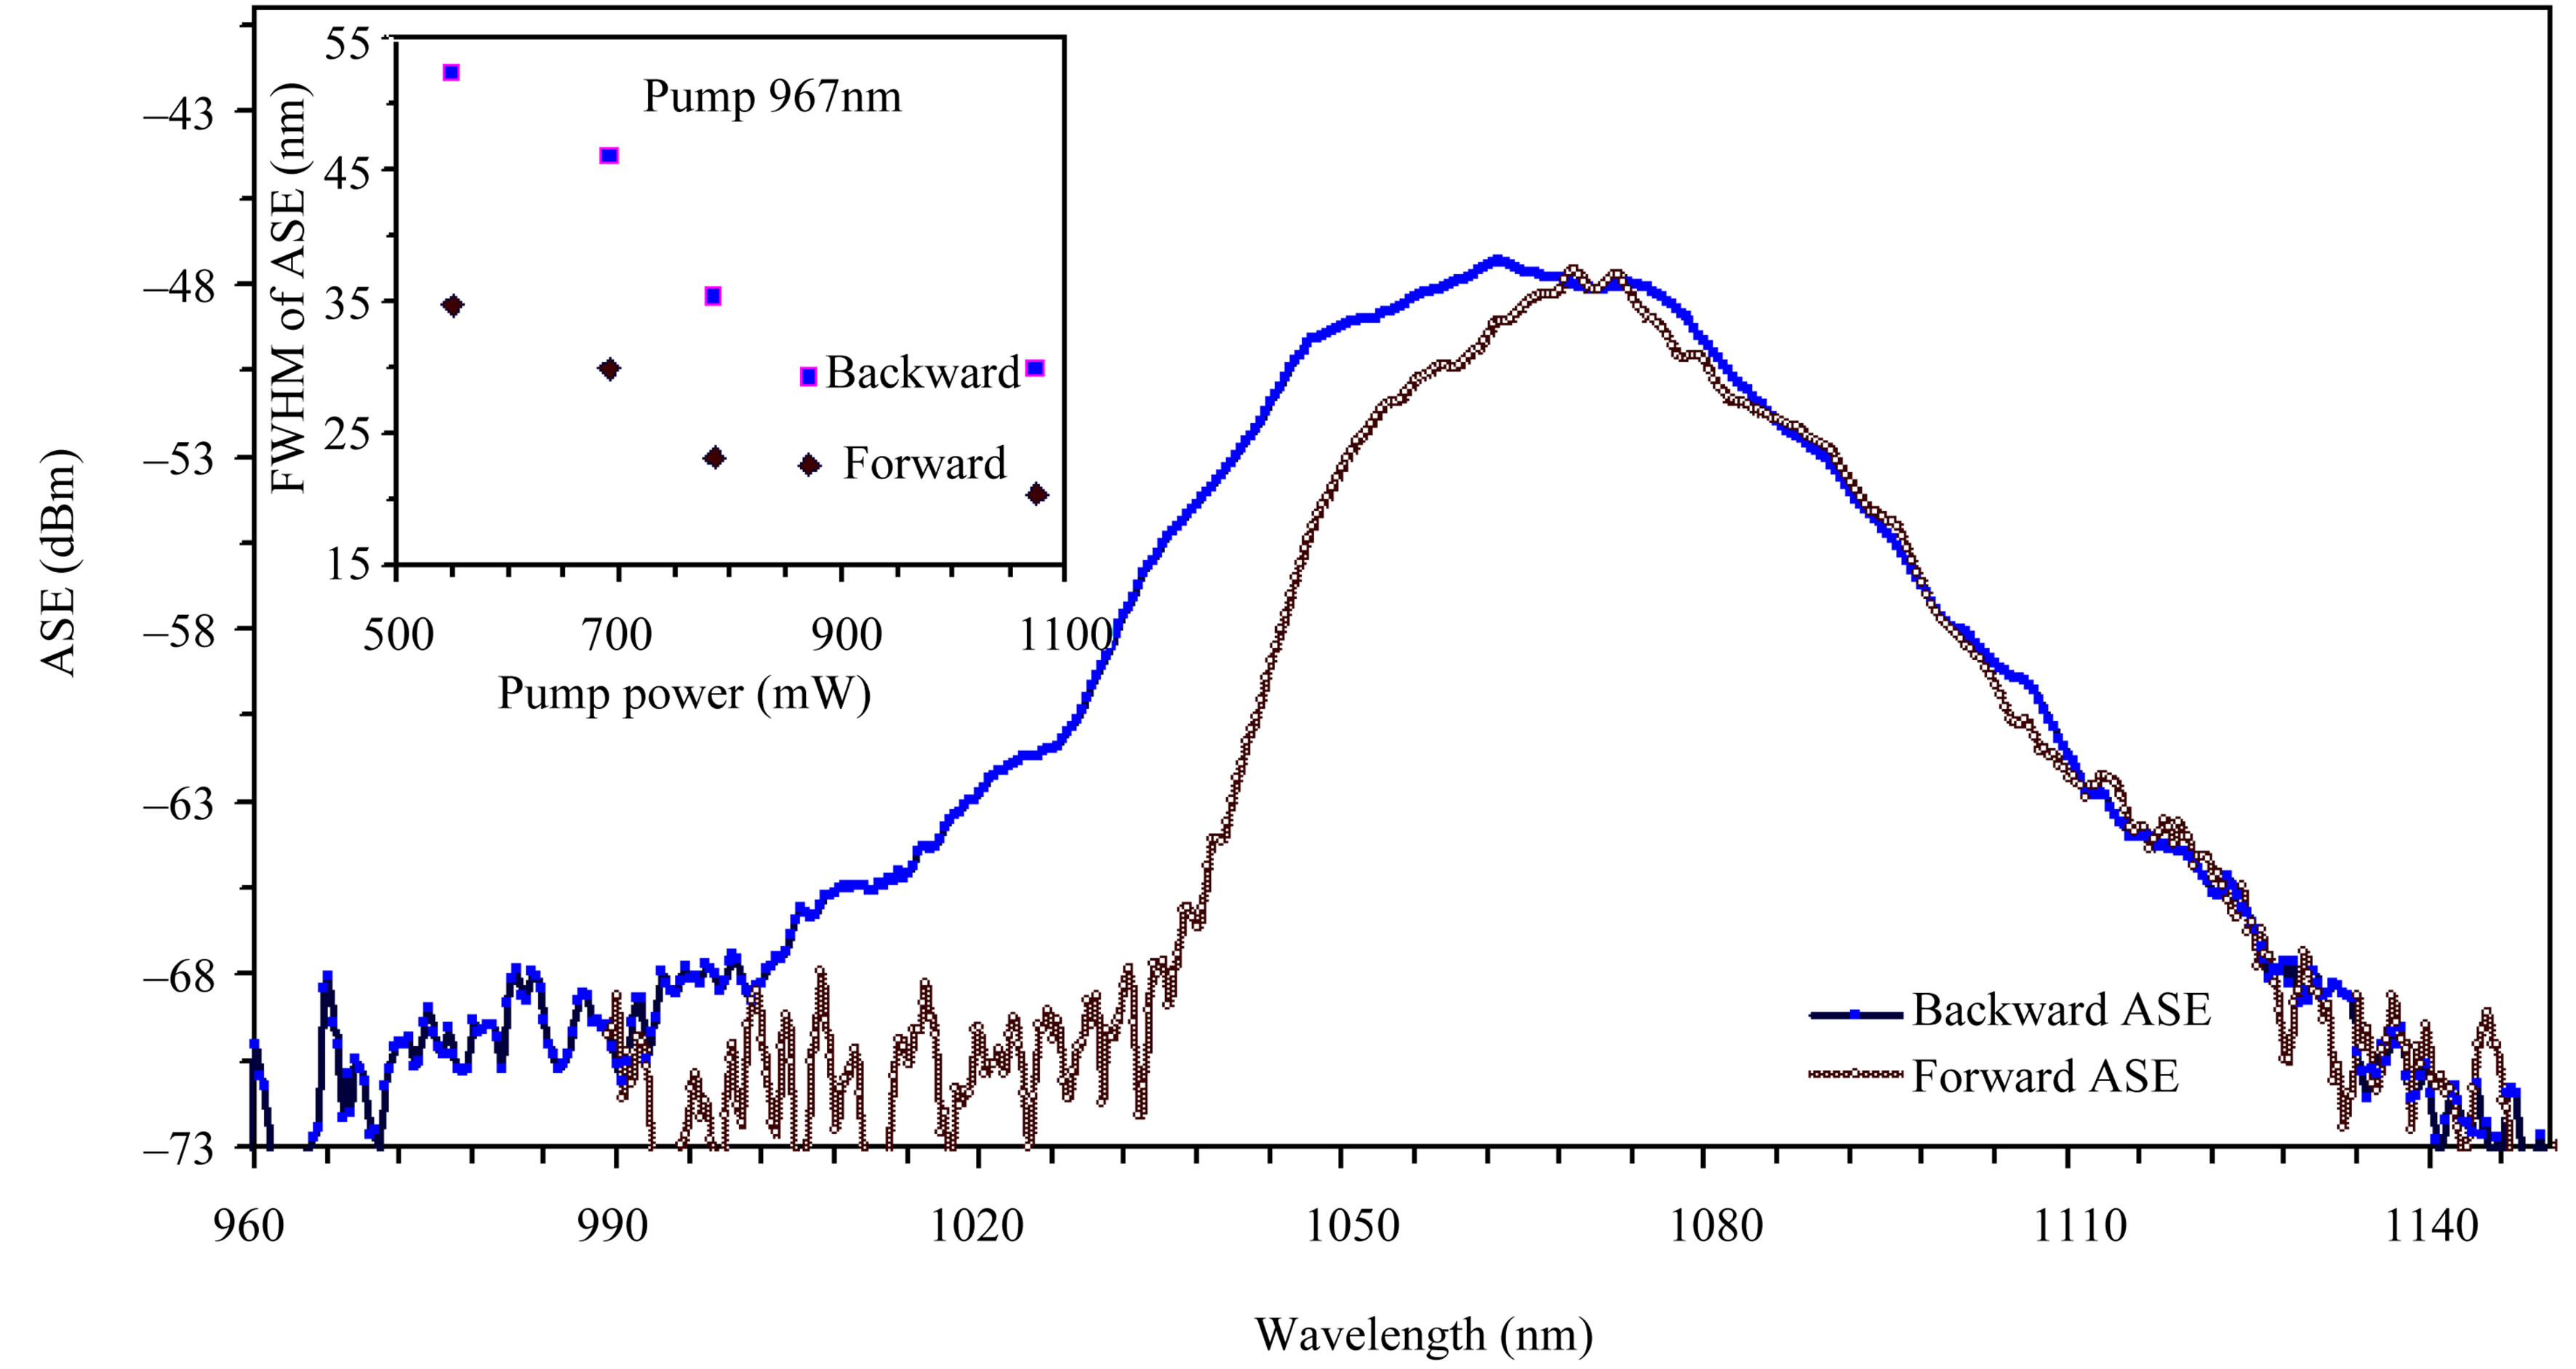
Figure 5. Comparison of ASE in forward and backward pumping schemes.
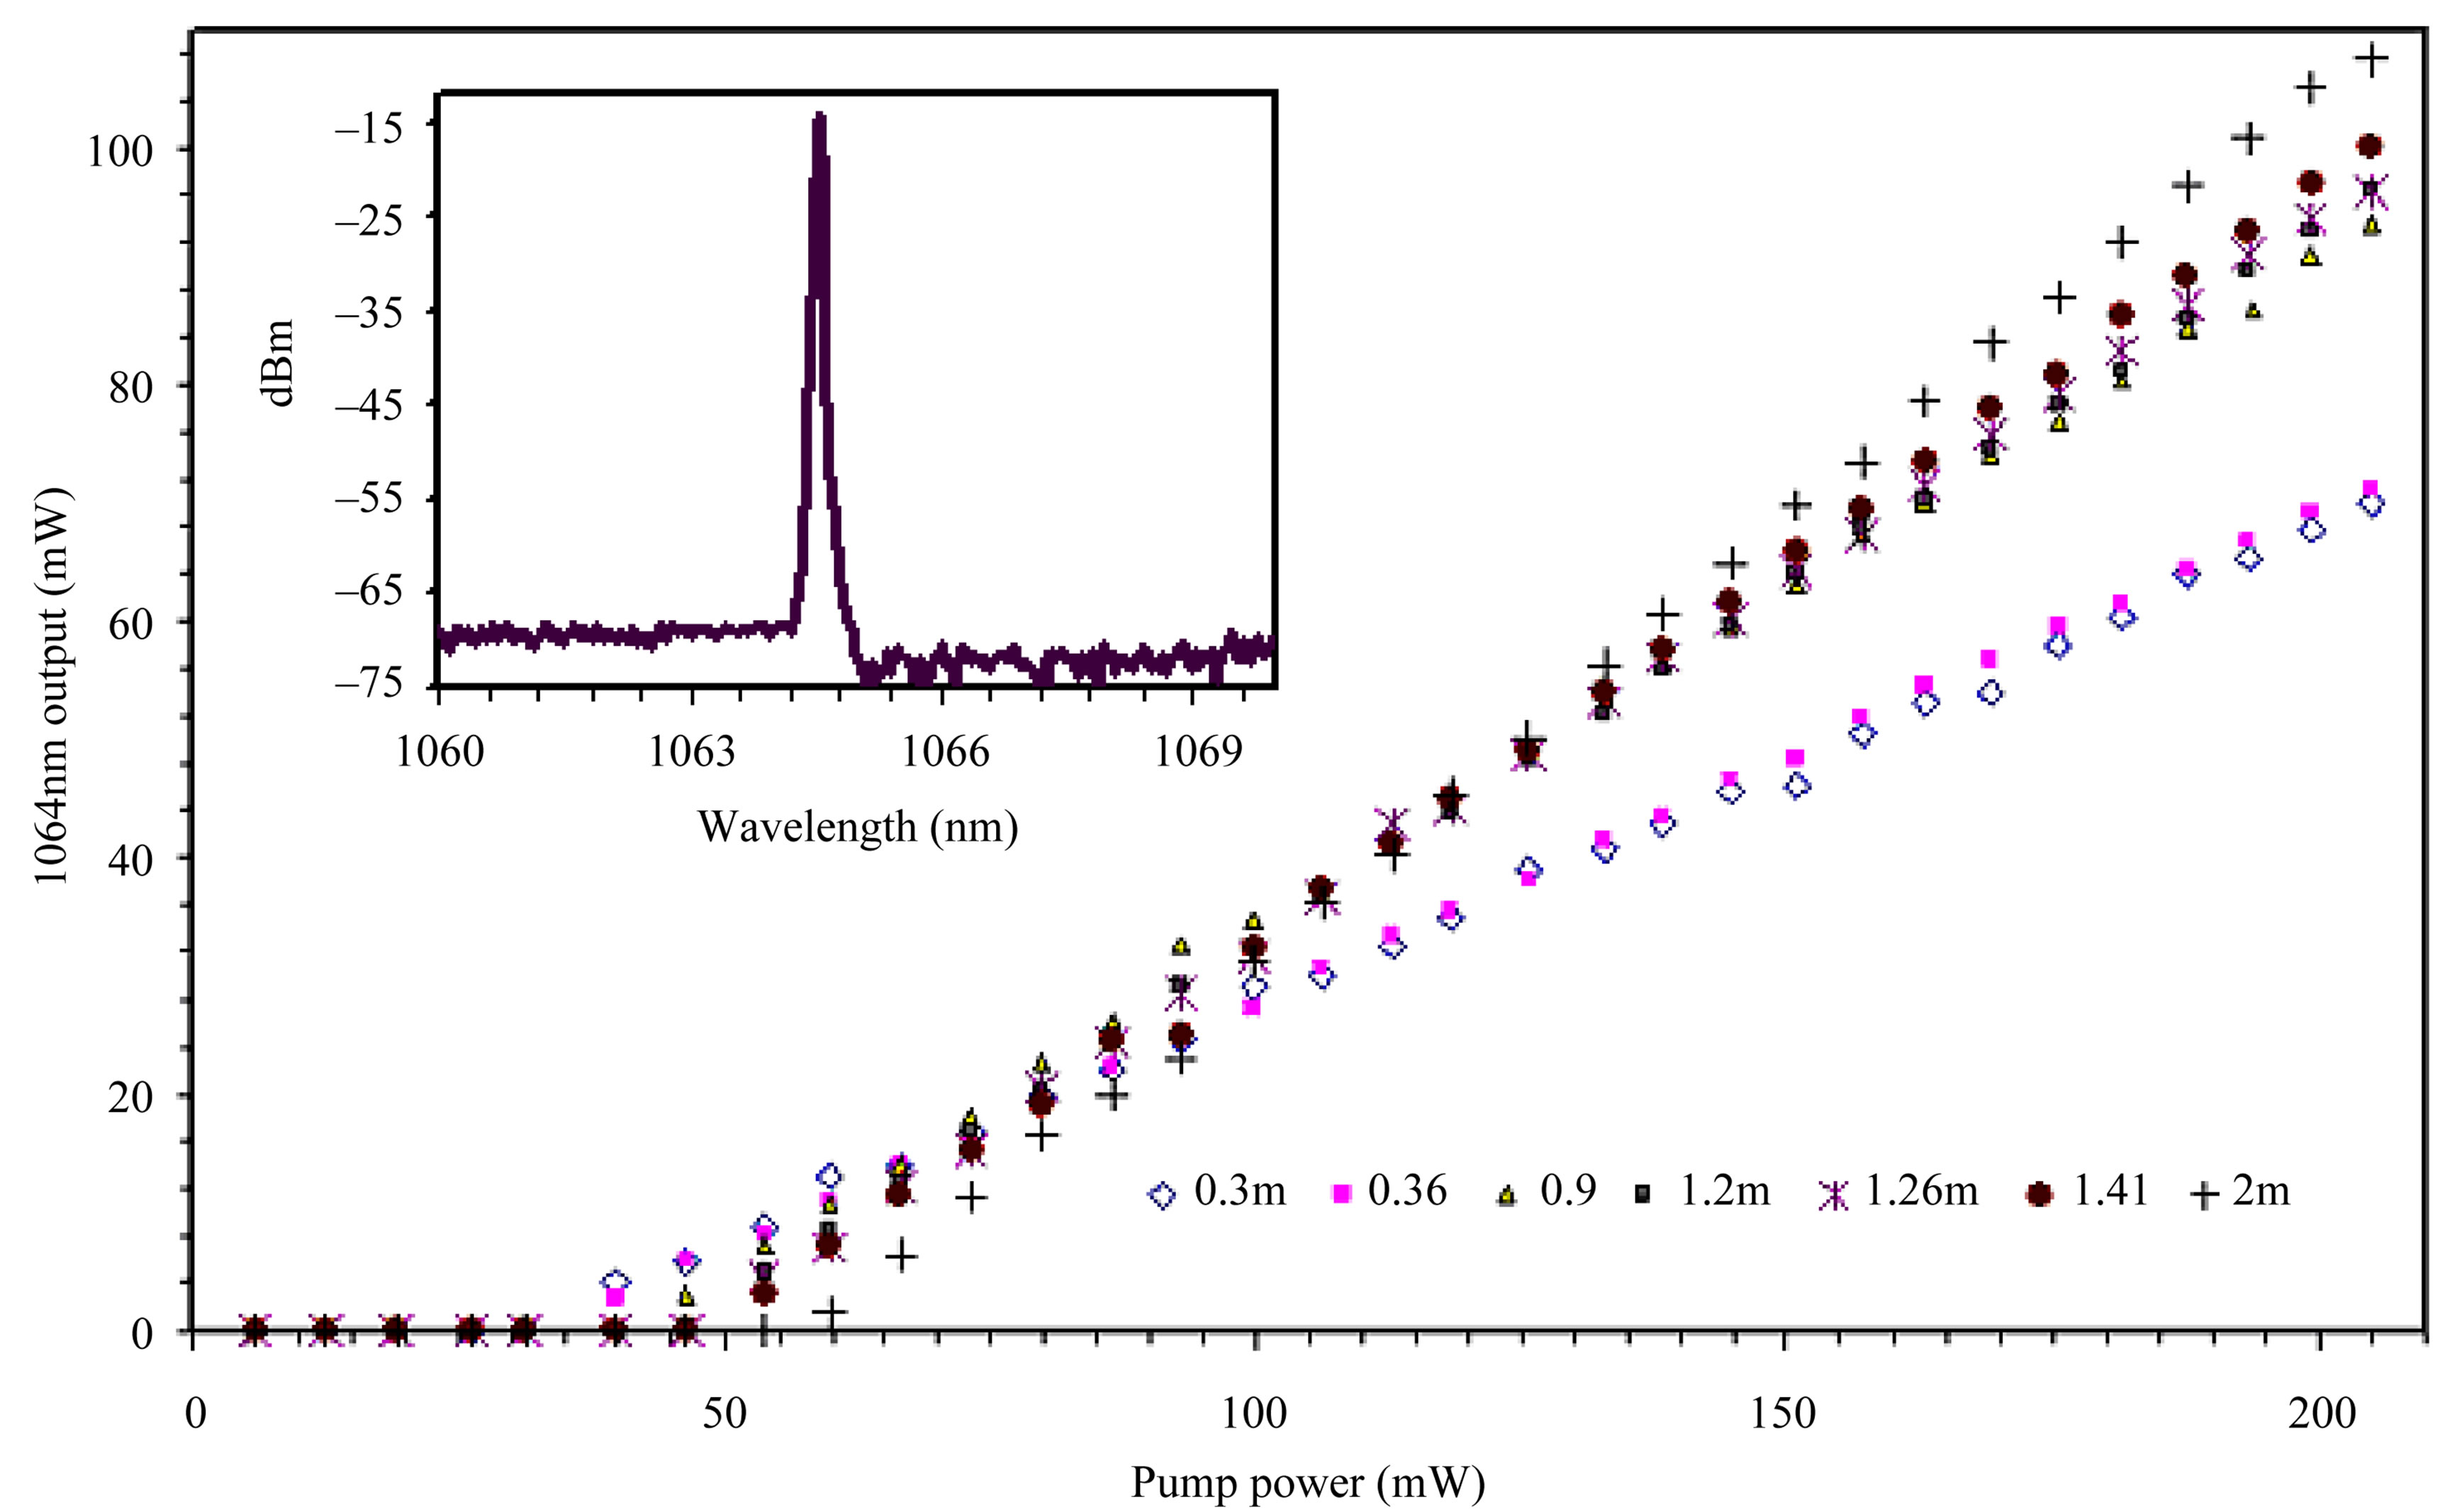
Figure 6. Output power as a function of the 975 nm pump power for 1064 nm wavelength. Inset shows typical laser spectrum.
On the other hand, for shorter operating wavelength the output power is optimized at a shorter YDF length near 30 cm. Figure 7 shows the the output power of the laser versus pump power when the operating wavelength (λ) is 1028.02 nm. This figure indicates that a long YDF does not have the higher slope efficiency and shows that the laser threshold decreases as the length of YDF decreases. It is also found that the bandwidth of laser line (0.08 nm) remains unchanged with the pump power.
3. Rate Equations
The spectroscopy of the Yb ion is simple as compared to other rare-earth ions. Nonetheless, when Ytterbium is doped in the amorphous silica glass, the emission and absorption spectrum broaden beyond that which would be found in a crystalline structure due to the sub-bands of the two manifolds, 2F5/2 and 2F7/2 [11,12]. Figure 8 shows the absorption and emission cross sections for YDF used in this work [13]. The three levels
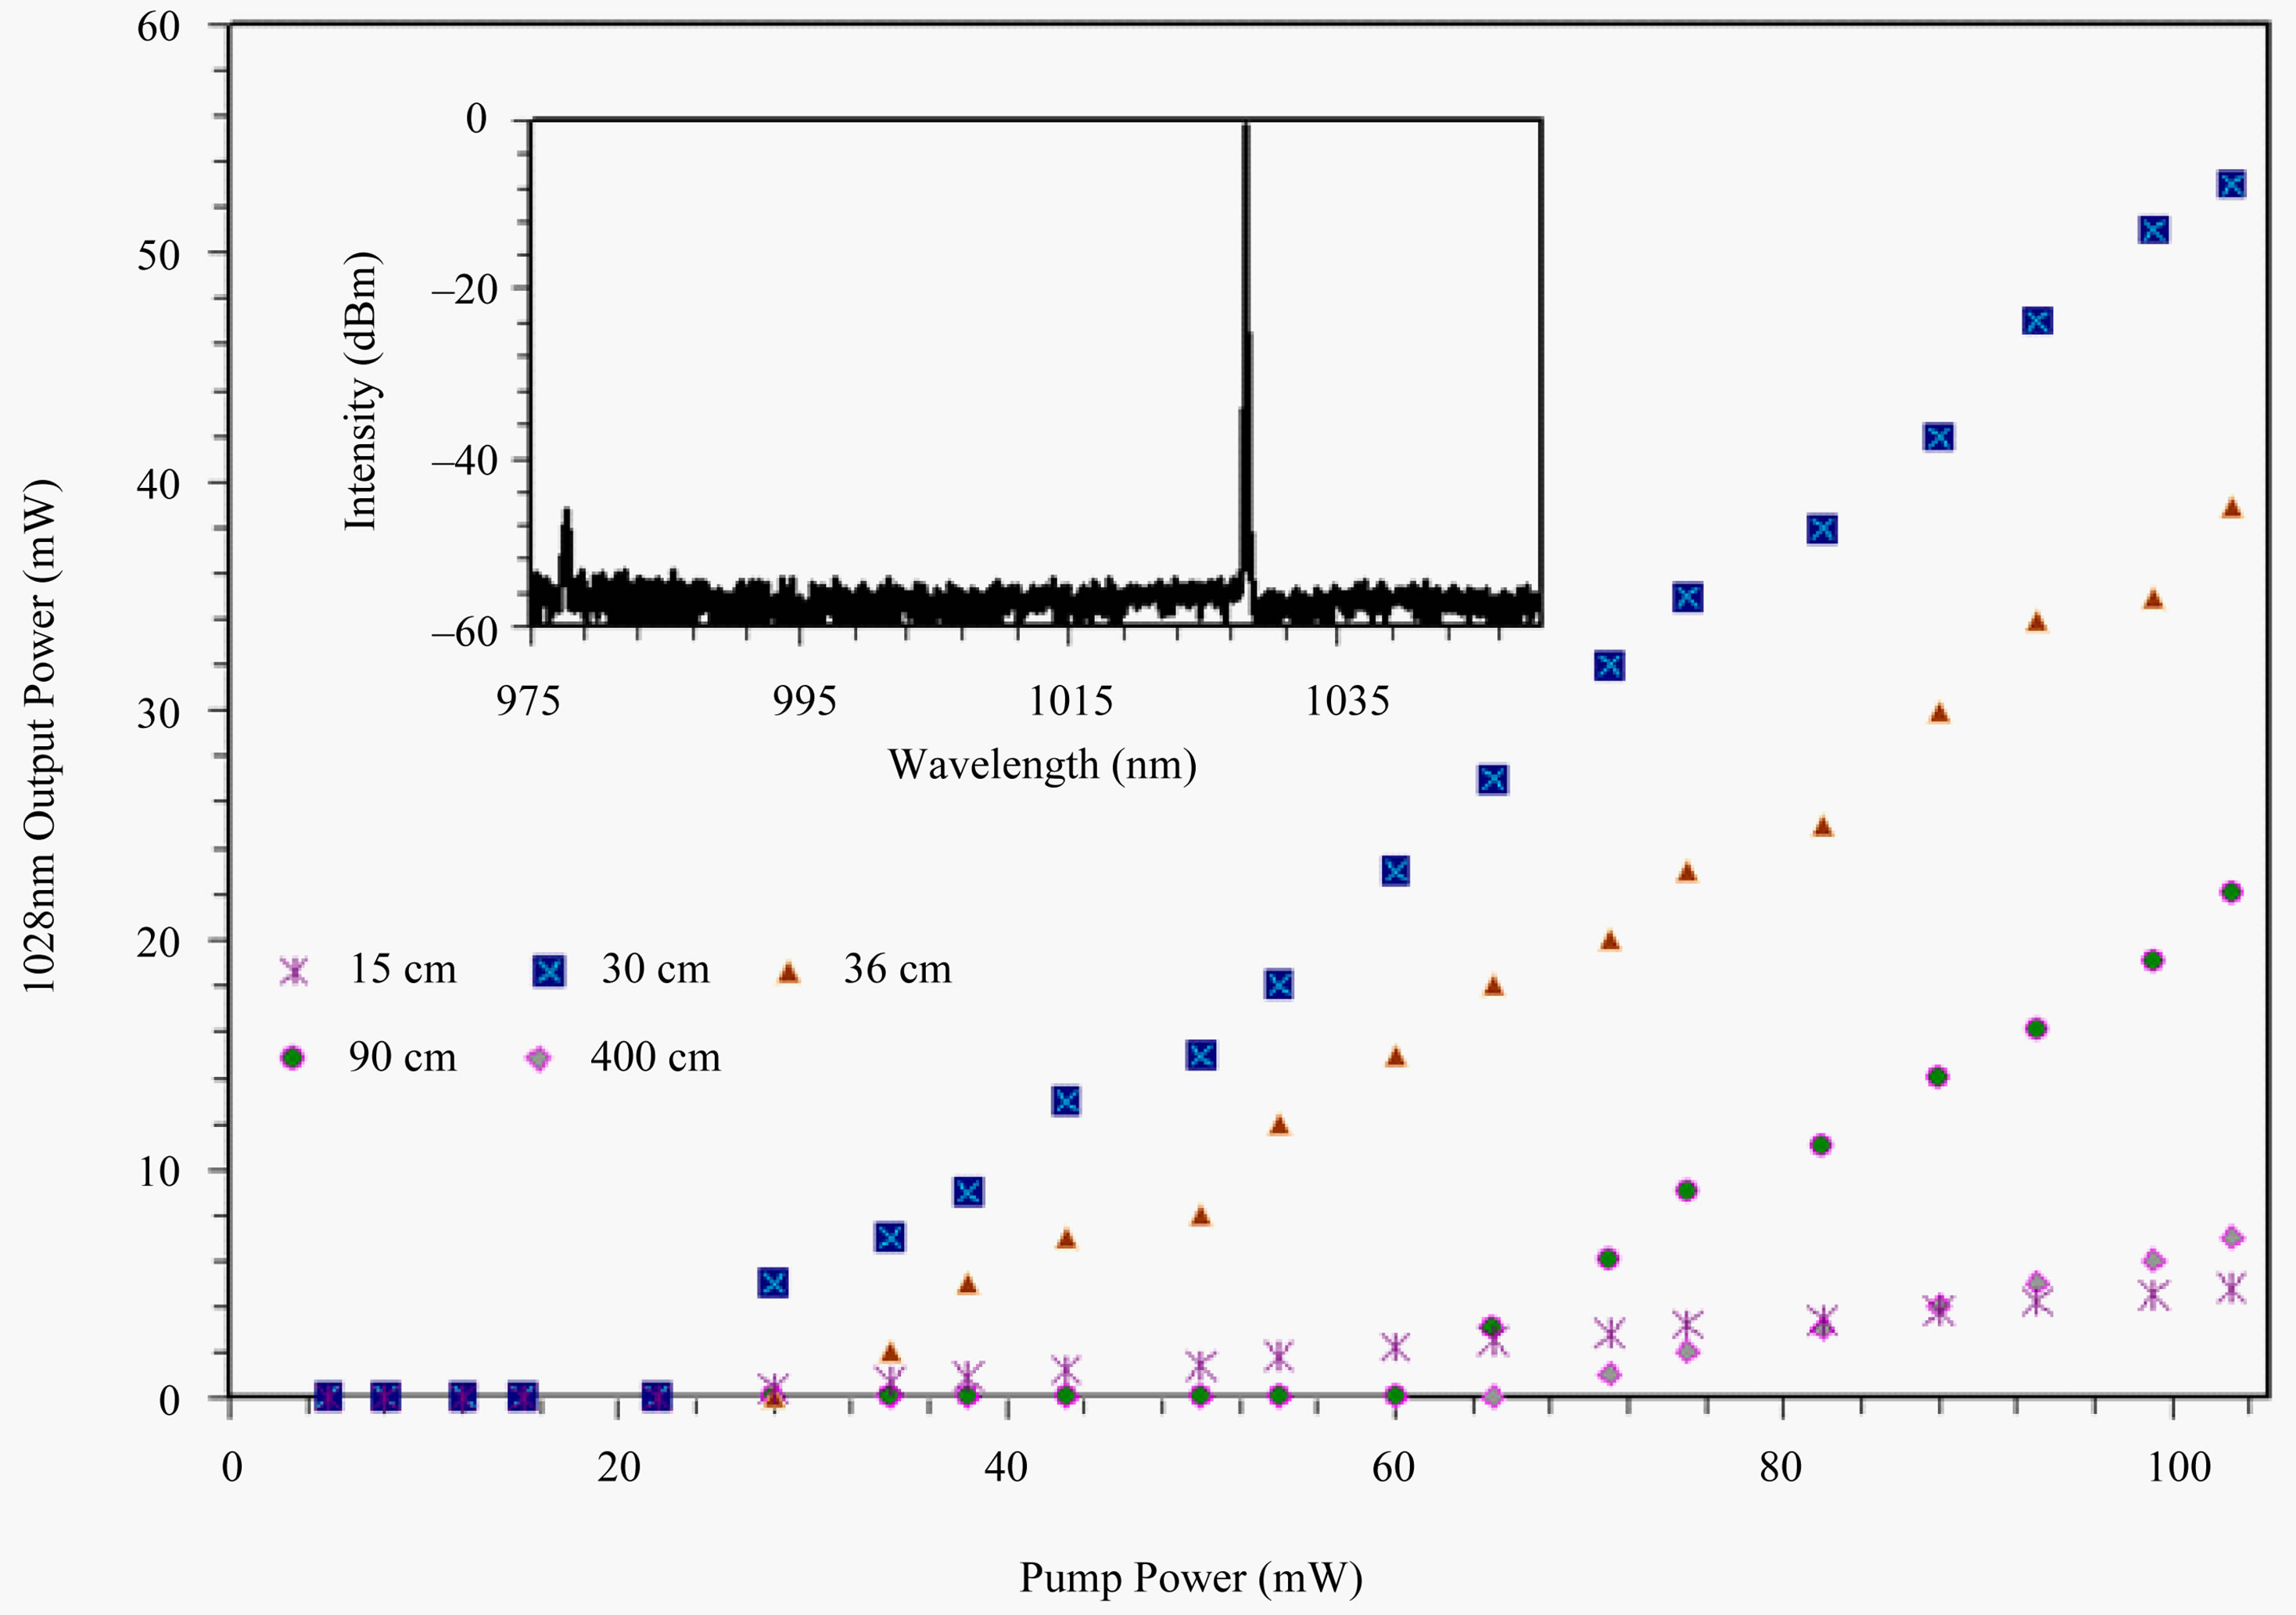
Figure 7. Output power as a function of the pump power for operating at 1028 nm.

Figure 8. Absorption (solid line) and emission (dashed line) cross-sections used for numerical calculations. Inset-The energy levels structure of Yb3+ ions in silica.
in the upper manifold (2F5/2) are denoted by a, b, and c in the inset of the figure.
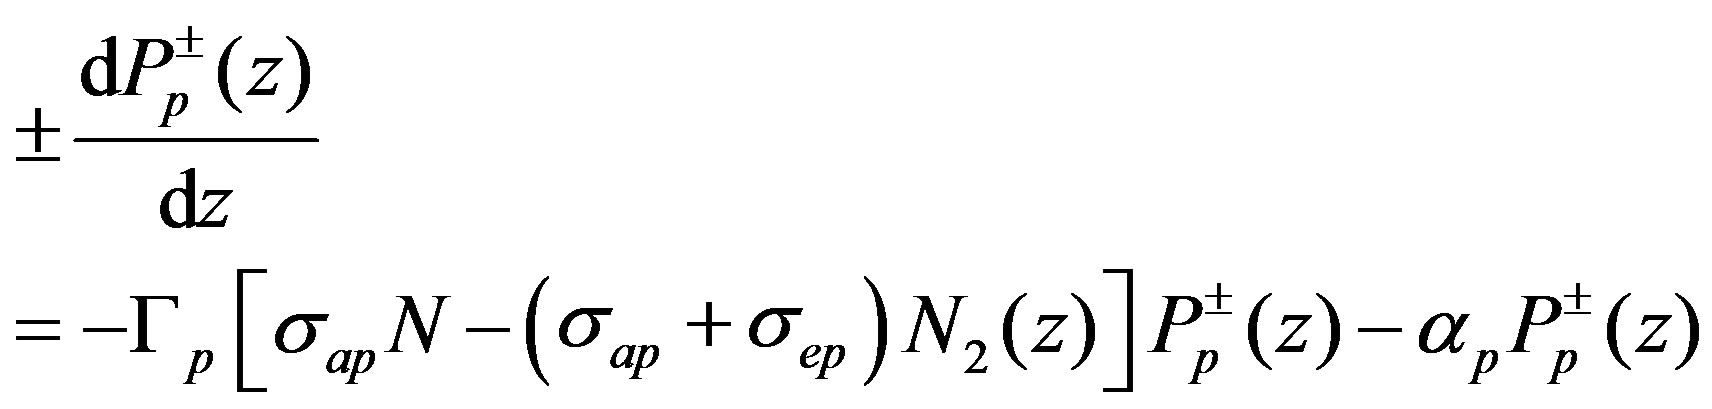
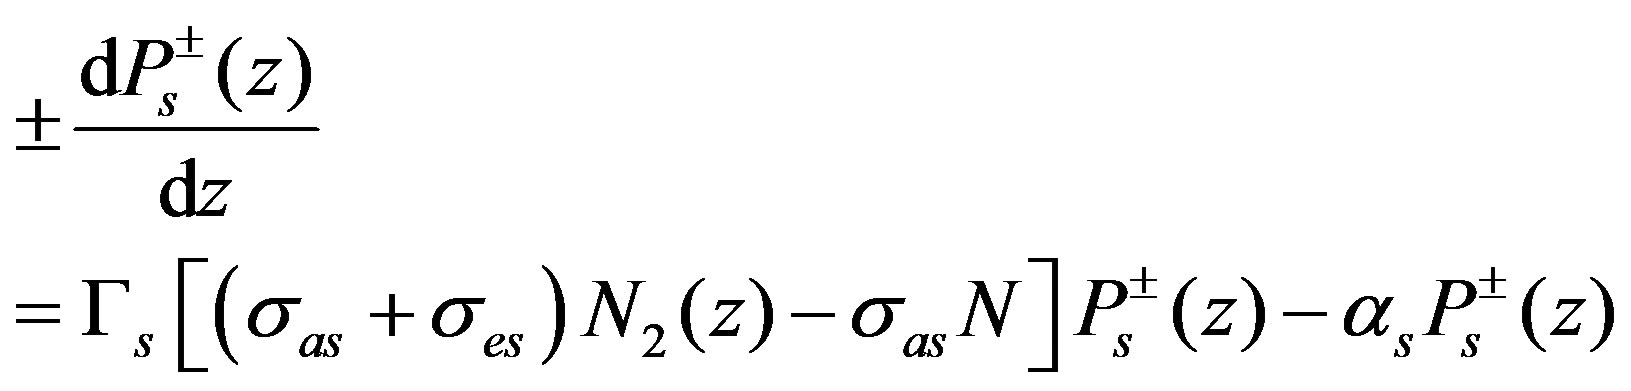
The analytical solutions of the rate equations in the presence of optical scattering loss and strongly pumped condition has been reported in [14]. The set of coupled equations and boundary conditions to be solved are given as:
 (1)
(1)
 (2)
(2)
 (3)
(3)
where τ ascertains the spontaneous lifetime, and  denotes scattering loss coefficient of pump (oscillating) light which is independent of z. Moreover σap(σas) and σep(σes) are absorption and emission cross sections of the pump (laser) light, respectively (see Figure 8).
Equation (1) describes the distribution of the upper level population N2 at position z along the YDF, while the evolution of the co propagating  and counter propagating
  pump powers and laser powers (are given by Equations (2) and (3). It is worth to point out that the concentration density of Yb3+ ions N = N1(z) + N2(z) are set to a constant value and the strongly pumped condition is used based on
 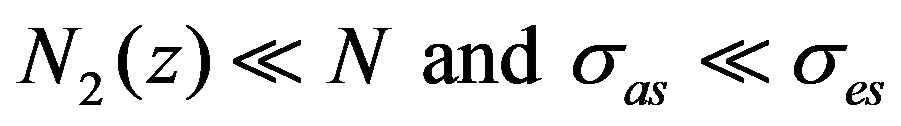 .
.
In the above equations, h, c,  and
and  denote Planck’s constant, the speed of light in vacuum, the pump and oscillation frequencies respectively. Some of the important parameters used in the numerical calculations and the procedure to obtain these parameters have been reported in [15]. In the modeling the active fiber with a length of L and a core area of A = 1.28 × 10⁻¹¹ m2 has an average constant concentration per unit volume (N) of 1.02 ×1026 ions/m3. The excited state lifetime, the background loss at 1000 nm,
  (power filling factors) are also set at 0.88 ms, 40.99 dB/km, 0.7 and 0.9 respectively. Where
 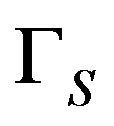 represents the contribution of laser power in the core and
  illustrates the fraction of the pump power actually coupled to the core.
According to the Figure 9, the pump power is injected at z = L or 0 at a known level and the laser beam is generated and propagated along the fiber. At the ends of the YDF, a portion of the power is ultimately reflected. Hence the rate equations are to be solved subject to the boundary conditions [7]:
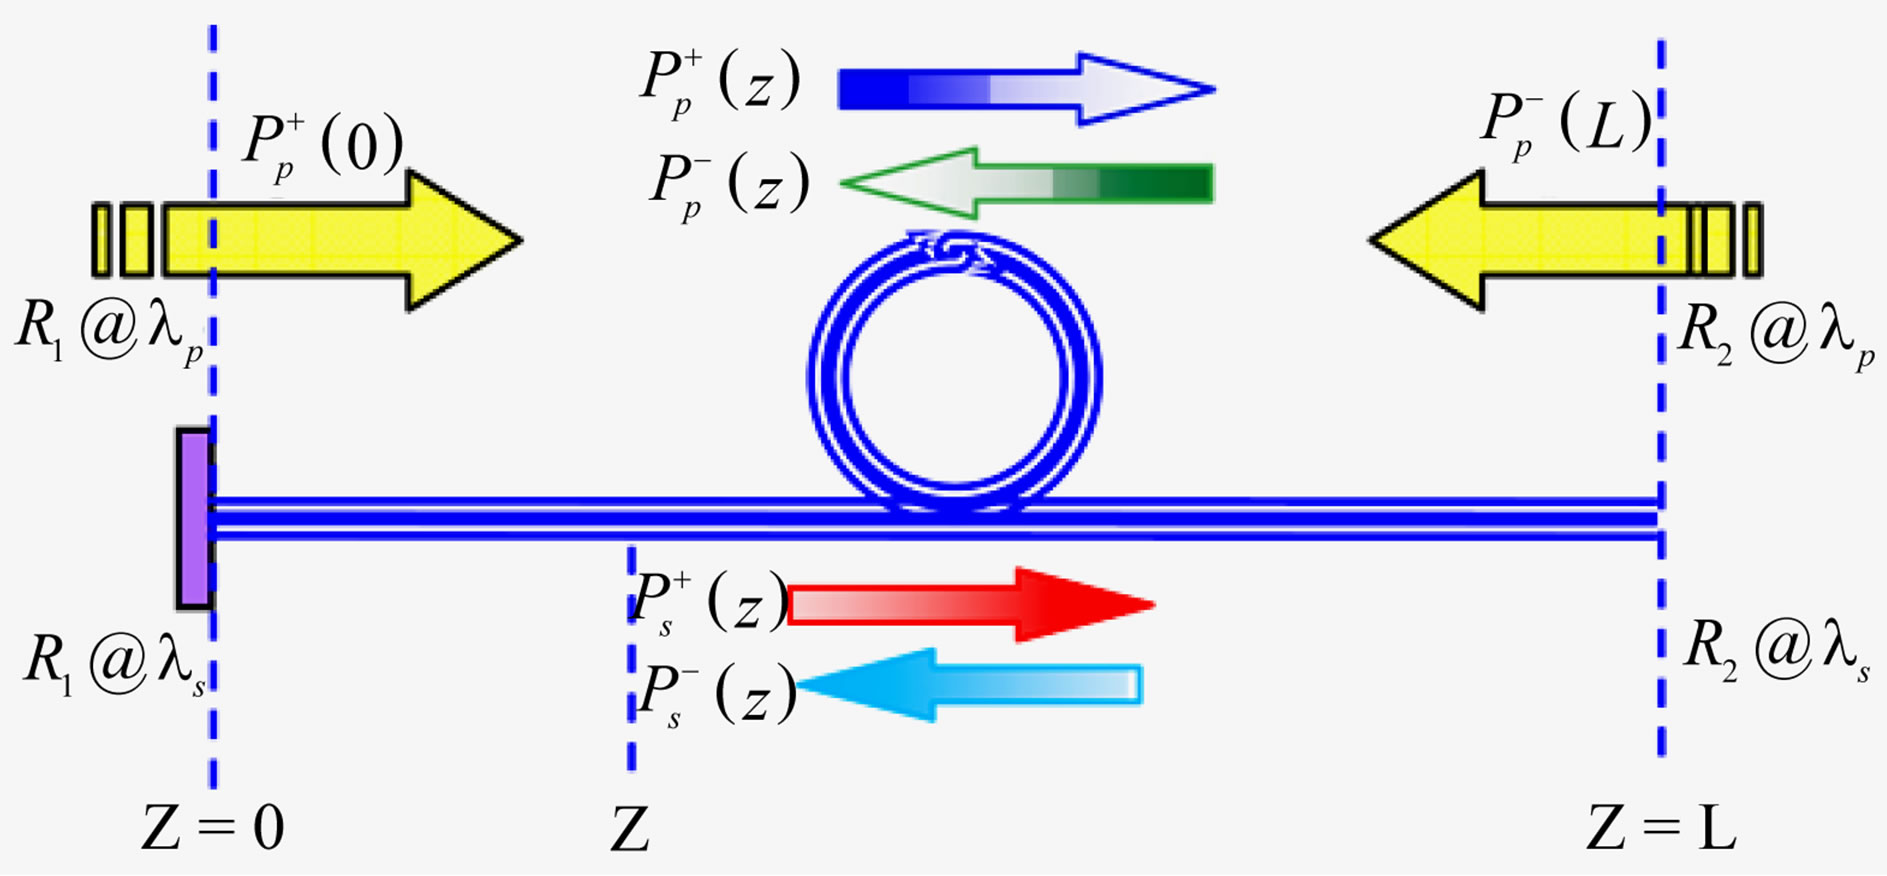
Figure 9. Schematic illustration of end-pumped YDFL.
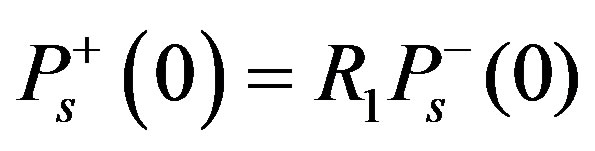 (4)
(4)
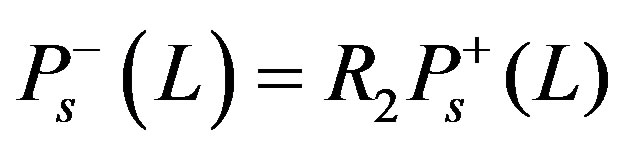 (5)
(5)
where  and
and  are the reflectivities of
  and
and  and
and  are the oscillating powers at z=L and 0 respectively. In numerical methods, the initial values of
  or
or  would be determined using shooting methods [8].
In this work, Equations (1)-(3) are solved without neglecting the scattering loss and approximating in the distributed loss laser power density [7]. The calculations are run numerically in fourth-order Runge-Kutta method by using Matlab.
4. Simulation Results and Discussion
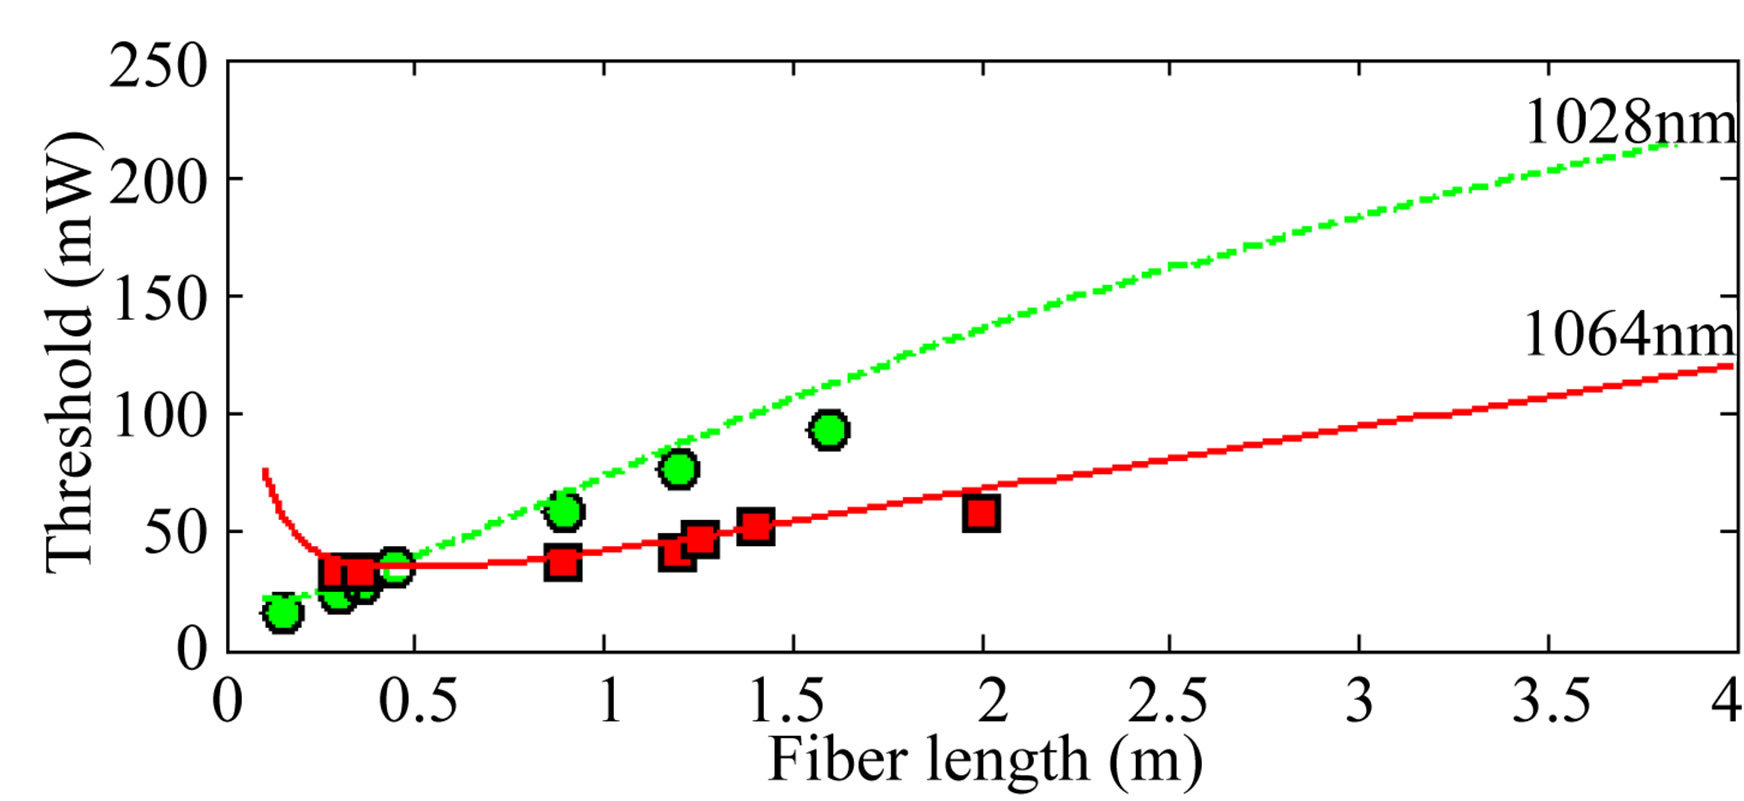
Figure 10(a) compares the numerical and experimental results of threshold power as a function of the fiber length for operating wavelengths of 1028 nm and 1064 nm. The numerical and experimental output powers as a function of the fiber length are also compared for operating wavelengths of 1028 nm and 1064 nm as shown in Figure 10(b). In the figures, forward pumping power is fixed at 93 mW.
As demonstrated in Figure 11 for a 2 m long YDF and pumping at 974 nm, the minimum of the threshold power is obtained at operating wavelength of 1080 nm.
For a given length of the resonator (e.g. 2 m long YDF), by choice of an appropriate pumping and operating wavelength, the threshold power can be reduced by more than six times as shown in Figure 12.
 (a)
(a)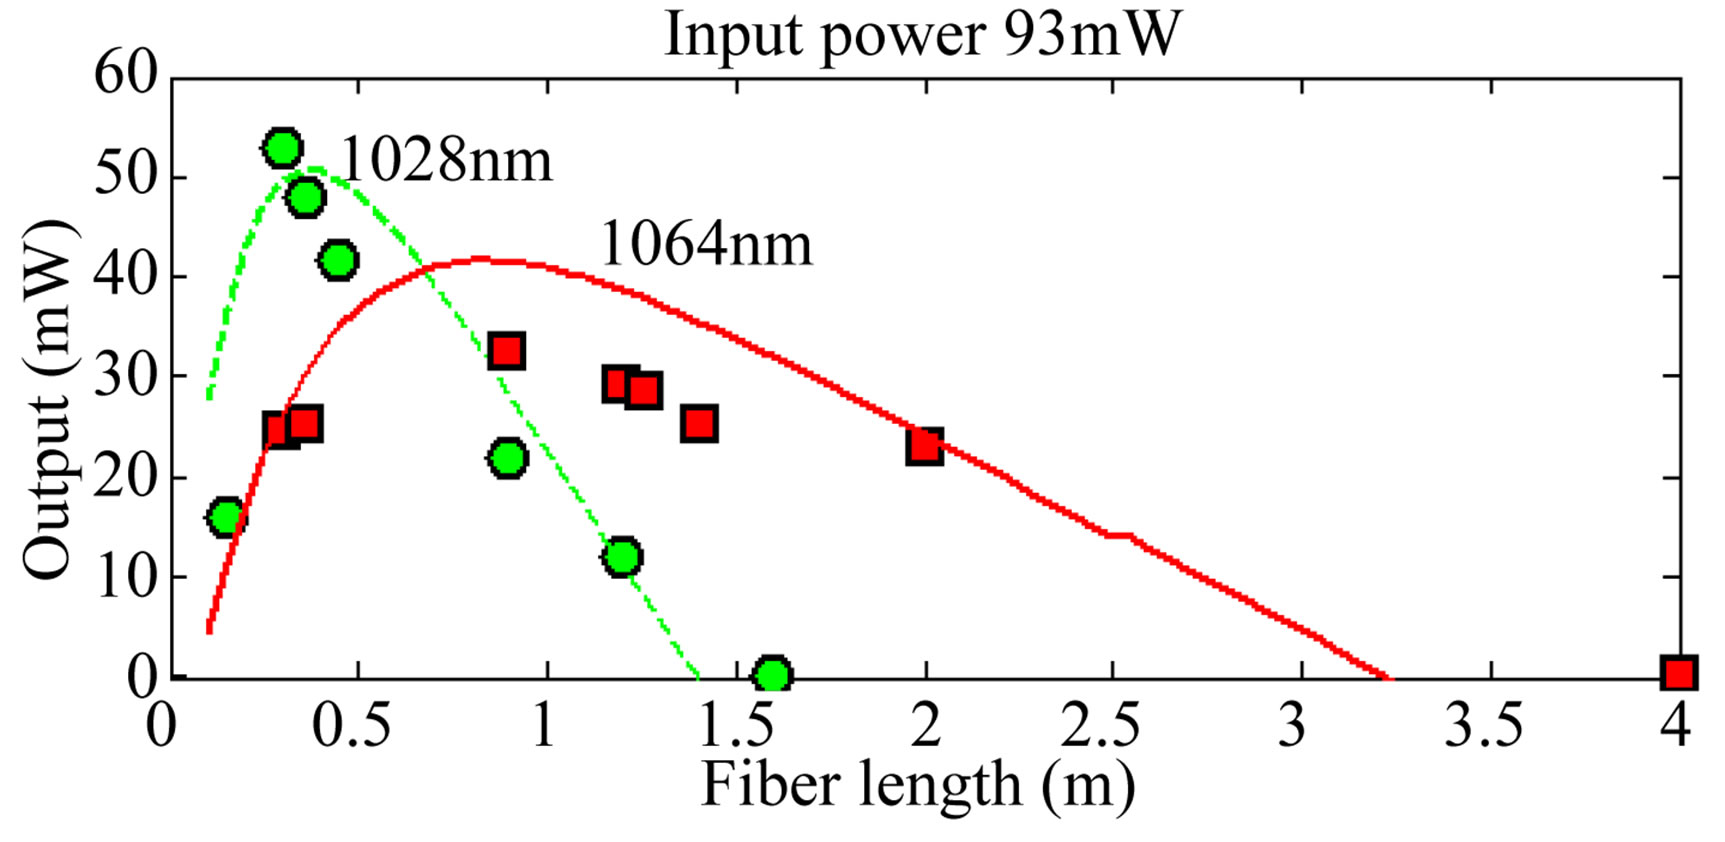 (b)
(b)
Figure 10. (a) Threshold power and (b) output power against fiber length at 93 mW of input pump power.

Figure 11. Laser threshold as a function of pumping wavelength for various operating wavelengths. The YDF length is fixed at 2 m.
 Output Wavelength (μm)
Figure 12.Laser threshold for 2 m long YDF as a function of operating wavelength.

Figure 13. Optimum length as a function of operating wavelength for a fixed input power of 200 mW. Inset shows the dependency of optimum length on the pumping wavelength.
Figure 13 shows the optimum length of proposed YDF laser as a function of operating wavelength when the forward Pump power is fixed at 200 mW. It can be observed from the figure that, the optimum fiber length increases with increasing the pump power. It is clear that the efficiency declines when the YDF is longer or shorter than presented lengths.
As shown in the figure the optimal length shortens when operating wavelengths are shorter. As demonstrated in the figure inset, for pumping near 915 nm or 975 nm, the optimal length is further shortened while, for pumping near 960 nm, longer lengths of the fiber are required.
5. Conclusion
In this research, the ASE spectrum characteristics for a highly Yb3+ doped fiber at different pump power levels and pump wavelengths were analyzed. Output power, laser threshold and optimum length were also measured and calculated under wide range of operating conditions. It was shown that, the measured ASE bandwidth (FWHM) would be approximately 32 nm under 975 nm pumping scheme while it can be reached up to 55 nm under 967 nm forward pumping scheme. Then, we proved that, by setting pumping and operating wavelength to certain proper values, one can reduce the threshold power by more than six times. The threshold power is minimum near pumping wavelength of 974 nm and at operating wavelength of 1080 nm. Finally the optimal YDF length shortens when operating wavelengths are shorter.
REFERENCES
- V. A. Akulov, D. M. Afanasiev, S. A. Babin, D. V. Churkin, S. I. Kablukov, M. A. Rybakov and A. A. Vlasov, “Frequency Tuning and Doubling in Yb-Doped Fiber Lasers,” Laser Physics, Vol. 17, No. 2, 2007, pp. 124-129. doi:10.1134/S1054660X07020120
- S. Kablukov, E. Dontsova, V. Akulov, A. Vlasov and S. Babin, “Frequency Doubling of Yb-Doped Fiber Laser to 515 nm,” Laser Physics, Vol. 20, No. 2. 2010, pp. 360- 364. doi:10.1134/S1054660X10040043
- A. S. Kurkov, “Oscillation Spectral Range of Yb-Doped Fiber Lasers,” Laser Physics Letters, Vol. 4, No. 2. 2007, pp. 93-102. doi:10.1002/lapl.200610094
- M. R. A. Moghaddam, S. Harun, S. Shahi, K. Lim and H. Ahmad, “Comparisons of Multi-Wavelength Oscillations Using Sagnac Loop Mirror and Mach-Zehnder Interferometer for Ytterbium Doped Fiber Lasers,” Laser Physics, Vol. 20, No. 2, 2010, pp. 516-512. doi:10.1134/S1054660X10030138
- S. W. Harun, M. C. Paul, M. R. A. Moghaddam, S. Das, R. Sen, A. Dhar, M. Pal, S. K. Bhadra and H. Ahmad, “Diode-Pumped 1028 nm Ytterbium-Doped Fiber Laser with near 90% Slope Efficiency,” Laser Physics, Vol. 20, No. 3. 2010, pp. 656-660. doi:10.1134/S1054660X10050051
- A. D. Guzman Chavez, A. V. Kir’yanov, Y. O. Barmenkov and N. N. Il'ichev, “Reversible Photo Darkening and Resonant Photobleaching of Ytterbium Doped Silica Fiber at In-Core 977 nm and 543 nm Irradiation,” Laser Physics Letters, Vol. 4, No. 10. 2007, pp. 734-739. doi:10.1002/lapl.200710053
- L. Xiao, P. Yan, M. Gong, W. Wei and P. Ou, “An Approximate Analytic Solution of Strongly Pumped YbDoped Double-Clad Fiber Lasers without Neglecting the Scattering Loss,” Optics Communications, Vol. 230, No. 4-6, 2004, pp. 401-410. doi:10.1016/j.optcom.2003.11.017
- Z. Lali-Dastjerdi, F. Kroushavi and M. H. Rahmani, “An Efficient Shooting Method for Fiber Amplifiers and Lasers,” Optics & Laser Technology, Vol. 40, No. 8. 2008, pp. 1041-1046. doi:10.1016/j.optlastec.2008.02.006
- D. Xue, Q. Lou and J. Zhou, “Comparison of Yb-Doped Fiber Laser with One-End and Double-End Pumping Configuration,” Optics & Laser Technology, Vol. 39, No. 4, 2007, pp. 871-874. doi:10.1016/j.optlastec.2005.12.005
- J. Koponen, M. Söderlund, H. J. Hoffman, D. A. V. Kliner, J. P. Koplow and M. Hotoleanu, “Photodarkening Rate in Yb-Doped Silica Fibers,” Applied Optics, Vol. 47, No. 9. 2008, pp. 1247-1256. doi:10.1364/AO.47.001247
- G. Demirkhanyan, “Intensities of Inter-Stark Transitions in YAG-Yb 3+ Crystals,” Laser Physics, Vol. 16, No. 7. 2006, pp. 1054-1057. doi:10.1134/S1054660X0607005X
- M. Javadi-Dashcasan, F. Hajiesmaeilbaigi, H. Razzaghi, M. Mahdizadeh and M. Moghadam, “Optimizing the Yb: YAG Thin Disc Laser Design Parameters,” Optics Communications, Vol. 281, No. 18. 2008, pp. 4753-4757. doi:10.1016/j.optcom.2008.05.055
- T. W. Huang and W. P. Lin, “Braodband Tunable 1060 nm Fiber Ring Laser Band on Hybrid Amplifier with 45 nm Tuning Range,” IEEE Conference on Cross Strait Quad-Regional Radio Science and Wireless Technology, Harbin, 26-30 July 2011, pp. 270-273.
- I. Kelson and A. Hardy, “Optimization of Strongly Pumped Fiber Lasers,” Journal of Lightwave Technology, Vol. 17, No. 5, 1999, pp. 891-897. doi:10.1109/50.762908
- P. Nandi and G. Jose, “Ytterbium-Doped P2O5-TeO2 Glass for Laser Applications,” IEEE Journal of Quantum Electronics, Vol. 42, No. 11. 2006, pp. 115-1121. doi:10.1109/JQE.2006.882557
NOTES
*Corresponding author.