Journal of Surface Engineered Materials and Advanced Technology
Vol.4 No.3(2014), Article ID:45375,8 pages DOI:10.4236/jsemat.2014.43016
Formation of TiO2 Nanotube Layer by Anodization of Titanium in Ethylene Glycol-H2O Electrolyte
Alain Robin1*, Michele Bernardes de Almeida Ribeiro1, Jorge Luiz Rosa1,2, Roberto Zenhei Nakazato2, Messias Borges Silva1,2
1Escola de Engenharia de Lorena, Universidade de São Paulo, Lorena, Brazil
2Faculdade de Engenharia de Guaratinguetá, Universidade Estadual Paulista, Guaratinguetá, Brazil
Email: *alain@demar.eel.usp.br
Copyright © 2014 by authors and Scientific Research Publishing Inc.
This work is licensed under the Creative Commons Attribution International License (CC BY).
http://creativecommons.org/licenses/by/4.0/


Received 23 December 2013; revised 20 January 2014; accepted 18 February 2014
ABSTRACT
In orthopaedics and orthodontics, the growth of nanotubes of titanium oxide on titanium implants is a promising route for improving the osseointegration. Among the fabrication routes to produce nanotubes, anodization was generally preferred due to its simplicity and low cost. TiO2 nanotubes are formed by the simultaneous anodic reaction and chemical dissolution due to the fluoride species present in the anodization bath. In this work, the formation of TiO2 nanotubes was studied in stirred ethylene glycol-H2O electrolyte (90 - 10 v/v) containing NH4F at room temperature. In order to study the effect of NH4F concentration, voltage and anodization time, and to reduce the number of experiments, a design of experiments (DOE) based on a 2k factorial design with four replicates at the center point was used. The analysis of variance (ANOVA) was used to evaluate the effects of the factors of control and their interactions on the percentage of the titanium surface coated by nanotubes. The dimensions of nanotubes (length and diameter) were also evaluated using field emission gun scanning electron microscopy. The cristallinity and phase composition of the oxide layers was investigated by X-ray diffractometry. The electrochemical behavior of as-received and anodized titanium specimens was studied in Ringer’s solution. The statistical analysis showed that fluoride concentration is the most significant factor. The best condition according to the response surface analysis is the center point (1% NH4F, 20 V, 2 h). The nanotubular oxide layers presented an amorphous structure. Electrochemical tests showed that TiO2 nanotubes coated titanium is less corrosion resistant than as-received titanium.
Keywords:Nanotubes, Titanium, Anodization, Implants

1. Introduction
Titanium is widely used for the fabrication of dental and orthopaedic implants due to its high corrosion resistance in physiological media and biocompatibility [1] .
In order to ensure a good osseointegration of titanium implant, surface treatments, such as grit-blasting, acidetching, calcium phosphate deposition and anodization were evaluated but it is the latter one which was the most investigated in the past decade, due to its simplicity and low-cost. Depending on the process parameters, anodization of titanium surface can lead to the production of compact, random porous, oriented porous and oriented tubular titanium oxide.
Highly ordered titania nanotube layers were shown to enable interlocking of titanium implants with bone cells [2] . Titania nanotube layers were principally obtained in aqueous [3] -[7] or organic [3] [8] -[10] electrolytes containing fluorides.
The titania nanotubes grow due to two competitive reactions, according to:

(anodic oxidation)
and 
(chemical dissolution).
The factors that affect the growth of nanotubes are the electrolyte pH, temperature and ageing, fluoride concentration, anodization potential and current density, anodizing time. Posterior heat-treatments are usually performed in order to control the structure, properties and crystallinity of the nanotube layers [11] [12] .
Some studies appointed that titania nanotubes can also be formed in free-fluoride solutions, but the nanotube layers are not self-organized [12] .
The aim of the present work was the production of titania nanotube arrays by anodization of titanium in NH4F/ethylene glycol/H2O electrolytes and their morphological characterization. The influence of voltage, anodization time and fluoride concentration and their possible interactions on the obtainment of nanotubes was studied using a design of experiments (DOE). The oxide layers were analyzed by scanning electron microscopy and X-ray diffractometry. The electrochemical behavior was evaluated in Ringer’s solution that simulates the body fluid.
2. Experimental Procedure
Grade 2 titanium rods of 3 mm diameter were used as anodes and a platinum foil of 12 cm2 as cathode. The electrolyte for anodization was the ethylene glycol-H2O electrolyte (90 - 10 v/v) mixture containing NH4F. The experiments were performed at room temperature under magnetic agitation. Before anodization, the samples were dipped for 10 min in ethanol PA under ultrassonication and dried with an argon stream.
The NH4F concentration was 0.5 wt%, 1.0 wt% and 1.5 wt%. The applied voltage between the titanium sample and the platinum cathode was 10 V, 20 V and 30 V and the anodization time were 1, 2 and 3 hours.
In order to study the influence of voltage, anodization time and fluoride concentration and their possible interactions on the obtainment of nanotubes, a 2k factorial experimental design [13] was used with the three factors, (A) fluoride concentration, (B) voltage and (C) anodization time, at two levels (high (+1) and low (−1)) and four replicates at the center point (all factors at the (0) level). The response variable was the percentage of the surface covered by titania nanotubes. This response variable was measured from FEG-SEM (FEI-Inspect F50) images obtained at 60,000 × magnification using the Image Tool 2.0 free software. Liu [6] also used a statistical experimental method in order to study the formation of titania nanotubes in H3PO4-NH4F medium.
The control factors and their respective levels are presented in Table 1. The experiments were performed according to the DOE shown in Table 2.
The statistical analysis was based on the Pareto diagram, analysis of variance (ANOVA) and response surface methodology.
Pareto diagram is a bar chart that displays the relative importance of various factors and puts them in order from the highest to the lowest significant.
The analysis of variance (ANOVA) is a statistical method used in order to test the difference between several means. This method allows to defining what process parameter (factor or interaction) is statistically significant.

Table 1. Control factors and their respective levels.
Table 2. Factor settings of the DOE.
The results of ANOVA are presented in a table that displays for each factor (or interaction) the values of the sum of squares (SS), number of degrees of freedom (DF) and mean of squares (MS), F value and p value. The meaning of SS, DF, MS, F and p can be found in many introductory texts on statistical theory available in literature [13] . In the present work, F test was used to see the significance of each factor or interaction on the response variable.
The response surface methodology (RSM) uses 3D graphics, which show the influence of two factors on the response variable. Using this methodology, it is possible to optimize the response variable.
The statistical analysis was performed using the Statistica 2.0 and Matlab softwares.
X-ray diffractometry analysis (PANalytical diffractometer) was performed using nickel filtered Cu Kα radiation (λ = 1.5418 Å), 2θ ranging from 10˚ to 90˚, angular step 0.02˚ and counting time of 30 s. The diffractograms were indexed using the HighScorePlus software (PANalytical).
The electrochemical behavior of as-received and anodized titanium was evaluated in naturally aerated Ringer’s solution (8.6 g NaCl + 0.3 g KCl + 0.33 g CaCl2-2H2O in 1000 mL H2O) at room temperature by potentiodynamic polarization using 1 mV·s−1 sweep rate. Prior to polarization, the samples were immersed in the solution for 3 hours. The Electrochemical Interface SOLARTRON mod. 1287A and the Ecorr/Zplot SOLARTRON mod. 125587S software were employed.
3. Results and Discussion
Independently on the process parameters (fluoride concentration, voltage and anodization time), oxide layers constituted of TiO2 were formed but their morphology depended on the anodization conditions, according to Ghicov [14] . Under the investigated process parameters, compact, porous or tubular morphologies were obtained (Figure 1).
The percentage of the surface covered by titania nanotubes obtained under our experimental conditions is reported in Table 3.
The Pareto chart of the effects of factors and interactions on the variable response (Figure 2) clearly indicates that the fluoride concentration (A) is the most significant factor. To a lower extent, the interaction between the three factors (ABC) is significant, followed by voltage (B), anodization time (C) and interaction (BC). This result is confimed by ANOVA (Table 4). Indeed, the highest F value is observed for factor (A), followed by
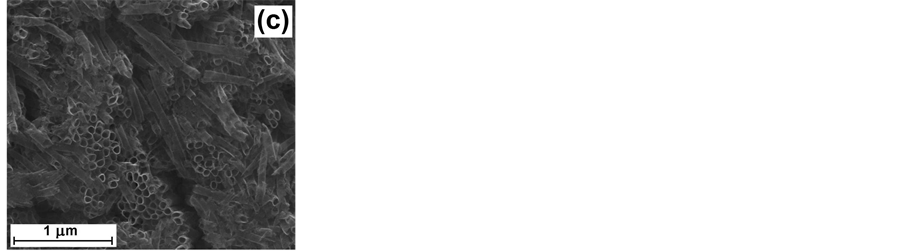
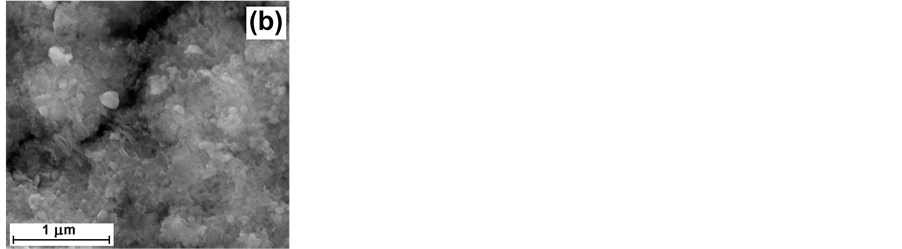
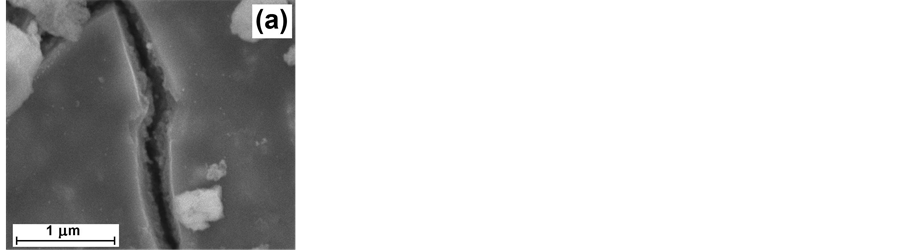
Figure 1. Morphology of the oxide layer formed by anodization of titanium in ethylene glycol-H2O electrolyte (90 - 10 v/v) as a function of the experimental conditions: (a) compact layer, 1.5% NH4F, 10 V, 1 h; (b) porous layer, 1.5% NH4F, 10 V, 3 h; (c) tubular layer, 1% NH4F, 20 V, 2 h.
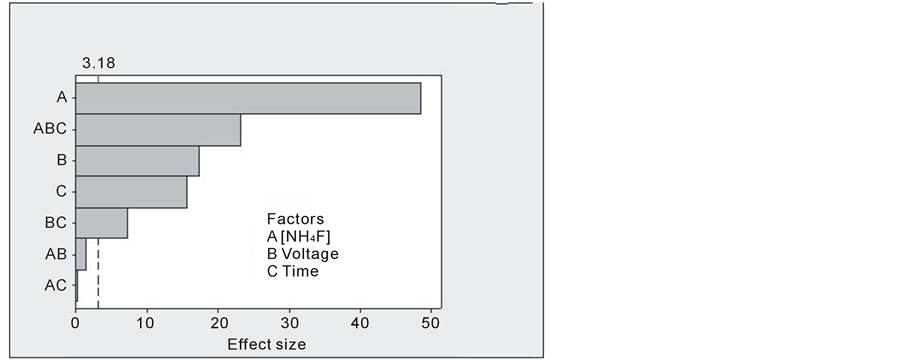
Figure 2. Pareto chart of the effects of factors and interactions on the percentage of the surface covered by titania nanotubes.
Table 3. Percentage of the surface covered by titania nanotubes (response variable) obtained under the experimental conditions of Table 2.
(ABC) interaction, factor (B), factor (C) and (BC) interaction. The fluoride concentration is of great importance for the dissolution of titanium oxide and the formation of nanotubes. It was shown that too low or too high concentration generally lead to compact or highly porous oxide, respectively, instead of tubular structure [3] [9] .
The main effects plot for the percentage of the surface covered by titania nanotubes (Figure 3) indicates that fluoride concentration (A) is the most significant control factor. Moreover, the behavior between the high (+1) and low (−1) levels is not linear for the three factors.
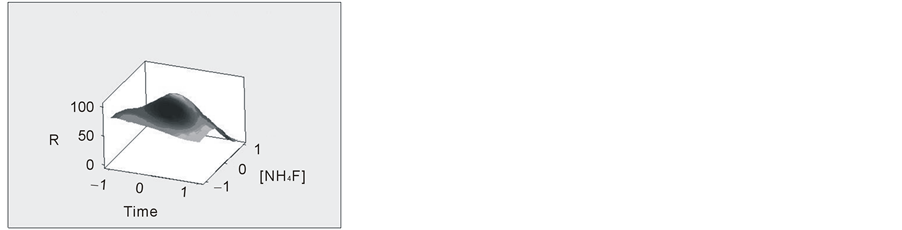
Figure 4 shows the response surfaces for the percentage of the surface covered by titania nanotubes as a function of fluoride concentration (A), voltage (B) and anodization time (C). The highest percentage was obtained under the conditions of the center point, i.e. 1.0% NH4F, 20 V and 2 h. Under these conditions, the titania nanotubes had nearly 3 mm length and 50 - 70 nm diameter (Figure 5).
Table 4. Analysis of variance (ANOVA) for average response of percentage of the surface covered by titania nanotubes.
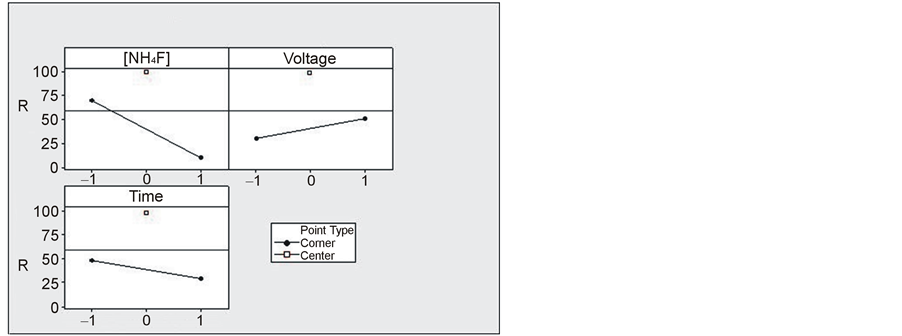
Figure 3. Main effects plot for the percentage of the surface covered by titania nanotubes.
 (a)
(a)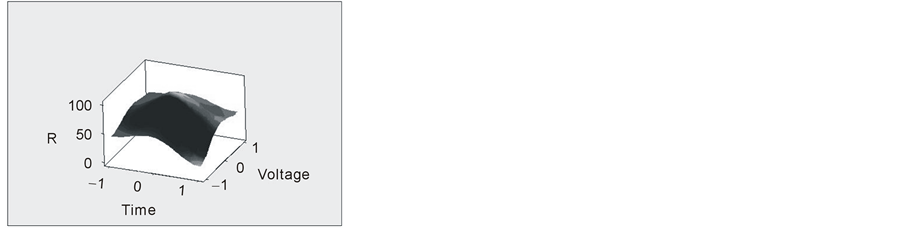 (b)
(b)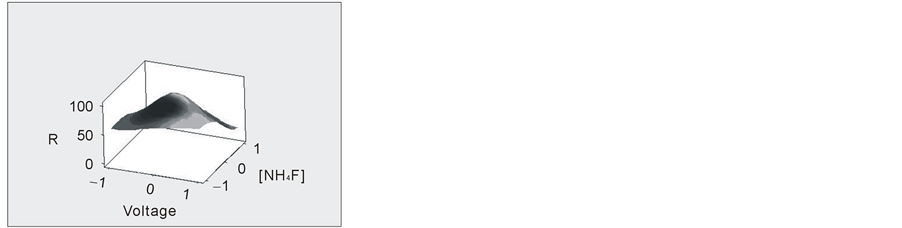 (c)
(c)
Figure 4. Response surfaces for the percentage of the surface covered by titania nanotubes as a function of: (a) fluoride concentration and anodization time, (b) voltage and anodization time and (c) fluoride concentration and voltage.
XRD analysis was performed on both as-received and anodized (under the conditions of center point) titanium. The X-ray pattern of the untreated titanium only presents the reflections of metallic titanium (Figure 6). The spectrum of anodized titanium also presents all the peaks of metallic titanium and two unidentified reflections at 2Q of 41.0˚ and 59.2˚. These peaks are not characteristic of anatase or rutile titanium oxide structures. Thus, the oxide layer formed on titanium by anodization must have an amorphous structure. According to Shibata [15] and Sul [16] , the oxide layer produced by anodization is mainly in an amorphous form but can also contain some crystalline phases, depending on the anodization process parameters.
The corrosion potentials of both untreated and anodized (under the conditions of center point) titanium measured after 3 hours immersion in Ringer’s solution, +0.021 and −0.066 V/SCE respectively, are in the stability region of TiO2 of the Ti-H2O Pourbaix diagram [17] , attesting a passive behavior. The polarization curves obtained for both materials are shown in Figure 7. As expected, the shape of the curves is characteristic of passive materials. The corrosion current densities measured by the extrapolation method are 2.6 × 10⁻⁶ and 2.1 × 10⁻⁵ A cm−2 for untreated and anodized samples, respectively, which depicts a higher corrosion resistance of as-received titanium. Similarly, the passive current density is lower for untreated titanium (2.2 × 10⁻⁴ A cm−2 at 1.5 V/SCE) when compared to anodized specimen (2.5 × 10⁻³ A cm−2 at 1.5 V/SCE). The higher stability of as-received titanium may be related to the presence of a continuous and compact native oxide film. Though the nanotubular oxide layer is thicker, its porosity leads to a less protective behavior. The results of Park [9] also showed a higher corrosion resistance of as-received titanium when compared to anodized titanium in simulated body fluid,
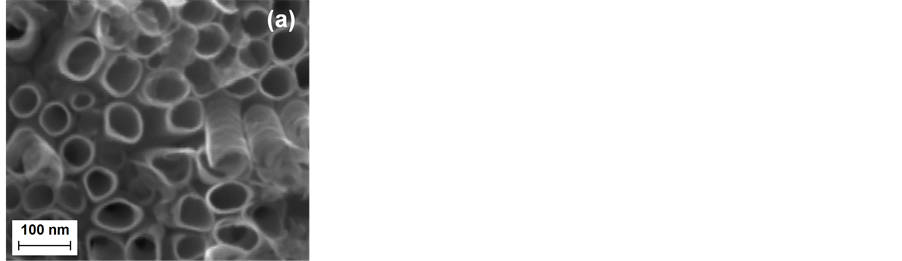
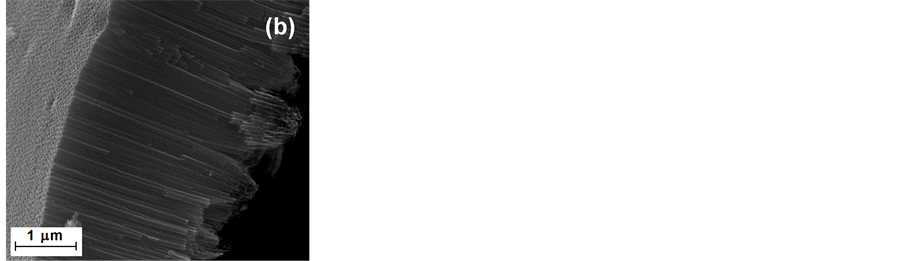
Figure 5. (a) Surface morphology and (b) cross-section of titanium nanotube layer obtained under the center point conditions (1.0% NH4F, 20 V and 2 h).

Figure 6. X-ray diffractograms of as-received titanium and titanium anodized under the center point conditions (1.0% NH4F, 20 V and 2 h).

Figure 7. Polarization curves of as-received titanium and titanium anodized under the center point conditions (1.0% NH4F, 20 V and 2 h) in Ringer’s solution at room temperature.
but Liu [18] observed a higher resistance of anodized titanium in artificial saliva. The titania nanotubes were obtained in H2O-glycerol-NH4F and HF solutions by Park [9] and Liu [18] , respectively. Thus, the difference in corrosion resistance in physiological solutions between untreated and anodized titanium may be related to both anodization process and solution composition.
4. Conclusions
Self-organized TiO2 nanotubes were obtained on titanium by anodization in ethylene glycol-H2O electrolyte (90 - 10 v/v) containing NH4F at room temperature.
Statistical analysis of the influence of the process parameters, i.e. fluoride concentration, voltage and anodization time, on the formation of nanotubes showed that fluoride concentration is the most significant factor.
The best condition in order to obtain well-organized titania nanotubes layer corresponded to the center point condition (1% NH4F, 20 V, 2 h).
The oxide layer formed on titanium by anodization presented an amorphous structure.
TiO2 nanotube coated titanium was less corrosion resistant than untreated titanium in Ringer’s solution.
Acknowledgements
To LME/LNNano/CNPEM (Campinas, Brazil) for the use of the FEG SEM Inspect F50 and to CNPq for PIBIC fellowship of M. B. A. Ribeiro.
References
- Jones, F.H. (2001) Teeth and Bones: Applications of Surface Science to Dental Materials and Related Biomaterials. Surface Science Reports, 42, 75-205. http://dx.doi.org/10.1016/S0167-5729(00)00011-X
- Narayanan, R., Lee, H.-J., Kwon, T.-Y. and Kim, K.-H. (2011) Anodic TiO2 Nanotubes from Stirred Baths: Hydroxyapatite Growth & Osteoblast Responses. Materials Chemistry and Physics, 125, 510-517. http://dx.doi.org/10.1016/j.matchemphys.2010.10.024
- Kaneco, S., Chen, Y., Westerhoff, P. and Crittenden, J.C. (2007) Fabrication of Uniform Size Titanium Oxide Nanotubes: Impact of Current Density and Solution Conditions. Scripta Materialia, 56, 373-376. http://dx.doi.org/10.1016/j.scriptamat.2006.11.001
- Prida, V.M., Manova, E., Veja, V., Hernandez-Velez, M., Aranda, P., Pirota, K.R., Vázquez, M. and Ruiz-Hitzky, E. (2007) Temperature Influence on the Anodic Growth of Self-Aligned Titanium Dioxide Nanotubes Arrays. Journal of Magnetism and Magnetic Materials, 316, 110-113. http://dx.doi.org/10.1016/j.jmmm.2007.02.021
- Bauer, S., Pittrof, A., Tsuchiya, H. andSchmuki, P. (2011) Size-Effects in TiO2 Nanotubes: Diameter Dependent Anatase/Rutile Stabilization. Electrochemistry Communications, 13, 538-541. http://dx.doi.org/10.1016/j.elecom.2011.03.003
- Liu, R., Hsieh, C.-S., Yang, W.D., Qiang, L.-S. and Wu, J.-F. (2011) Applying the Statistical Experimental Method to Evaluate the Process Conditions of TiO2 Nanotube Arrays by Anodization Method. Current Applied Physics, 11, 1294-1298. http://dx.doi.org/10.1016/j.cap.2011.03.058
- Pittrof, A., Bauer, S. and Schmuki, P. (2011) Micropatterned TiO2 Nanotube Surfaces for Site-Selective Nucleation of Hydroxyapatite from Simulated Body Fluid. Acta Biomaterialia, 7, 424-431. http://dx.doi.org/10.1016/j.actbio.2010.09.028
- Kafi, A.K.M., Wu, G., Benvenuto, P. and Chen, A. (2011) High Sensitive Amperometric H2O2 Biosensor Based on Hemoglobin Modified TiO2 Nanotubes. Journal of Electroanalytical Chemistry, 662, 64-69. http://dx.doi.org/10.1016/j.jelechem.2011.03.021
- Park, H.H., Park, I.S., Kim, K.S., Jeon, W.Y., Park, B.K., Kim, H.S., Bae, T.S. and Lee, M.H. (2010) Bioactive and Electrochemical Characterization of TiO2 Nanotubes on Titanium via Anodic Oxidation. Electrochimica Acta, 55, 6109-6114. http://dx.doi.org/10.1016/j.electacta.2010.05.082
- Cummings, F.R., Le Roux, L.J., Mathe, M.K. and Knoesen, D. (2010) Structure Induced Optical Properties of Anodized TiO2 Nanotubes. Materials Chemistry and Physics, 124, 234-242. http://dx.doi.org/10.1016/j.matchemphys.2010.06.024
- Minagar, S., Berndt, C.C., Wang, J., Ivanova, E. and Wen, C. (2012) A Review of the Application of Anodization for the Fabrication of Nanotubes on Metal Implant Surfaces. Acta Biomaterialia, 8, 2875-2888. http://dx.doi.org/10.1016/j.actbio.2012.04.005
- Regonini, D., Bowen, C.R., Jaroenworaluck, A. and Stevens, R. (2013) A Review of Growth Mechanism, Structure and Crystallinity of Anodized TiO2 Nanotubes. Materials Science and Engineering R, 74, 377-406. http://dx.doi.org/10.1016/j.mser.2013.10.001
- Montgomery, D.C. (2009) Introduction to Statistical Quality Control. 6th Edition, John Wiley & Sons, New York.
- Ghicov, A. and Schmuki, P. (2009) Self-Ordering Electrochemistry: A Review on Growth and Functionality of TiO2 Nanotubes and Other Self-Aligned MOx Structures. Chemical Communications, 45, 2791-2808. http://dx.doi.org/10.1039/b822726h
- Shibata, T. and Zhu, Y.-C. (1995) The Effect of Film Formation Conditions on the Structure and Composition of Anodic Oxide Films on Titanium. Corrosion Science, 37, 253-270. http://dx.doi.org/10.1016/0010-938X(94)00133-Q
- Sul, Y.-T., Johansson, C.B., Jeong, Y. and Albrektsson, T. (2001) The Electrochemical Oxide Growth Behaviour on Titanium in Acid and Alkaline Electrolytes. Medical Engineering & Physics, 23, 329-346. http://dx.doi.org/10.1016/S1350-4533(01)00050-9
- Pourbaix, M. (1966) Atlas of Electrochemical Equilibria in Aqueous solutions. Pergamon Press, New York.
NOTES

*Corresponding author.