Current Urban Studies
Vol.04 No.02(2016), Article ID:66798,15 pages
10.4236/cus.2016.42009
Evaluation of Infill Development Potential in Zone 8 of Tabriz by Analysis Network Process Method
Mohammadtaghi Razavian, Roghayeh Samadi*
Shahid Beheshti University, Tehran, Iran

Copyright © 2016 by authors and Scientific Research Publishing Inc.
This work is licensed under the Creative Commons Attribution International License (CC BY).
http://creativecommons.org/licenses/by/4.0/


Received 24 February 2016; accepted 23 May 2016; published 26 May 2016
ABSTRACT
One of the most important issues in the development of modern cities is the dispersed and horizontal expansion of cities. Due to a substantial effect of the form of a city on its stability, it is necessary to know, study and understand its different dimensions and guide it to achieve sustainable development. Thus, infill development that is the simplest interpretation of urban endogenous development is considered as one of the urban smart growth strategies. Focusing on the vacant and abandoned lands in cities, infill development tries to load development on these lands. This study aimed to use infill development approach to achieve future development of Zone 8 of Tabriz and identify its potentials, in which several indicators have been used including quality of buildings, access and permeability, compressibility and granularity. In order to determine the final capacity of development and the effect of each indicator, the indicators were weighted by analytic network process (ANP) approach. The results of the study indicated that 38 hectares of the area under study had very high potential of development that accounted for 12.14%. Therefore, Zone 8 of Tabriz has much potential in the infill development. It could be said that half of the total area within the study area is prone to the internal development that requires formulating a suitable planning based on the principles of smart growth.
Keywords:
Distributed and Horizontal Expansion, Infill Development, Network Analysis (ANP), Zone 8 of Tabriz

1. Introduction
Today, about 50% of the world population or three and a half billion live in cities but it is expected that by 2050, the urban population of the world increases by 84%; namely, 3.6 billion people (UN, 2010). Although population growth is the primary cause of the spread of cities, the same irrational distribution or horizontal expansion and new construction around the city causes socio-economic damages and destruction of environmental resources in the cities and surroundings. Due to a substantial effect of the form of a city on its stability, it is necessary to know, study and understand its dimensions and guide it to achieve sustainable development (Anderson, 1996: p. 8) . After 1970s and the World War II, severe reactions to uncontrolled growth of cities began. The reactions led to the formation of the movements such as smart growth, new urbanism, compact city and so forth. At smaller levels, the movements suggested some types of development, of which support of the transport-based development (TOD), mixed use development and the infill development could be mentioned (Sharifian, 2011: p. 3) .
Given the uncontrolled expansion of Iran’s cities, infill development is an effective approach. Focusing on the vacant and abandoned lands in cities, infill development could be seen as the simplest interpretation of internal development tries to load development on these lands. Tabriz is one of the oldest Iranian cities that were developed as other cities of Iran on the basis of common development methods, and new districts were formed on the border of its old districts. However, old organic tissue has changed due to the population, economic and physical changes of the city, and often abandoned despite its potential and capacities to accommodate the population and access to urban services, facilities and equipment, and lost its prosperity and function. Zone 8 of Tabriz is one of the oldest zones in the center of the city. The zone has a relatively good situation in terms of public equipment, and numerous valuable historical monuments add to its historical tourism importance. Unfortunately, despite all the noted potential, re-development of the zone should be reviewed due to several factors such as lack of proper planning for land use, lack of urban integrated and sustainable management, lack of proper and formulated urban planning criteria in accordance with the specific conditions of the zone, such as physical burnout and mismatch with the today’s needs of citizens, problems related to how to own road network.
2. Objectives of the Study
・ Identification of the existing infill levels in the area under study using network analysis process (ANP) approach.
・ Feasibility of the infill development capacity in the study area.
・ Proposals for redevelopment in accordance with the features of the study area.
3. Review of the Literature
Background and review of the literature of infill development approach and focus on the existing infill levels in urban districts can be divided in two forms of executive and research experiences:
Global experiences of the district Horner and Industrial Park of West Palman in Chicago, Albina Kerner, Oregon and Northern Macdom in Portland, and Porth Mouth in Virginia can be noted in the field of executive experiences.
From the research perspective, some studies were conducted on this area in Iran.
For instance, Vahdani’s (2009) study of “the evaluation of the development capacity in the process of sustainable urban development” (a case study on the districts Calcatechi or along the straight part of Kuche Tabriz) showed that there were capacities of residence for more than 40% increase in population compared to the current situation only through the capacities in the existing infrastructures and abandoned spaces in the district.
Khademi’s (2010) case study on the “evaluation of the solutions of design stimulating the development and presentation of the infill urban design model in the worn textures in the worn districts of Shemiranat, Tehran” used descriptive analytical method, examined the infill structures effects on the worn textures and introduced new infill structures as a driver of development in these textures.
In her MA thesis on “the infill development toward favorable urban development strategy (a case study on the historical-cultural axis of Tabriz metropolis)”, Shafaati (2010) noted infill development as one of the strategies of the urban smart growth and saw this new approach as a mechanism to deal with the urban spread and dispersion.
Rafieian et al .’s (2010) article “the measurement of unused spaces development capacity in the center of Qazvin” emphasized the infill development and investigated the reasons for the formation of infill levels in the center of Qazvin. They showed that the highest potential for expansion was related to the ranges that had the most problems in terms of physical, economic, social and environmental indicators and therefore the plaques with suitable conditions in terms of zoning laws and regulations had the highest development capacity.
In their article on “the middle texture of cities: the capacity to move towards intensive pattern”, Ziari et al. (2012) showed that the middle texture of Bojnourd had higher potential to combine the uses and urban compression then the old informal textures.
Ghorbani et al.’s (2013) study on the land suitability analysis for urban development within the urban range of Tabriz used hierarchical process analysis approach, natural and human indicators affecting the 12 indicators identified and GIS and classified the urban lands in Tabriz for a future planned and smart development.
Using GIS and AHP in their study on “the evaluation of Gorgan’s interstitial land suitability for the infill development”, Mir Katouli and Hosseini (2014) showed that the most consistent interstitial lands for the infill development were located in the north-east and north textures and the least consistent interstitial lands were in the west and south texture and the riverside of Gorgan.
4. Study Area
With an area of 140 square kilometers, Tabriz as the center of East Azerbaijan is located at longitude 46˚ and 15" east and latitude 38˚ and 8" north of the Greenwich meridian. It is one of the largest and most populated cities in the northwest of Iran. According to the census of 2011, Tabriz has ten municipality zones with 1,495,000 people and 24,453 hectares extent; each of them has a certain area and extent. Of the ten zones, Zone 8 of Tabriz municipality is considered as the most central and most important zone of the city. It has the most important historical and ancient monuments, including Tabriz Bazaar, Kaboud mosque, and Jamee mosque of Tabriz, Arg of Tabriz, Tabriz Municipality Palace, and so forth. This zone has an area of about 388 hectares and its population is 28,700 people. Map 1 shows a map of the study area (Comparative plan of Tabriz, 2011) .

Map 1. Study area (source: author drawing, 2014).
5. Theoretical Framework
5.1. Infill Development
New urbanism movement arises when half of the world’s population is urban, and more than one billion people live in slums (Wyporek, 2000: p. 12) . At this time, the urban population suffers from such problems as the extent and distribution, uncontrolled growth, the dominance of cars and traffic density, ethnic conflict, economic stagnation, physical erosion and environmental pollution, etc. (Grant, 2006, 47: p. 32) .
Over time, the need for the focus on the crises and environmental issues and application of preventive strategies and new approaches to urban development under sustainable urban development that according to the articles of Agenda 21, urban development should only be achieved within the existing urban area and range, attitude to the old districts was considered not only as the past memorial of culture and history but also even better, as the local capital that can meet the present and future needs of the residents. This attitude knows districts with capabilities and potentialities such as infrastructures and in urban areas, including barren or operating lands or with reusable feature that can be the ground for sustainable development. With that in mind, the new projects under “development projects”, sustainable development and the use of available resources, re-urban infill attitude (Urban Infill Redevelopment Plans) was formed in the Western countries from 1995 onwards (Habibi & Maghsoodi, 2002: p. 72) .
Infill development or internal and or endogenous development is a form of urban development that is formed on the abandoned and unusable lands and within the existing texture of cities (Falconer & Frank, 1990: p. 137) .
Urban infill development is development in plots that has not developed during continuous development of the city, and development has not occurred there (RERC, 1982: VI). Figure 1 shows the conceptual of infill development.
5.2. Types of Infill Development
Several variables contribute to the definition of what can be proposed as the definition of a piece of land as an infill land but it seems that the three factors are common in all circumstances and situations:
The first factor is that the definition is limited to the vacant lots or lands which have been less exploited for a long time.
The second factor is concerned with those vacant and with the little use lands that are limited among constructed urban surfaces and thus undeveloped. Some of these surfaces are made because of unsuccessful plans of new urbanism or inadequate segregation of land.

Figure 1. Concept of infill development (source: Mirzaei, 2006: p. 22 ).
The third factor refers to the importance of having urban services and facilities such as water networks systems, sewerage, electricity, and so on in place. However, it should be noted that capacity of infrastructures should not necessarily responsible for the new developments, especially in large scale projects with high density (RSRC, 1982: p. 5) .
5.3. Advantages of Infill Development
1) Reduction in the development pressures in the green areas.
2) Regeneration of urban areas or centers.
3) The increased tax base through value creation in the property or restoration of its value.
4) Allocation of appropriate and efficient use to inappropriate uses or non-use lands.
5) Optimal use of existing infrastructure and facilities (Sendich, 2006: p. 456) .
Figure 2 shows the conceptual picture of infill development in vacant lands.
Despite the advantages and disadvantages for the infill development, this type of development is more challenging than usual developments. According to Figure 3 Stephen Wheeler in an article for the school’s annual report on barriers to the infill development of in San Francisco, mentions the advantages and disadvantages of infill development in some cases include: social, financial, ownership, administrative trend, provisions and legislations.
5.4. Materials and Methodology
According to the research objectives and components, the study is applied research and methodologically descriptive-analytic. Data needed for the study was collected and processed by library research and field research. First, the required information was prepared from various documents and field studies and then the maps for each indicator were prepared by ArcGIS software. The indicators were weighted in order to determine final capacity of development and effect of each indicator using ANP approach and finally each indicator was applied and combined into ArcGIS software. The network structure for decision was created to weight the indicator. The process of weighting of the indicators was performed by Super Decision software. After the weights of each indicator was determined, weights acquired in ArcGIS software entered data layers and then maps were consolidated by the Spatial Analyst, and ultimately the final map of infill development capacities was obtained in Zone 8 of Tabriz. Figure 4 shows different phases of the study in the chart, including Collection of data, Determination of indicators, Preparation of maps, Determination of the experts, Using of ANP method, at least Analyzing

Figure 2. Internal development and need to fill vacant textures in the city (source: Parizadi, 2012: p. 9 ).

Figure 3. Disadvantages and challenges facing the infill development, Source: Wheeler, 2001 (13).

Figure 4. Different phases of the study (source: author drawing, 2014).
of ANP & GIS and combination of information.
5.5. Analysis Network Process Approach (ANP)
ANP stands for Analytical Network Process meaning the network analysis process. ANP is another technique for decision-making process that is very similar to the AHP approach.
AHP method was introduced by Thomas L. Saati in 1975 that was designed with the aim of selecting the appropriate option based on multiple criteria. Moreover, this technique was used to weight the criteria and sub criteria. Binary comparisons technique was used to determine the weights of criteria in the hierarchical analysis process.
Analytical network analysis was proposed by Saati and Takizava in 1986. ANP approach is the extension to AHP approach. In cases where lower levels affect the upper levels or the elements in the same level are not independent of each other, the AHP approach can no longer be used. ANP technique is a more general form of AHP but does not require hierarchical structure and therefore shows more complex relations between different levels of decision as network and considers interactions and feedbacks between the criteria and alternatives.
Figure 5 shows different phases of the algorithm of ANP process in chart.
5.6. Analysis of Indicators in the Infill Development
In order to analyze the infill development, those effective indicators in this area are used. If the indicators are applied systematically and with scientific methods provide the ground for redevelopment of urban textures and prevent the horizontal uncontrolled spread.
5.7. Empty and Barren Land Index
In order to analyze the development of the increase, are effective indicators in this case, are used. Indicators that the application of scientific principles and methods underlying the causes of urban redevelopment tissue and prevents the spread of horizontal will be the indiscriminate.
5.8. The Vacant and Barren Land Indicator
One of the first factors considered in the infill development is the vacant lands, which is considered as the amount of open space. Vacant land is one of the most important potentials that is discussed in the development

Figure 5. The algorithm of network analysis process (source: author drawing, 2014).
as well as analysis of development capacity. In fact, this factor is regarded because it is closer to the extensibility compared to other factors. Map 2 shows that 25 hectares of vacant and barren lands in Zone 8 of Tabriz, that accounts for 7.74% of the total area in comparison with the total area of the zone that is 313 hectares.
5.9. The Buildings Antiquity Index
The study of the antiquity of buildings is another indicator in the infill development. According to Table 1, in this indicator, the buildings have been classified into 4 groups of new-built, useable, repairable, and destructed. About 7.11% of the buildings are the destructed one, 53.07% can be maintained, and 25.46% is repairable and 14.35% is newly built. In the Map 3, the antiquity of buildings is shown in different colours. The results show that if you have a plan for the infill development, the buildings antiquity indicator will have a major effect as the buildings have capacity to renovate and rebuild.
5.10. Access and Permeability Index
According to the terms of the comparative plan of the issues of access, minimum width of passages is 6 meters to determine the permeability of districts. Passages with less than 6 meters create inefficient and useless roadway traffic, especially when the risk of damage exists; adjacent structures are easily blocked and make it difficult to communicate the rescuers to the texture. To analyze the capacity of the index, the blocks are classified according to the conditions and quality of access to the lots. Areas that are available in good condition have low development (blue colour in Map 4) capacity and zones that are not in good condition in terms of access have the greater development (brown colour in Map 4).
5.11. Index of the Lots Size (Compression and Granularity)
Infill development has been always trying to find ideal range for the size of the plot area and provided many proposals in this regard according to the type of housing. These recommendations have changed over time and are more completed. The proper size for the single-family homes is 275 meters and 175 meters for the apartment type (Greenbelt Alliance 2008: p. 29) . Granularity is one of the issues that create many of the problems from different urban views. The size of the lots must be considered in order to classify the capacity development for the intended index so that if the parts have lower area, it will be prone to redevelopment. The first category (high development capacity): lots below 120 meter (about 47%) on Table 2. The second category (moderate development capacity): between 120 to 200 meters (about 10%). The third category (low capacity development): lands above 200 meters (about43%) of lands.
Results of granularity index shows that almost half of the texture of the zone is located within the redevelopment area. According to Table 2, Since Zone 8 is a traditional texture of Tabriz, it has lots less than 200 meters. What is noteworthy is that the Tabriz Bazaar that is located in Zone 8 is considered as granular texture due to its coverage and division into smaller unit. Map 5 shows granularity and development capacity for infill development

Map 2. The spatial distribution of vacant land (source: author drawing, 2014).
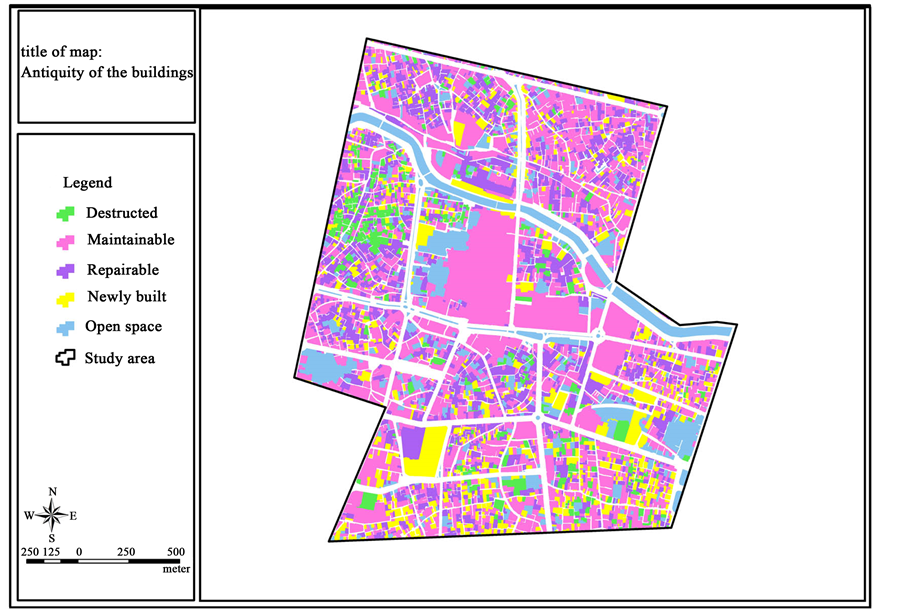
Map 3. The antiquity of buildings (source: author drawing, 2014).
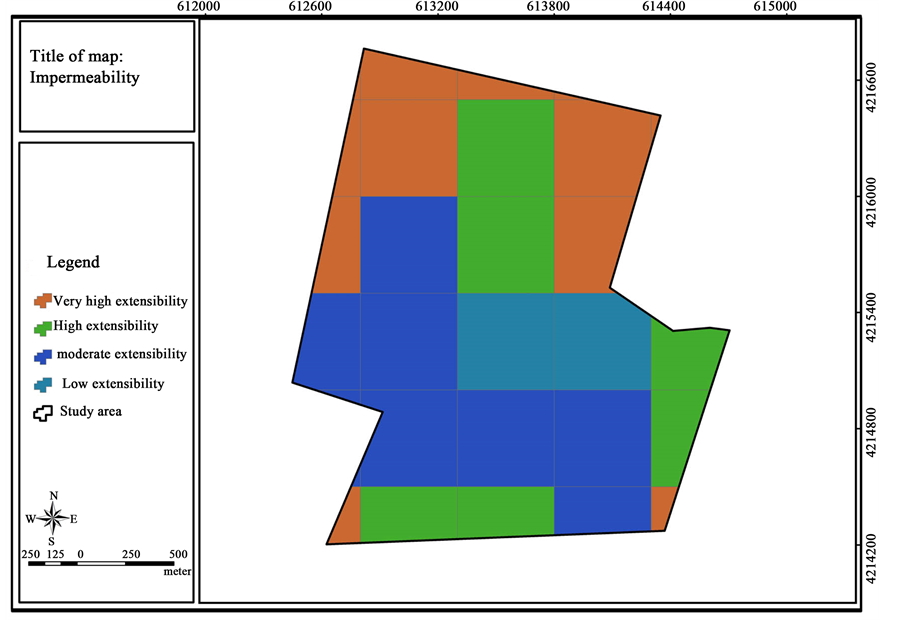
Map 4. Classification of the development capacity of impermeability index (source: author drawing, 2014).
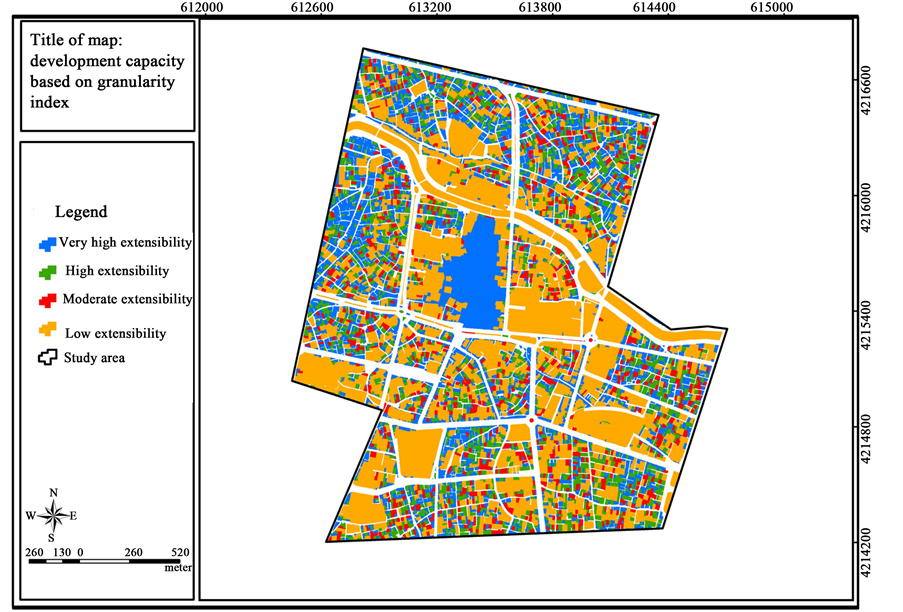
Map 5. Classification of development capacity of the granularity index (source: author drawing, 2014).

Table 1. Classification of capacity development of the buildings antiquity indicator.
Source: author calculating, 2014.
Table 2. Level of the granularity index.
Source: author calculating, 2014.
in different colours.
5.12. The Index of Buildings Storeys
According to Table 3 and Map 6 all buildings of Zone 8 of Tabriz have been constructed as follows: 82.44% are two-storey that shown on map (Turquoise colour) and less, 15% are 3 - 4 storeys (violet colour) on map, 2.19% are 5 - 6 storeys (yellow colour) on map and 0.37% higher than 6 storeys (navy blue colour) on map. Considering the index of the number of storeys, it can be said that the study area has the capacity to have more storeys. Zone 8 has an almost old texture and now it has not the capacity to have greater storeys. Therefore, the texture should be organized and suitable conditions will be provided for development in a case of implementation of the plan.
5.13. Index of Building Skeleton
Materials used in the construction are one of the important issues that should be considered for the infill development. In the case of unstable materials, organization of a plan should be considered and redevelop. Equipping the building with durable materials reduces the effects of natural hazards greatly and guarantees the strength of the building. To analyze the development capacity of the skeleton index of buildings, buildings of reinforced concrete materials are constructed in the storey of low capacity development, metal skeletons in the storey of moderate capacity development, and composite materials such as adobe, brick, and wood in the storey of high capacity development. Map 7 shows the capacity of extensibility based on the materials index. According to Table 4 materials include: Brick and iron has high development capacity by 33.34%, Concrete skeleton has low development capacity by 7.89%, Metal skeleton and Cement block have moderate development capacity by about 42.81% and Composite and Sun-dried brick and wood have very high development capacity by 15.96% of all construct in material.
5.14. The Formation of the Decision Network
In order to model in the ANP approach, the network diagram is first formed and the indicators would be arranged together for obtaining the final score. Then, the relationship between the indexes was specified and matrices for each relationship were created for the binary comparison. Saati’s numbers 1 to 9 have been used to give weight to each index, and experts and specialists rated them. First, scorecards were prepared and then each person was asked to rate each index as a binary comparison in 3 days. Of course, before scoring, the participants were trained in detail how to complete the scorecard. Finally, the mean scores obtained were included in ANP
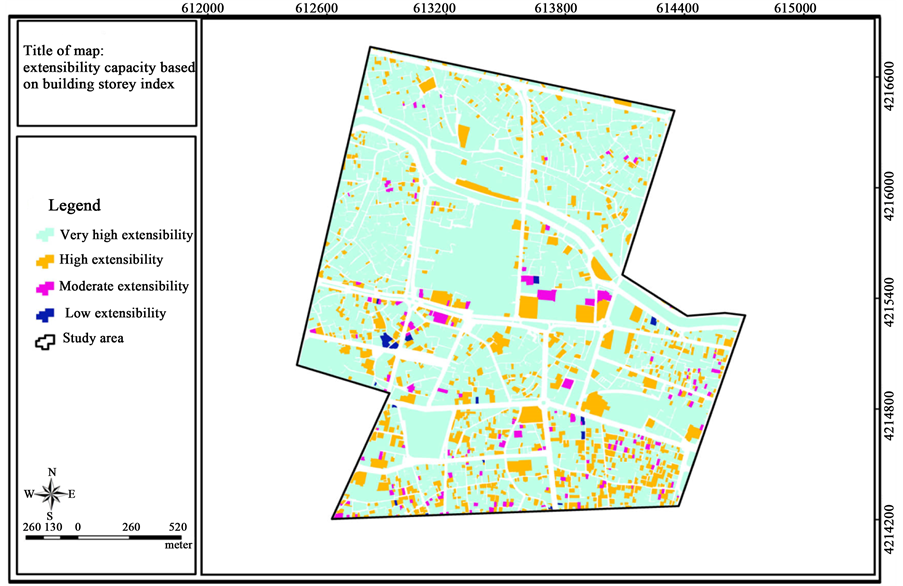
Map 6. The classification of development capacity of the stroreys index. Source: author drawing, 2014.
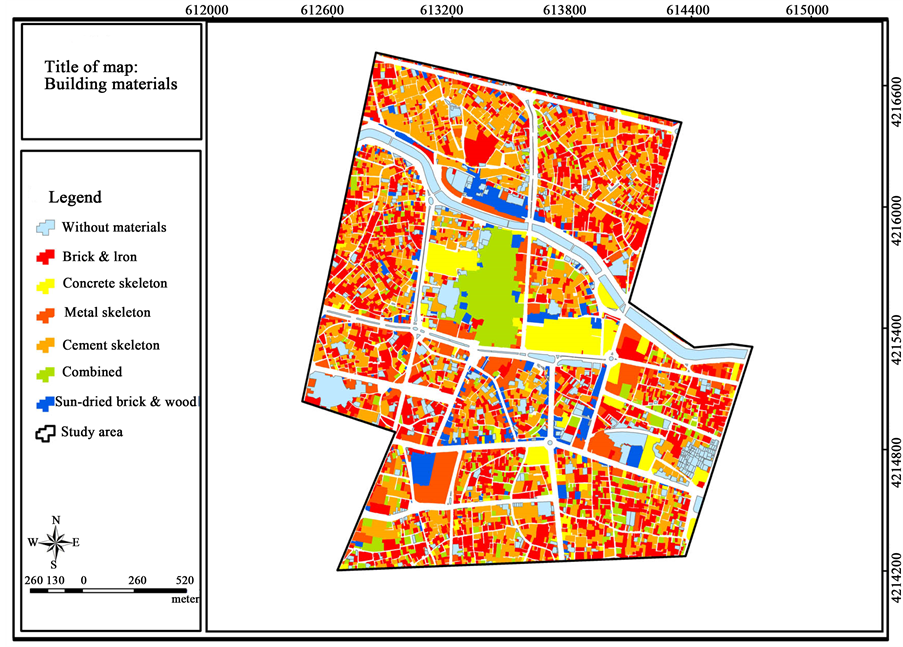
Map 7. Classification of the development capacity of the materials index. Source: author drawing, 2014.
Table 3. Level of each storey of the storeys index.
Source: author calculating, 2014.
Table 4. Level of each storey of the materials index.
Source: author calculating, 2014.
model and final score was obtained by for super Decision software. Table 5 shows the number of experts. the Municipality workers are 10 person and the experts group are 17 person attend in this scoring.
After determining the criteria and forming the decision network, weight of each criterion was obtained by binary comparisons according to the experts’ comments.
As seen in Table 6, the vacant land score is 0.302 that is significantly higher than the other indicators. In fact, most experts believe that vacant lands in the city are suitable for the development and loss of land can be prevented by proper planning. Indicators of the number of storey, granularity and impermeability are at the next categories.
After the weights of each index were determined, the weights obtained in ArcGIS software entered into data layers, then the maps were consolidated by Spatial Analyst, and ultimately the final map of capacities of the infill development in Zone 8 of Tabriz were obtained.
Table 7 shows the result of infill development based on ANP model: About 20% of Zone 8 Tabriz has low and limited extensibility, because of its historical identity and many indexes such as unsuitable material, high storyer and granularity. There is no possibility to development. More than half of this Zone has very high and high extensibility to infill development. Map 8 shows the results with different colours.
6. Conclusion
Preliminary study on the infill development and major issues suggests that although application of the infill development is considered as one of the fundamental strategies to achieve smart growth in every part of the world. It should be noted that its formation and development occurred in the context of social events and successive movements in the West, especially the United States as sustainable development movement, new urbanism and smart growth. Thus, transferring such a development to a country like Iran should be considered with the main purpose of this kind of development; that is, assignment of development to the internal textures of city and its compatibility with the social and management conditions of Iran. Unlike most research in the field of urban development, which knew the lands outside the city suitable for the future development, this research tried to evaluate the lands in Tabriz in order to determine the most suitable interstitial lands for redevelopment. Thus, the network analysis (ANP) approach was used.
Map of the ANP model shows that 38 hectares of the area under study is of very high potential of development that includes 12.14%. The west zone has also some very high potential for the infill development that has features such as heterogeneity and incompatibility of buildings, new and old imbalances in the new and old
Table 5. Members of the raters group.
Table 6. Weight of criteria using the binary comparisons according to the experts’ comments.
Source: author calculating, 2014.
Table 7. Results of the infill development based on the results of network analysis model.
Source: author calculating, 2014.
constructions, unstable and weak materials, narrow passages and relatively low permeability that in fact, all indicators should be studied to develop the infill development in this part of the area under study. The next thing that can be noted that the spatial distribution of high priority to the development of the entire zone 8 Tabriz and 118 hectares, which is 37.70% of the total involved, is to possess. Another point that should be mentioned is that spatial distribution of the high extensibility exists in all areas of Zone 8 of Tabriz that is 118 hectares and accounts for 37.70% of total area. Another point that can be noted is the areas that cannot be used for redevelopment such as the large covered market of Tabriz and other cultural and historical monuments. Considering two very high and high extensibility groups, it can be said that half of the total area within the study area is prone to the internal development which is necessary for the formulation of proper planning on the principles of smart growth and urban sustainable development.
Suggestions
In order to achieve sustainable urban development, in addition to a detailed study of urban textures and identification of potentials and according to the research findings, the following suggestions are made:
1) Prevention of the spread of the city lands to the surrounding lands through wise and proper management of the physical and horizontal expansion using maximum capacity within the textures.
2) The revival of old and destructed buildings and improvements and repair of textures. Thus, it needs less horizontal expansion of cities and the cost of services is reduced significantly.
3) Transfer of annoying and inconsistent uses with historical textures (such as government offices, coal warehouses, industrial workshops and dyeing workshops, coppersmith) in the area to the surroundings of the core center of city.
4) Justification of planners and city managers with a compact city model and provision of the feasibility plan of compression.

Map 8. Ranking the infill development based on the results of network analysis model. (Source: author drawing, 2014).
5) Provision of a ground for the participation of the public sector and the private sector by allocating low interest and long-term credits for urban textures redevelopment.
6) Attraction of participation and encouragement of citizens to use their maximum capacity of the properties under their ownership and granting special facilities to those citizens who wish to take advantage of the redevelopment of their property.
7) Prevention of the destruction of fertile lands for agriculture and protection of the environment by controlling the horizontal expansion of the city.
8) Design and implementation of innovative urban development programs tailored to the potential development of the city with respect to the features of districts, vision and view of city.
9) The need for using the research findings and other similar studies in the area of urban infill development for internal development and redevelopment of urban textures in order to protect historical heritage and monuments and the restoration of districts identity.
Cite this paper
Mohammadtaghi Razavian,Roghayeh Samadi, (2016) Evaluation of Infill Development Potential in Zone 8 of Tabriz by Analysis Network Process Method. Current Urban Studies,04,125-139. doi: 10.4236/cus.2016.42009
References
- 1. A Comparative Plan of Tbriz. (2011).
- 2. Anderson, W. P., Kanaroglou, P. S., & Miller, E.J, (1996). Urban Form, Energy and the Environment: A Review of Issues, Evidence and Policy. Urban Studies, 33, 7-35. http://dx.doi.org/10.1080/00420989650012095
- 3. Falconer & Frank (1990). Sufficiency of Infrastructure Capacity for Infill Development. Journal of Urban Planning and Development, 116, 137-148.
- 4. Grant, J. (2006). Planning the Good Community: New Urbanism in Theory and Practice. Cornwall: Routledge.
- 5. Greenbelt Alliance (2008). Smart Infill. San Francisco. http://www.greenbelt.org/resources/reports/smartinfill/index.html
- 6. Habibi, S. M., & Maghsoudi, M. (2002). Urban Restoration. Tehran: University of Tehran.
- 7. Mirzaei, H. A. (2006). Capacity Building of District Development Based on the Approach of Urban Infill Development (Case Study: Shadabad District in Zone 18 of Tehran). Tehran: Department of Architecture and Urban Planning, University of Science and Technology.
- 8. Parizadi, T. (2012). The Study of the Internal Development with an Emphasis on Housing, a Case Study of Sanandaj. Esfahan: Department of Geography and Urban Planning, Esfahan University.
- 9. Rafieian, M., Barati, N., & Aram, M. (2010). Measurement of the Development Capacity of Useless Spaces in the Center of Qazvin with Emphasis on the Infill Development. Architecture and Urban Planning Letter, 2010, 45.
- 10. RSRC (Real Estate Research Corporation) (1982). Infill Development Strategies, Published Jointly by ULI-Urban Land Institute and American Planning Association, USA.
- 11. Sendich, E. (2006). Planning and Urban Design Standards. Hoboken: American Planning Association, John Willey & Sons.
- 12. Sharifian, E. (2010). Infill Development. Utilization of Internal Capacities of the City. Periodical of Manzar, 10, 50.
- 13. Wheeler, Stephen. M. (2001) Infill Development in the San Francisco Bay Area: Current Obstacles and Responses. November 2001. Paper Presented at the Association of Collegiate Schools of Planning (ACSP) Conference in Cleveland and Published Electronically by HUD’s Regulatory Barriers Clearinghouse.
- 14. Wyporek, B. (2000). ISoCaRP Millennium Report Findings for the Future. The Work of the Congresses of ISoCaRP. Hague: ISoCaRP.
NOTES

*Corresponding author.