Archaeological Discovery
Vol.05 No.01(2017), Article ID:72729,21 pages
10.4236/ad.2017.51001
Scanning Electron Microscopic Characterization and Elemental Analysis of One Hair Located on the Face of the Turin Shroud
Gérard Lucotte1*, Thierry Thomasset2
1Institut d’Anthropologie Moléculaire, Paris, France
2Laboratoire d’Analyse Physico-Chimique, UTC de Compiègne, Compiègne, France

Copyright © 2017 by authors and Scientific Research Publishing Inc.
This work is licensed under the Creative Commons Attribution International License (CC BY 4.0).
http://creativecommons.org/licenses/by/4.0/


Received: September 2, 2016; Accepted: December 11, 2016; Published: December 14, 2016
ABSTRACT
As a contribution to the scientific knowledge of the Turin Shroud, we have studied by SEM-EDX a small hair fragment (14 × 9 μ) contained in a blood stain located in the Face between the two eyebrows. SEM study of this fragment shows the typical human scale hair pattern. EDX analysis of the fragment indicates that it is mainly made of organic matter, plus a little sulphur peak. The hair fragment was at both cut extremities with a razor blade formed of copper. Comparisons with present hairs of different sorts show that the hair fragment is a shaven down-hair. High-resolution SEM analysis of the pattern of residual melanosomes on the hair surface explains the blond-red colour of this hair observed in optical microscopy.
Keywords:
Turin Shroud Face, Hair Examination, SEM-EDX, Hair Scale Pattern, Elemental Analysis

1. Introduction
The Turin Shroud (TS), a well-known Christ’s relic, is an intensively studied object in which a body image is imprinted (e.g. Marion & Lucotte, 2006 ). This body image is not yet explained by modern science.
The frontal image bears apparent blood stains in the areas of the Head (Face and Hairs), Sides, Hands and Feet. The red-brown colour of blood stains was only partially explained (McCrone & Skirius, 1980; Heller & Adler, 1981) . More recently (Lucotte, 2012) I (GL) have studied by SEM (Scanning Electron Microscopy)-EDX (Energy Dispersive X-ray) particles contained in a small sticky-tape triangle corresponding to a blood spot of the Face: only few red blood cells were characterized in the triangle area (Lucotte, 2015c) ; so they do not explain also all the red-brown colour observed of this blood spot.
You know what is the blood stain of the Face under which sticky tape triangle containing particles was applied. Among the numerous triangle particles characterized, only one of them-that is intrinsic to the triangle-corresponds to a little hair fragment. This hair particle is here intensively characterized by optical microscopy and by SEM- EDX analysis.
2. Materials and Methods
The material (Lucotte, 2012) is a small (1.36 mm high, 614 μm wide) sticky-tape triangle (it is the stiky-tape that was applied to the image Face) at the surface of which portions of textile-mainly linen-fibers (Lucotte, 2015a) , pollen grains and spores (Lucotte, 2015b) , red blood cells (Lucotte, 2015c) , and skin debris (Lucotte, 2016) were deposited.
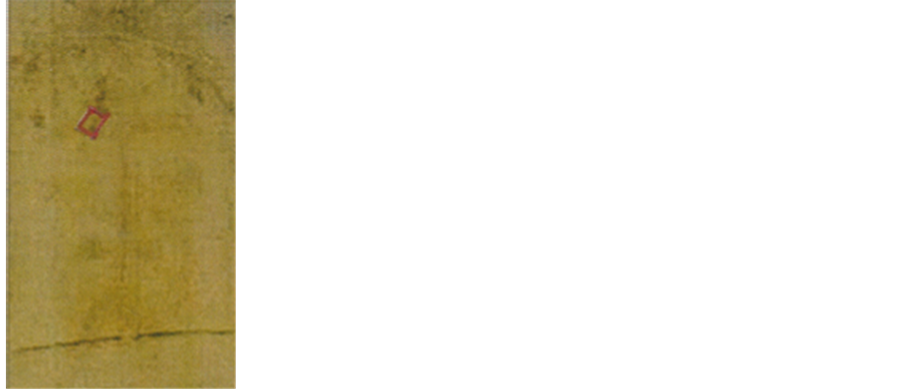
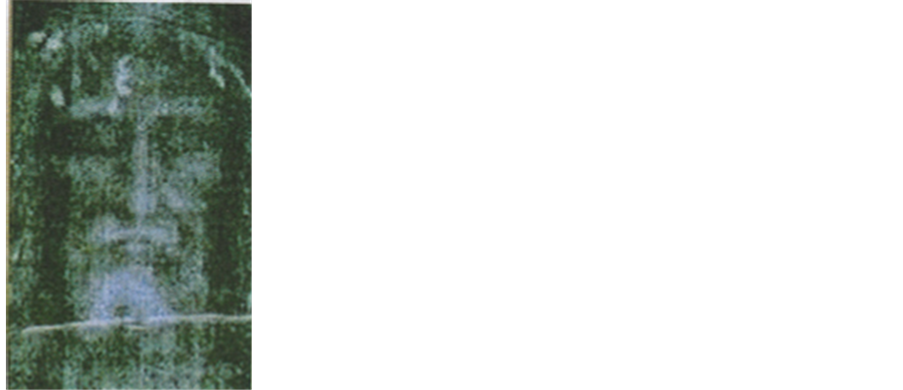
As declared by G. Riggi di Numana (Riggi di Numana, 1988) , who had taken the sample, this sticky-tape triangle is some part of a larger piece he placed directly (during the 1978 official sampling) on the TS surface, at one “blood area” of the Face. He informed one of us (G.L.) that the blood spot concerned (Figure 1) is that located at the right eye brow level, just under the well-known blood spot of omega-form that flows on the front of the Face.
More than 2500 particles, greater than 1 μm = μ, can be observed at the surface of the triangle. For practical reasons, this surface was subdivided into 19 sub-samples areas (A to S), containing almost all the particles observed. The b1 particle, located in the B area, is the hair fragment under study.
The b1 particle-located on the adherent part of the surface of the triangle-was first observed by optical microscopy, without any preparation (using a photomicroscope Zeiss, model III 1972, and by its petrographic version). Two SEM (Scanning Electron
 (a) (b) (c)
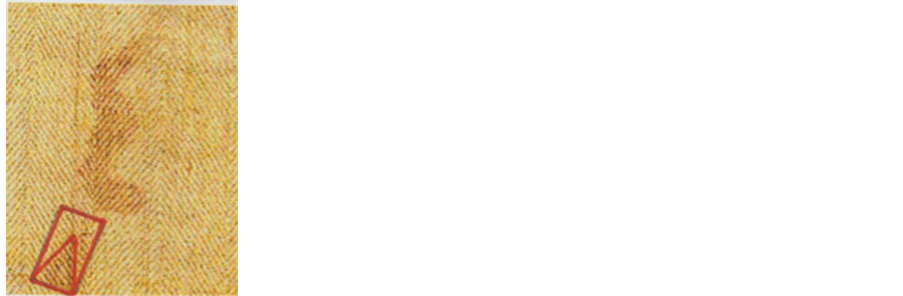
Figure 1.Place of the sticky-tape on the TS surface. (a): Colour photograph of the Face; (b): Photograph of the Face; (c): Enlargement of the blood stains located on the frontal part of the Face. The rectangular sticky-tape contours are drawn in red colour in 1 and 3 (the triangle form was cut in it).
Microscopy) apparatus were used further: 1/A Philips XL30 instrument Environmental Version; GSE (Gaseous Secondary Electrons) and BSE (Black Scattered Electrons) procedures are used , the last one to detect heavy elements. Elemental analysis of the particle and its sub-parts were achieved by using EDX (Energy Dispersive X-ray spectroscopy), this SEM microscope being equipped with a Bruker AXS-EDX (PGT system analysis: Spirit model, of Princeton Gamma Technology). 2/An FEI model Quanta 250 f FEG (probe model X-flash 6/30), both LFD (Large Field Detector) and CBS (Circular Back Scattering) procedures being used. It is with this second apparatus that high- resolution imaging and elemental mapping of the b1 particle were realised.
Each elemental analysis is given in the forms of a spectrum, with kiloelectrons/Volts (ke/V) on the abscissa and elemental peak heights in ordinates.
3. Results
3.1. Location of the b1 Particle
The b1 particle is located at the upper left corner of the B area of the triangle (Figure 2). It is a fragment of one hair. In optical microscopy (800×), it appears as a red, or
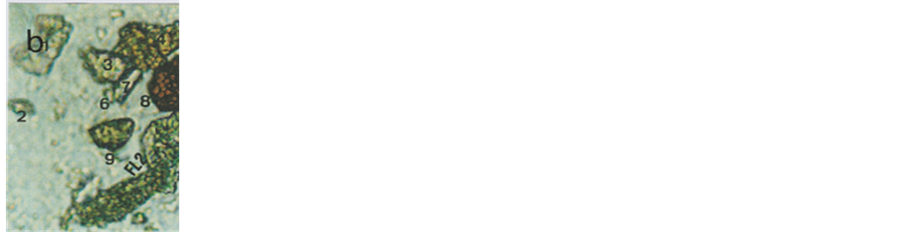
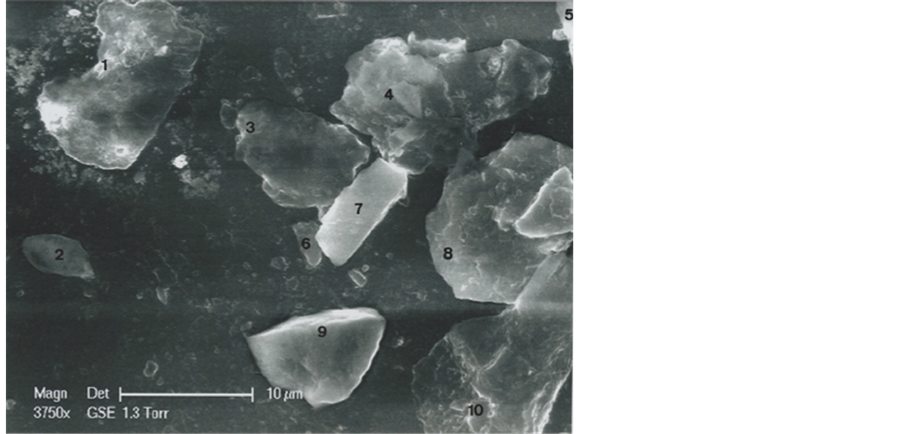
Figure 2. Photographs of the upper left part of the B area of the triangle. Above: Optical microscopy photograph (800×). Below: SEM1 (in GSE) photograph (3750×). Particle b1 is the hair and FL2 is the second portion of linen fiber observed on the triangle. Adjacent particles: 2 (b2 particle); 3 (b3 particle); 4 (b4 particle); 5 (b5 particle); 6 (b6 particle); 7 (b7 particle); 8 (b8 particle); 9 (b9 particle); 10 (b10 particle).
blond-red, hair.
In SEM at higher magnification (3750×) the b1 particle appears as a hair fragment, cut at both extremities.
Adjacent particles of b1 in the B area are b2: a vegetable micro-grain (Lucotte, 2015b) ; b3: a dinophyceae; b4: a phosphorite; b6: a talc; b7: a cylindric silicia; b8: a red clay; b9: a silicia of triangular form; b10: the basis of the second fragment of a linen fiber (Lucotte, 2015a) .
3.2. The b1 Particle Characterisation
The hair structure of the b1 particle appears better in the SEM photograph (7500×) of Figure 3. It is a little hair fragment (covered by various forms of deposits) that appears to be in quasi crystal form, and cut in both ends.
Length of the hair fragment is about 14 μ; its maximal thickness is 9 μ. The left middle border of the cylinder is narrow, at the level of a peculiar microstructure light (in BSE) to electrons.
The spectrum under the photography characterizes elemental analysis of the b1 particle in its central portion (relatively uncovered by deposits). The major peak of the
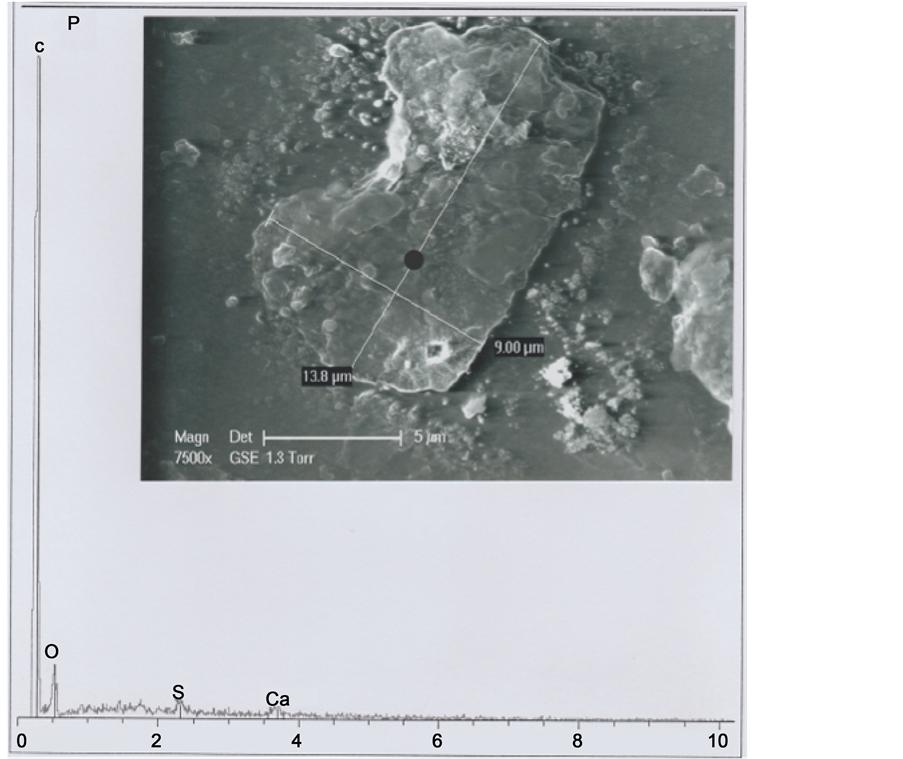
Figure 3. Above: SEM1 (in GSE) photograph (7500×) of the b1 particle (P: “poil”). Below: b1 spectrum at the black point indicated, located in an area appearing devoided in mineral deposits.
spectrum is that of the carbon (C) element; the mean peak is that of oxygen (O); C and O peaks represent the organic portion of the hair. A little peak of the spectrum is that of sulphur (S), corresponding to the keratin of the hair. There is also a little peak of calcium (Ca), corresponding to residual calcium deposit. Table 1 summarizes the percentages of each element seen in the Figure 3 spectrum.
3.3. SEM-EDX Analysis of the Different Parts of the b1 Particle
In order to understand better the various hair parts and their deposits, the b1 particle was subdivided into five portions (Figure 4): part 1 (upper left portion of the particle), part 2 (upper right portion), part 3 (middle portion of the left border), part 4 (lower left portion) and part 5 (lower portion of the hair).
Part 1 was further subdivided into the five sub-parts 1.1, 1.2, 1.3, 1.4 and 1.5 (Figure 5). Sub-part 1.1 is loaded with calcium carbonate (1.1 spectrum). Sub-part 1.2, with a little chlorine (Cl) peak (1.2 spectrum), corresponds to a skin fragment. Both spectra contain copper (Cu) as a trace element. Figure 6 shows elemental analyses for sub-parts

Table 1. Normalized mass of each element of the Figure 3 spectrum.
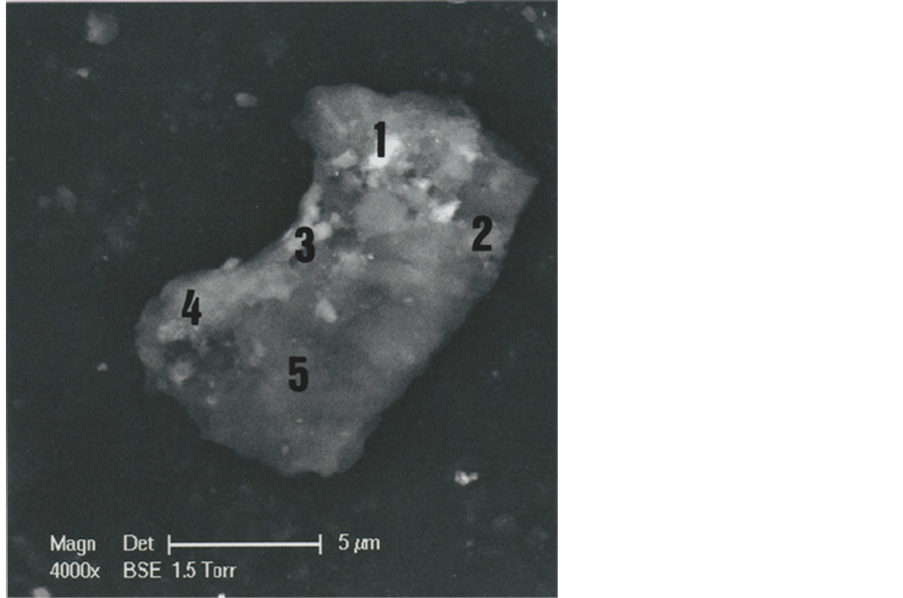
Figure 4. Different parts (1, 2, 3, 4 and 5) of the b1 hair (SEM1 photograph, in BSE, 4000×).
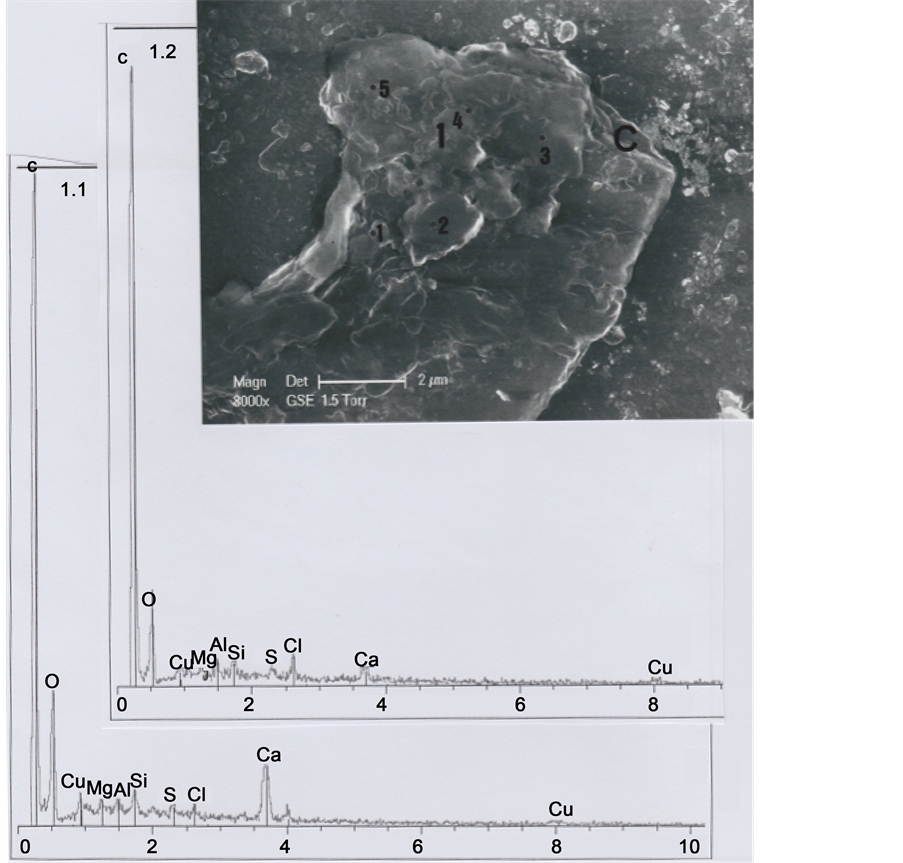
Figure 5. Above. SEM1 photograph (in GSE, 8000×) of the b1 upper part, showing details of part 1 and sub-parts 1.1, 1.2, 1.3, 1.4 and 1.5. C indicates, at the right upper corner, the cut section of the hair. Below: Spectra of sub-parts 1.1 and 1.2 (little black points indicate the locations where elemental analyses were realized).
1.3, 1.4 and 1.5: all the three spectra contain copper (Cu) as a trace element, and spectrum 1.4 contains also traces of iron (Fe); spectrum 1.3 is loaded with calcium carbonate and there are three relatively important peaks of silicium (Si), aluminium (Al) and magnesium (Mg), corresponding to clay deposits. Spectrum 1.4 is also notably loaded with calcium carbonate; Figure 7 shows an enhanced representation of spectrum 1.4, where iron and copper peaks are more visible.
We interpret sub-parts 1.1 to 1.5 as scraps of skin debris, wrenched from the skin after hair cutting, and folded up on the upper left part of the hair. Skin debris concerning 1.1, 1.3 and 1.4 sub-parts are loaded with calcium carbonate deposits, and the 1.3 sub- part with clay deposits. Copper traces correspond to residual metal particles of which the razor blade that cut the hair are constituted. We have observed numerous such micro-particles of copper (sulfate?) at the upper (and the lower) cut parts of the hair.
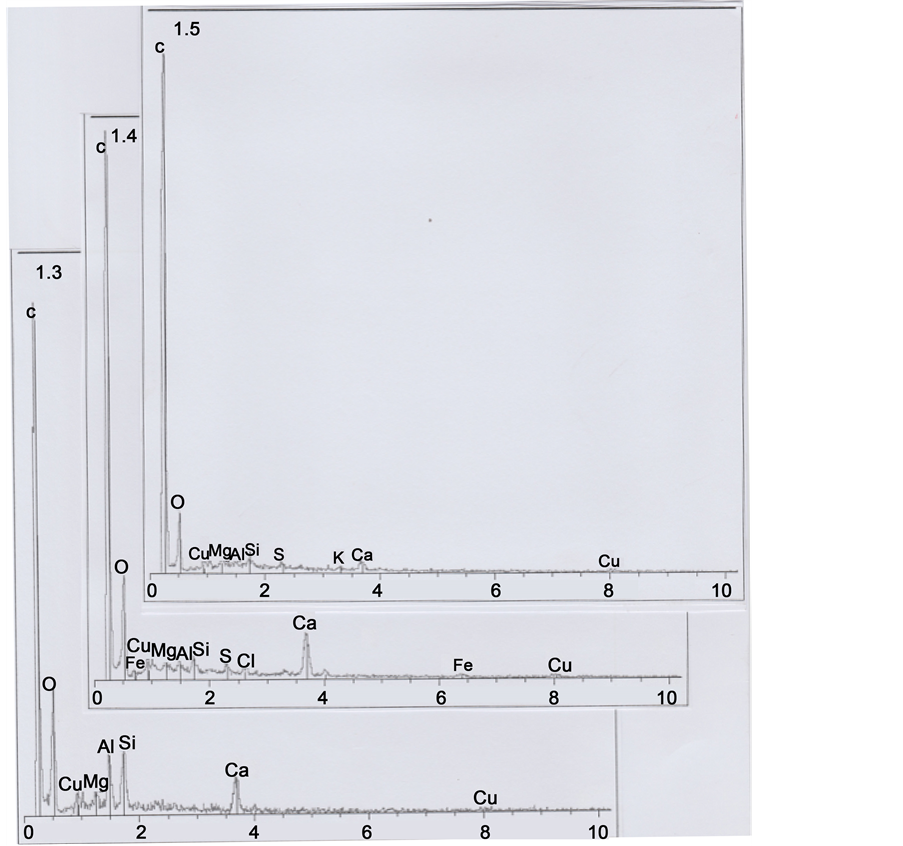
Figure 6. Spectra of sub-parts 1.3, 1.4 and 1.5.
The hair is markedly cut in its upper right part (zone C of the Figure 8 upper photograph). The two Figure 8 photographs show clearly limits of the successively hair scales at the right border of the hair part 2 (four scales-e1 to e4-are so distinguished, separated by narrow zones of coverage between them). The scales thickness between each row are of about 2 μ―that is a low value for human hair scales―and indicates some sort of hair with rapid growth (usual hair growth is about 1 cm/month).
Some features observed (lower Figure 8 photograph, see also photographs of figures 9 and 15)) in the hair part 2 are melanosomes, small micro-grains (of less than 1 μ length) that are located at the right hair border in the zones of coverage between scales e2 and e3 and on the exterior (partially destructed) of the e2 scale part. The observations of such sorts of melanosomes were made possible because of the altered structure of scales (the hair cuticle, containing scales, is probably completely destroyed); so, melanosomes appear on the crests of the hair cortex.
Melanosomes are of two general types: 1), rounded M2, and relatively more voluminous than 2) M1 “en grains de riz”. The Figure 9 schematic representation shows
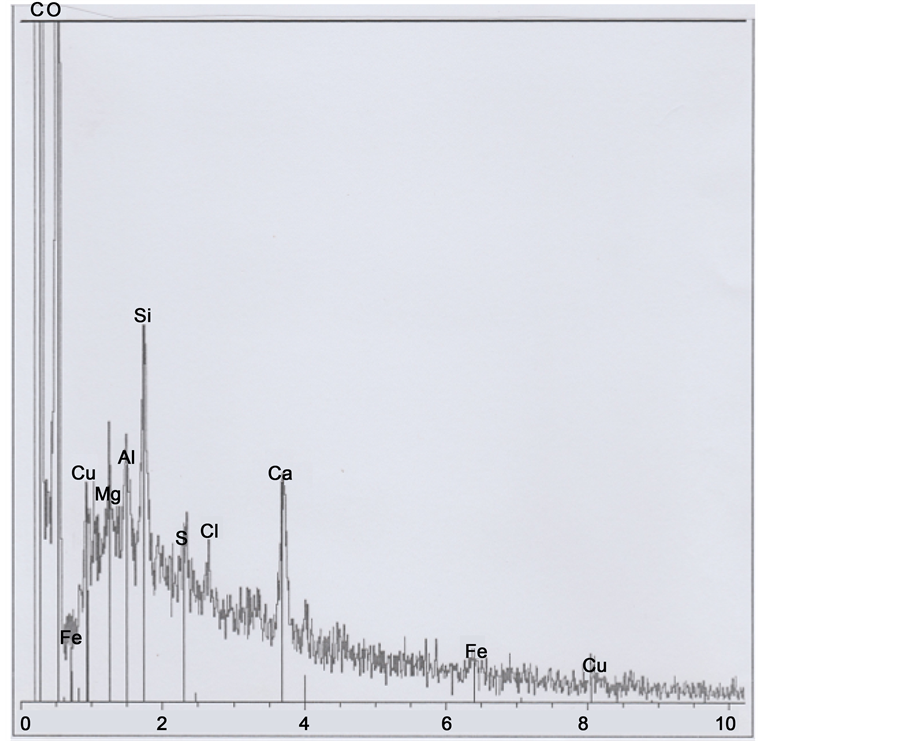
Figure 7. An enhanced representation of spectrum 1.4.
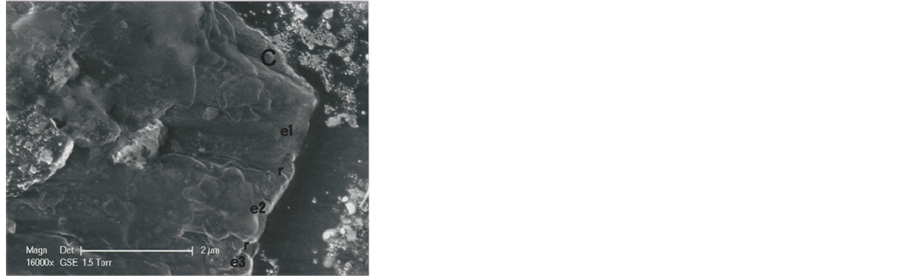
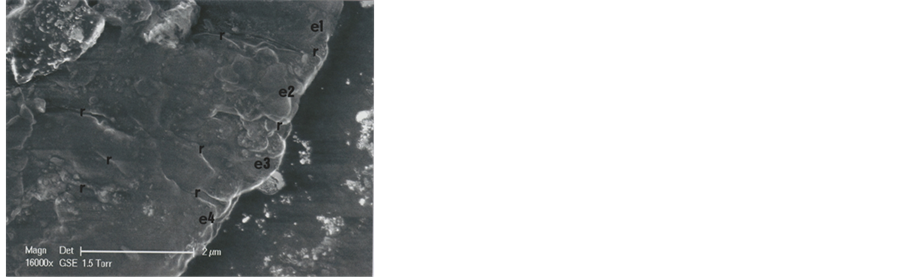
Figure 8. SEM1 photographs (in GSE, 16,000×) of the b1 part 2. Above: Successive scales, located just under the cut section. Below: Shows scales under. C: Cut section of the hair; e1, e2, e3 and e4: Successive scales; r indicates intermediate covered zones between successive scales.
distributions of the two sorts of melanosomes M2 and M1 in the melanosome groups: we count only 4 M1 melanosomes for a total of the 12 (33.3%) melanosomes observed.
The high-resolution SEM2 photography of Figure 10 shows the M2E melanosome, that is located at the hair exterior border (at the e3 scale level). Its spectrum is mainly constituted of organic matter (carbon and oxygen), with a relatively well marked sulphur peak; that corresponds to the usual composition of a melanosome.
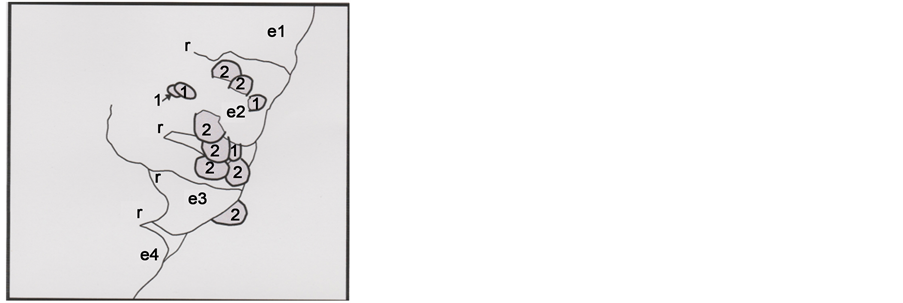
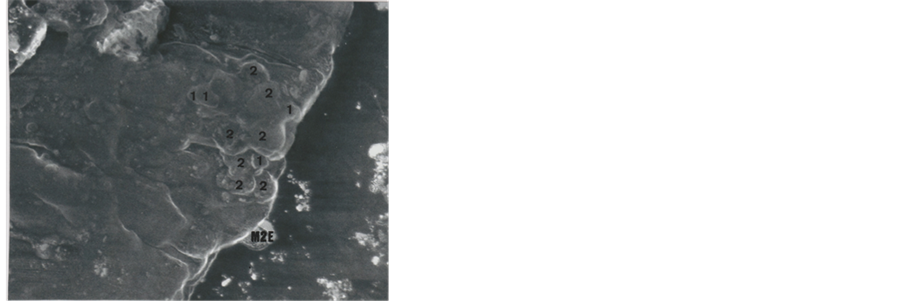
Figure 9. Schematic representation (in the frame of the previous below photograph) of the melanosome distributions in the area concerned; 1 and 2 numbers concern M1 and M2 melanosome types, respectively; M2E is the M2 melanosome located at the hair exterior (the SEM1 photograph showed is the same that the lower Figure 8 photograph).
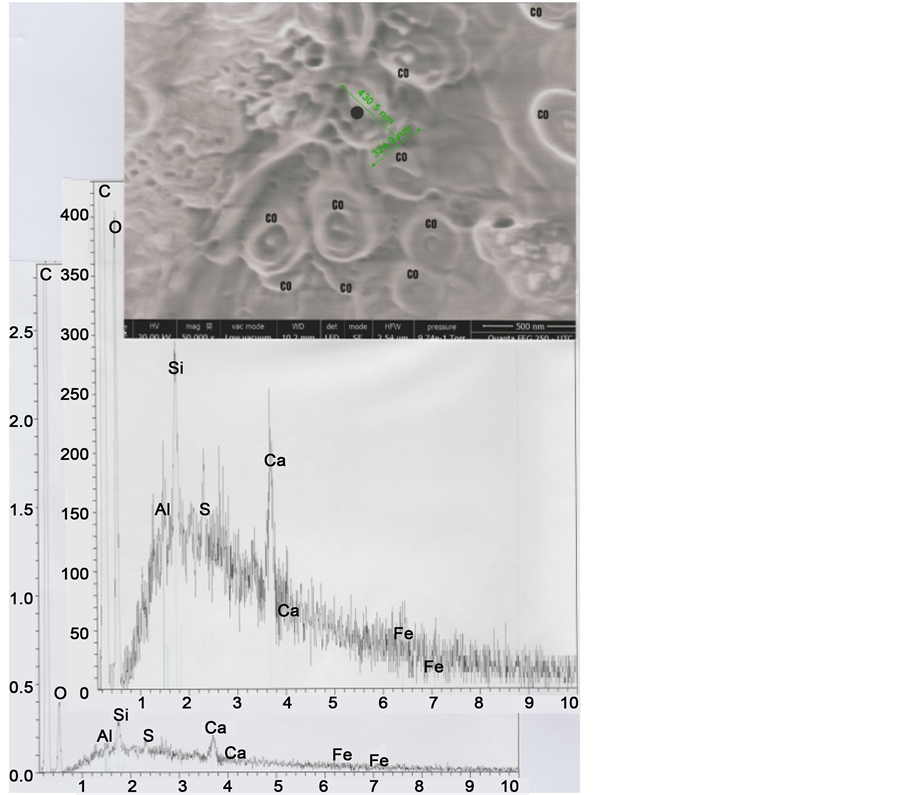
Figure 10. Above: SEM2 (in LFD) photograph (50,000×) centered on the M2E melanosome (0.43 μ on 0.32 μ); CO indicates 10 organic micro-spheres of glue, exterior to the hair, located on the sticky-tape. Below: Spectra (normal below and enhanced above) of the M2E melanosome at the black point indicated.
The relatively low portion―in the zone observed―of melanosomes of the M1 type (melanosomes with eumelanin; dark) compared to that of melanosomes of the M2 type (melanosomes with phaeomelanin; yellow/red) permit us to explain the blond-red colour (see the optical photograph of the Figure 2) of the hair under study.
The Figure 11 photograph shows hair part 3. The below spectrum (a dense calcium carbonate) corresponds to the most whiter particle observed in BSE; the two C particles above had the same elemental compositions. We ignore the role of these particles in the observed curvature of the hair left border.
The two Figure 12 photographs (in GSE and in BSE) show the lower part of the hair. Observations on the GSE photograph of the small limits (L) between scales permits to discern three successive supplementary scales (e5, e6 and e7) on the hair right border.
The Figure 13 photograph shows hair part 4. The below spectrum corresponds mainly to the hair organic matter, plus a little sulphur peak; there is evidence of clay and calcium carbonate deposits (and of copper traces). Observations on the GSE photograph of some limits permits to discern three other successive (altered and deformed) scales (e8, e9 and e10) on the hair left inferior border.
The cut (C) section (Figure 12) at the hair inferior border shows also some copper traces, observed (Figure 13 spectrum) at this level.
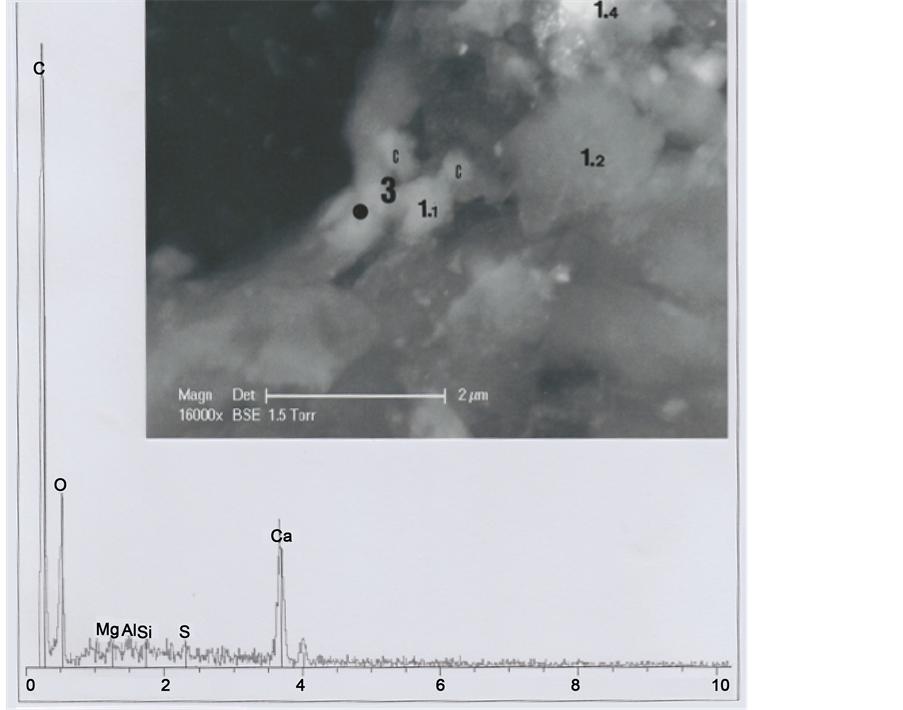
Figure 11. Above: SEM1 photograph (in BSE, 16,000×) of the b1 part 3 (C: Calcium carbonate particles). Below: Spectrum at the black point indicated (1.1, 1.2 and 1.4 indicate the corresponding 1 sub-parts).
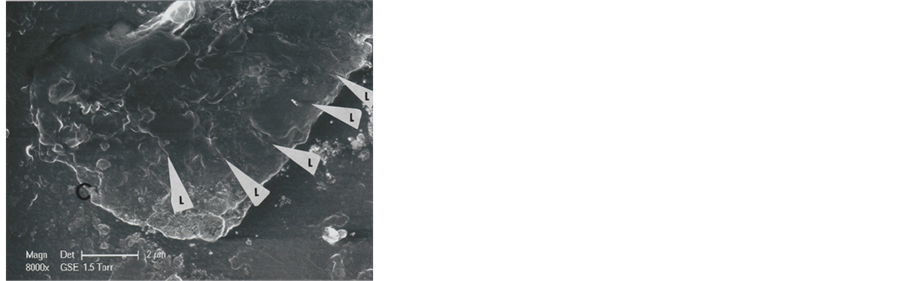
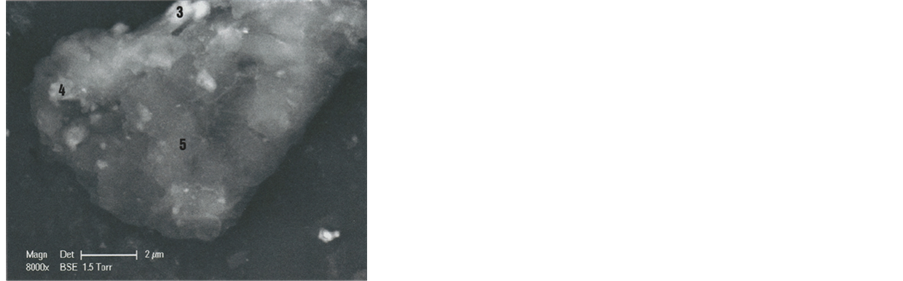
Figure 12. SEM1 photographs (8000×) of the hair lower part (above: In GSE, below: In BSE). On the BSE photograph, numbers 3, 4 and 5 indicate the corresponding hair parts. C indicates, at the left lower corner, the other cut section of the hair.
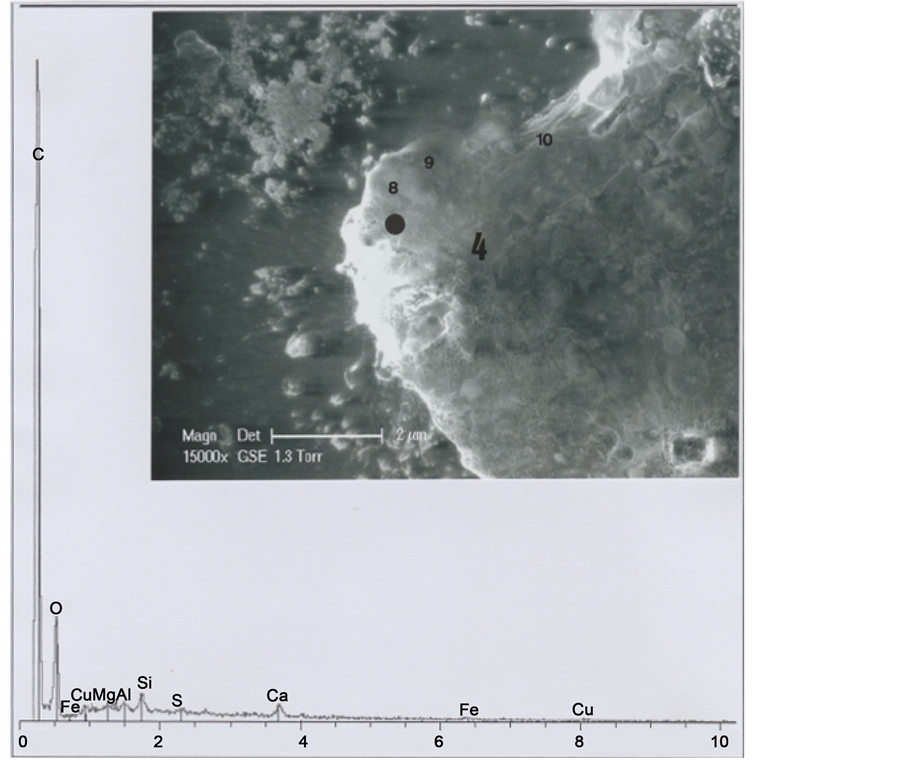
Figure 13. Above: SEM1 photograph (in GSE, 15,000×) of the b1 part 4. Below: Spectrum at the black point indicated (8, 9 and 10 indicate altered scales).
Photograph of Figure 14 shows hair part 5. The below spectra (black points) correspond to sub-areas S, P and CLNA. There is evidence of clay and calcium carbonate deposits in these three sub-areas. The CLNA sub-area is particularly rich in chlorine (Cl) and sodium (Na): that could correspond to the salt of the sweat.

Figure 14. Above: SEM1 photograph (in BSE, 8000×) of the b1 part 5. Below: Spectra S (at the 5 lowest part), P (at the lowest right angle) and CLNA. C: Calcium carbonate sub-particles; CA: Calcite sub-particles; CLNA: Salt.
3.4. High-Resolution Analysis of the Hair
Figure 15 shows two high-resolution SEM2 photographs (power: 20 kV of accelerating voltage; double columns and rows of X-rays scanning to obtain the photograps; acquisition time: 30 min.) of the hair. The two photographs are taken under different angles; this peculiar procedure permit to obtain quasi-relief images of the b1 particle.
On the upper photograph, we can so discern the transversal limits of scales e1-e4, plus those of the e5 scale; e6-e10 limits can be also better distinguished.
We have characterized five C (calcium carbonate) micro-particles adjacent to the hair, and another micro-particle that is titanium (Ti)-rich (titanium, after the iron, is the most commonly observed metallic polutant in samples).
On the lower photograph we can discern three (A, B and C) other melanosome groups, located on the hair surface in the middle longitudinal part. Skin-melanosome groups can also be distinguished under the brushed up skin surface of the 1.2 and 1.5 sub-parts of part 1. Seven calcium carbonate micro-particles, located on the inferior
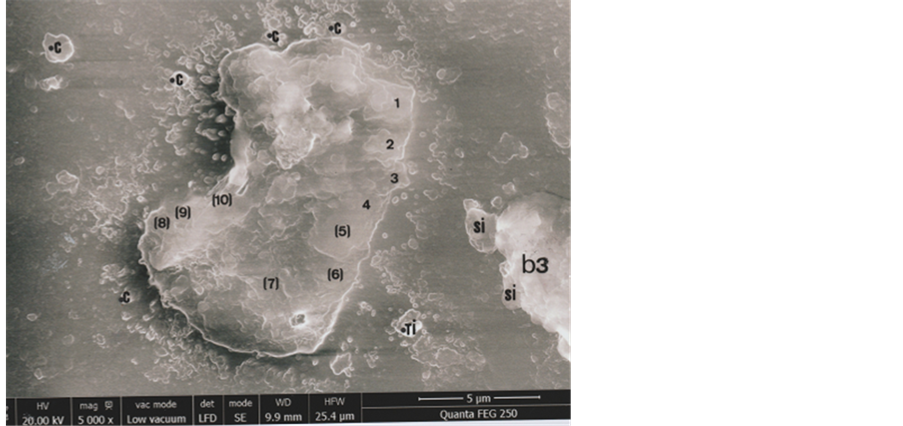
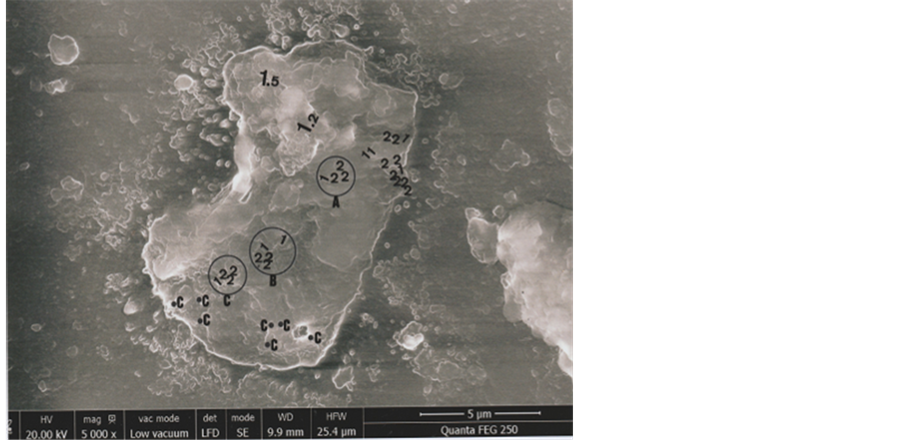
Figure 15. Two high-resolution photographs (SM2, in LFD, 5000×) of the b1 hair. Upper photograph: b3 (the b3 particle); SI (the two silicia sub-particles adjacent to b3). The pointed exterior TI sub-particle is Ti (titanium-rich); pointed C (five exterior-to b1-sub-particles of calcium carbonate). Numbers 1 - 4 indicate scales e1 to e4; other scales (5 - 10) are indicated in parenthesis. Lower photograph: in the hair part 2 (under the upper right corner) is indicated the initial melanosome group (melanosome 1 numbers being orientated in the sense of the “grain de riz” longitudinal axis). The three supplementary A, B and C melanosome groups are encircled. Seven pointed C (or not) sub-particles of calcium carbonate are located on the inferior part 5 of the hair surface. 1.2 and 1.5 indicate the corresponding 1 sub-parts.
part 5 of the hair surface, are also characterized.
3.5. Mapping
Colour photograph of Figure 16 shows the general EDX-mapping (power: 20 kV; distance: 9.9 mm; acquisition time: 15 min.) of the main elements (C, S, Ca, Cu and Fe),
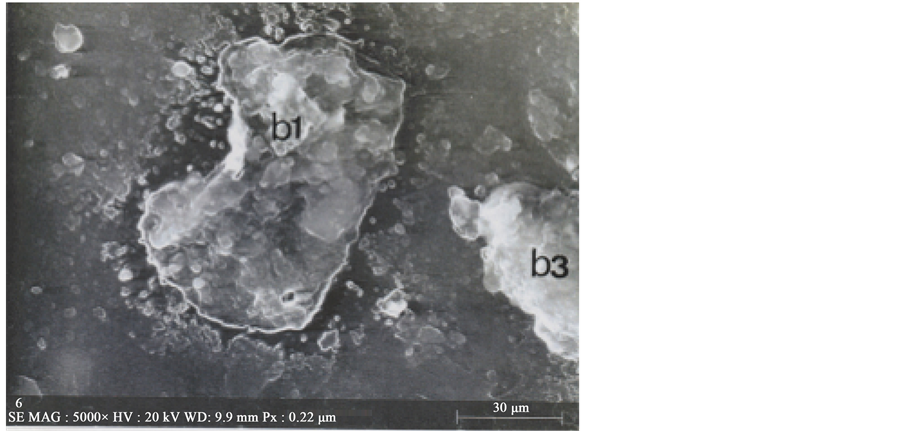
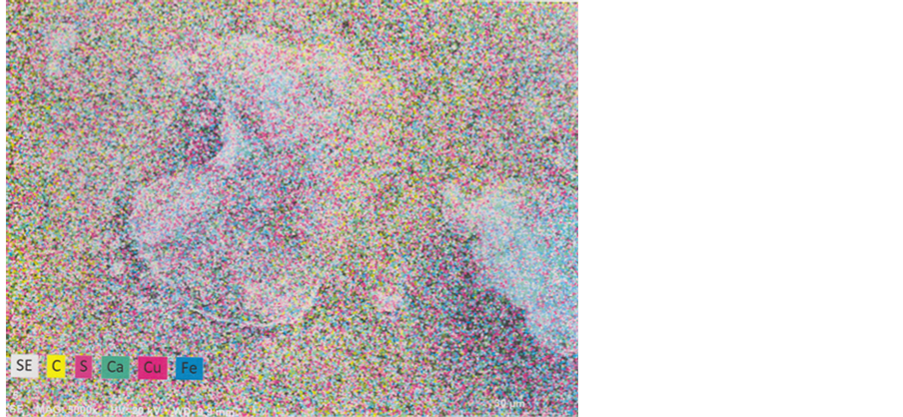
Figure 16. Below: The five main elements (C, S, Ca, Cu and Fe) mapped on b1 and b3 particles. Above: SEM2 photograph (5000×) showing b1 and some part of the b3 particles.
for b1 and some part of the adjacent b3 particle. Separated element mapping (for C, Ca, S, Cu and Fe) are depicted on Figure 17: carbon and calcium distributions are shown for b1 and for the upper part of the b3 particle; for sulphur, we can discern the b1 limits (arrows) on the background; upper and lower b1 cuttings loaded by copper can be distinguished under the form of aligned red points (but no for the blue points for iron, with a too low density).
4. Discussion
Until recently, the optical microscope was considered as the only reliable tool for the identification and comparison of the microscopic characteristics found in the human hair (Deedrick & Koch, 2004) . We have identified here a human hair fragment, that corresponds to the b1 particle located in the B area of the triangle. This hair fragment was investigated by modern techniques of SEM-EDX analysis.
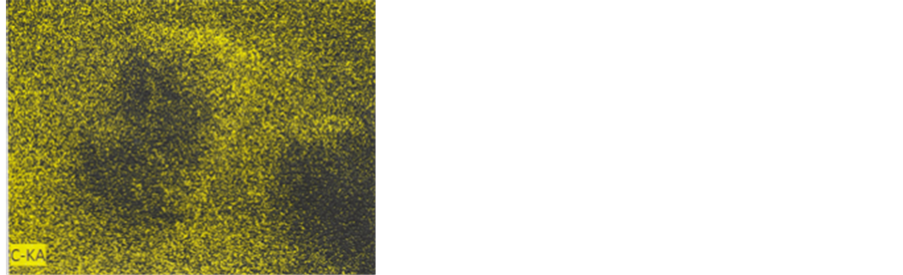
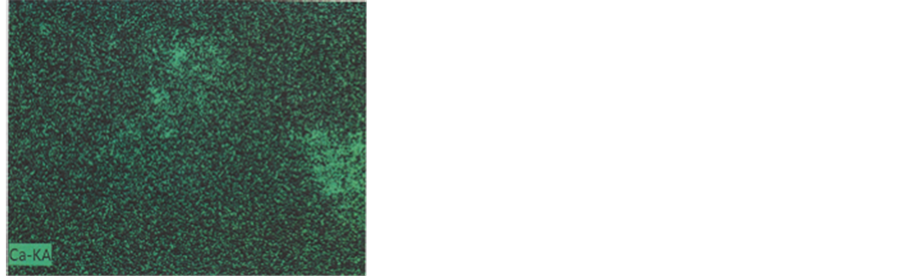
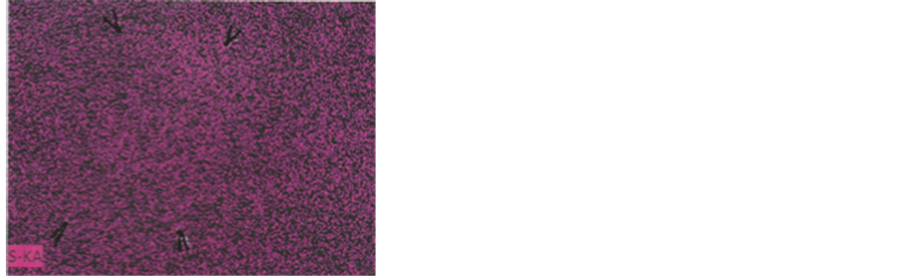

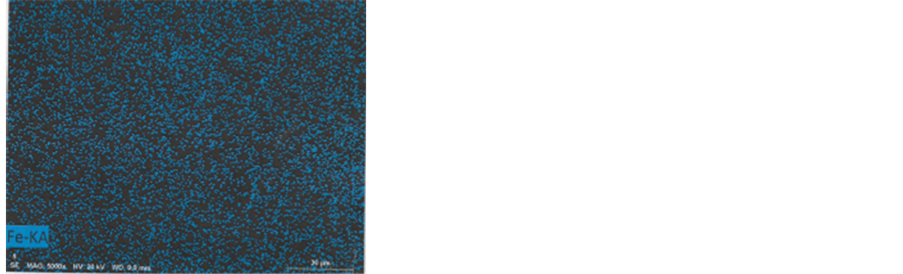
Figure 17. Mapping of the five elements. C and Ca: First row; S: Second row; Cu and Fe: Third row.
This blond-red hair fragment, of cylinder form (see Figure 3), is cut at both extremities. Its maximal thickness is about 9 μ; this diameter, even taking account of some desiccation process during time, is about ten less than that of a human head hair (diameter of the order of 80 μ). The hair fragment length is about 14 μ; if we admit that it is a beard hair, it corresponds to an increase in length during less than a day.
Elemental composition of this hair fragment (see Table 1) shows percentages of about 69% for carbon, 16.5% for oxygen and 3% for sulphur. The lowest percentage of 1.8% for calcium can be attributed to calcium carbonate diluted at the hair surface. Trace elements of chlorine and sodium on one part 5 of the hair surface (see Figure 14) are suspected to represent residual salt of the sweat; silicon, aluminium and magnesium in the same zone correspond to clay deposits.
In the hair, sulphur consists in amino-acids cysteine and the disulphur bridges of the keratin protein. There is evidence in the literature of sulphur percentages of up to 8.5 ± 5.7% in red hairs (Bouillon & Wilkinson, 2005) ; so, with a sulphur percentage of about 3%, this hair fragment sulphur peak is clearly below that seen in current human hairs; as an explanation for such a particularity, we note that it was observed that spectrums of ancient hair remains showed a lower sulphur peak than that of their current counterparts (Mansilla et al., 2011) . Probably sulphur content in the hair decreases with time, depending on the conservation conditions.
Human hair cuticle consists of overlapping scales with narrow margins, that constitutes the imbricate or flattened scales type (Deedrick & Koch, 2004)
We have a clear evidence (see Figure 8) of a clean cutting of the hair at the superior right corner (and also, see Figure 12, at the inferior border). Elemental analyses show copper traces (see Figure 6, Figure 7 and Figure 13) at these both extremities. As it is known that razor blades, since the Roman times, were made of bronze and copper (History of Shaving, 2015) , we suppose that these copper traces reflect the razor blade that had cut the hair.
But these sorts of razor blades cut very badly. At the superior hair border, it had caused some wrenching of the skin surface located at the hair basis. We can effectively observe (see Figure 5) skin debris (Lucotte, 2016) of brushed-up skin residues located at the hair part 1 surface.
Figure 18 shows a schematic reconstitution of the cut hair, with its basis in the right
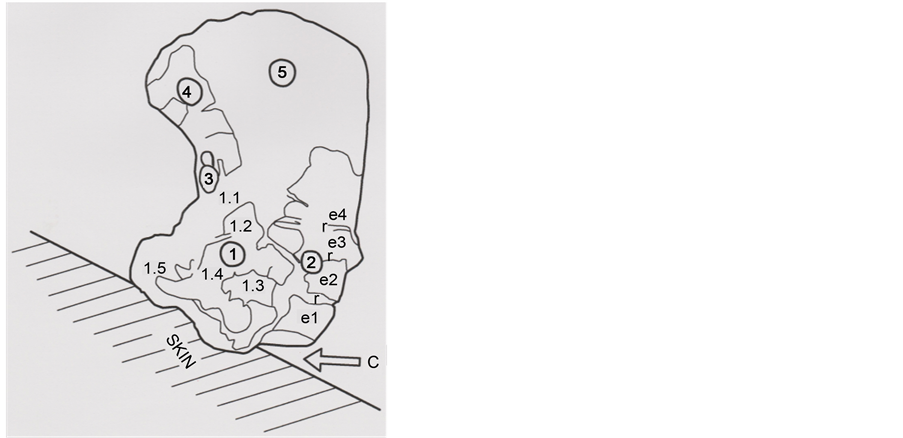
Figure 18. Schematic representation of the hair, in right position on its skin surface. Circled numbers 1 to 5 indicate the hair five parts; e1 to e4 scales show the covered limits (r) of the conserved scales; 1.1; 1.2; 1.3; 1.4 and 1.5: sub-parts of the hair part 1. C (arrow) locates the clean cut section at the right part of the hair basis.
position on the skin surface. The copper razor blade had cut the hair (C: clean cut section) and had caused wrenching of skin debris, located along the left part of the hair basis.
Because of its position, near the right eyebrow of the TS Face (see Figure 1), we suspect that the b1 hair could be an eyebrow fragment. In a comparative approach, we have studied one eyebrow originating from a living subject (an adult Oriental man, aged of thirty years). The photograph of Figure 19 shows that its mean diameter (measured in the eyebrow middle part) is 135 μ; the mean dimension between the successive scale rows is about 5 μ (Figure 20).
As the b1 hair is cut at both extremities, we have compared it to a five-days beard hair of the same subject. Figure 21 shows that its diameter is 142 μ, scale (seen at the inferior beard hair side) spacing being of less than 2 μ. The iron micro-particle located on the beard slice (Figure 22) is probably a fragment of razor blade.
Finally, we compared b1 to a long down hair (located between the two eyebrow hairs) of the same subject. Its diameter at the extremity (Figure 23) is about 13 μ.
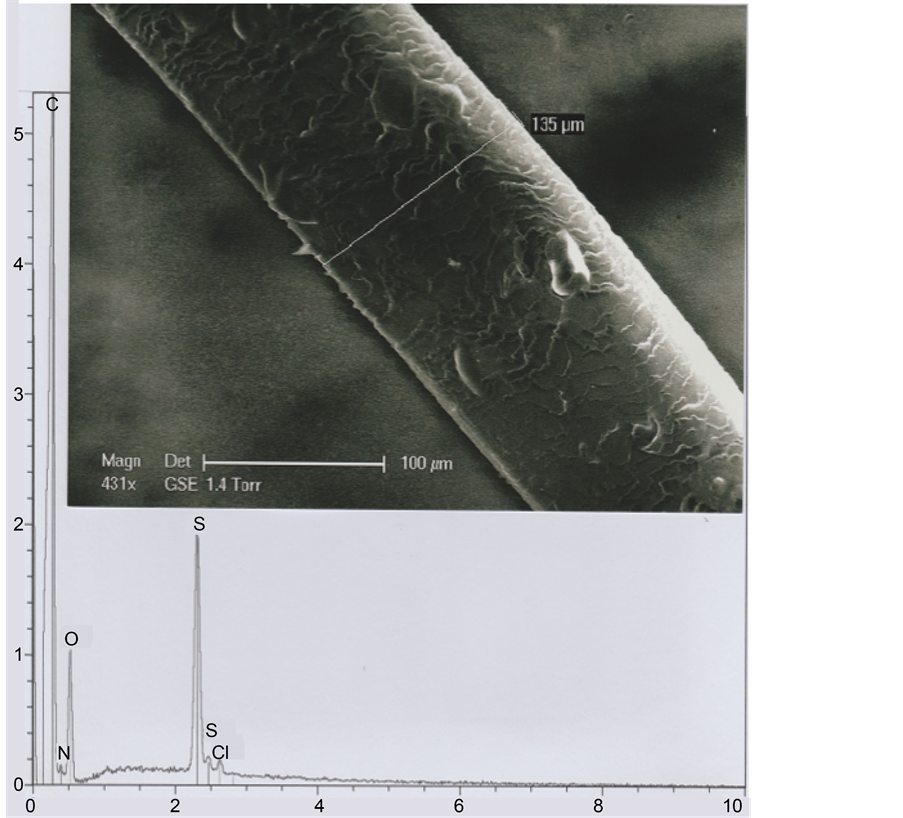
Figure 19. An eyebrow. Above: SEM1 photograph (in GSE, 431×) of an eyebrow segment. Below: The corresponding spectrum.
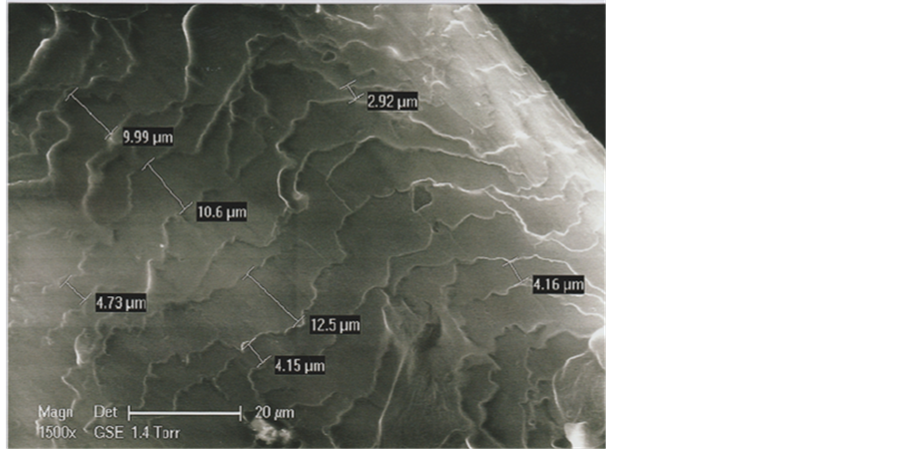
Figure 20. An enlarged view (SEM1, in GSE, 1500×) of some part of this eyebrow.
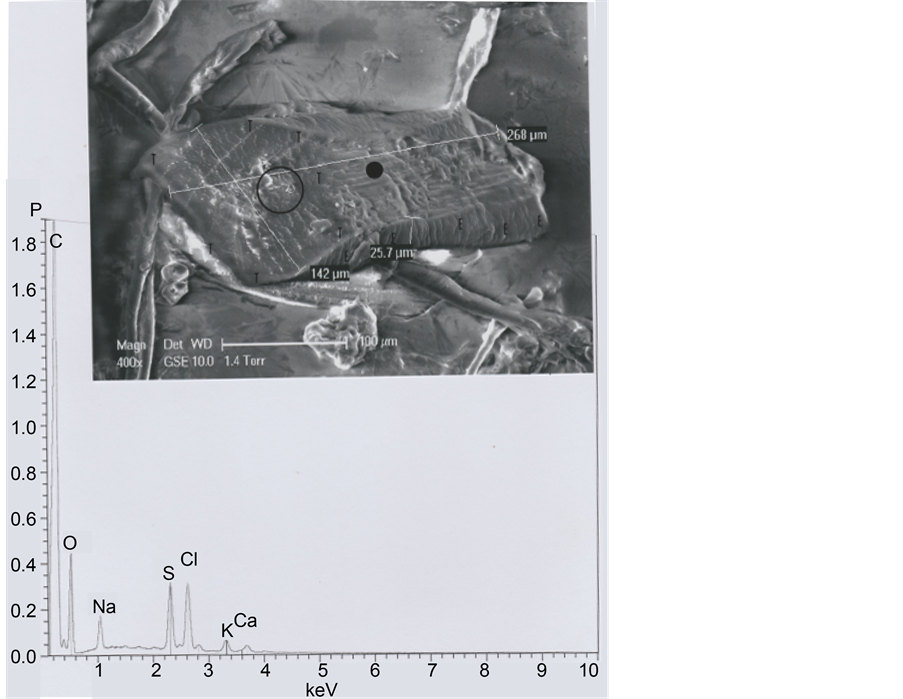
Figure 21. A beard hair. Above: SEM1 photograph (in GSE, 400×) of this beard hair, cut at both extremities. Below: The corresponding spectrum (taken at the black point indicated). E: Scale rows; T: Periphery of the left cut section (the circle indicated corresponds to the surface of the cut section (slice), enlarged in the following photograph).
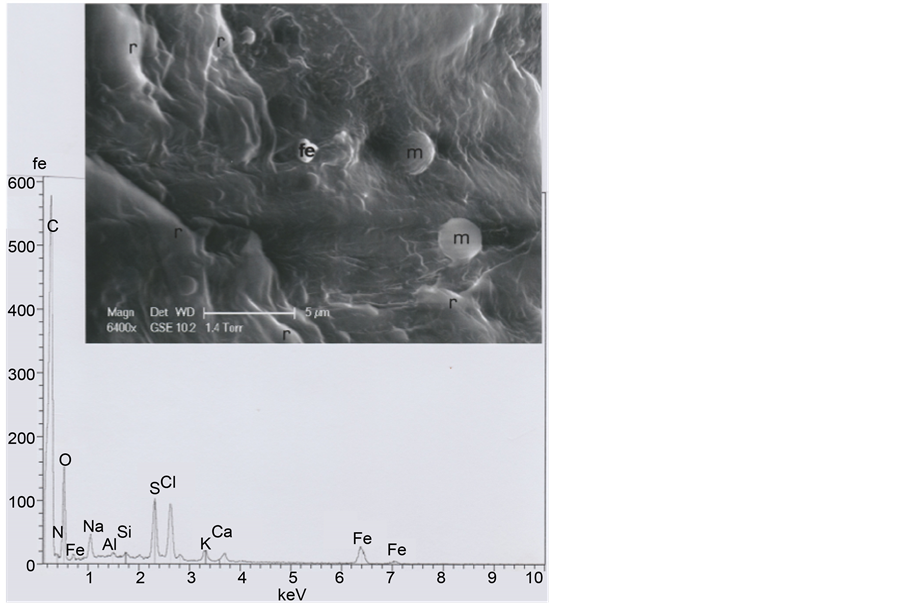
Figure 22. Above: an enlarged (SEM1, in GSE, 6400×) photograph of the circled area of the cut section (r: Folds of keratin; m: Micels of a recent soap (Na,O-rich); Fe: The iron particle). Below: spectrum of the iron particle.
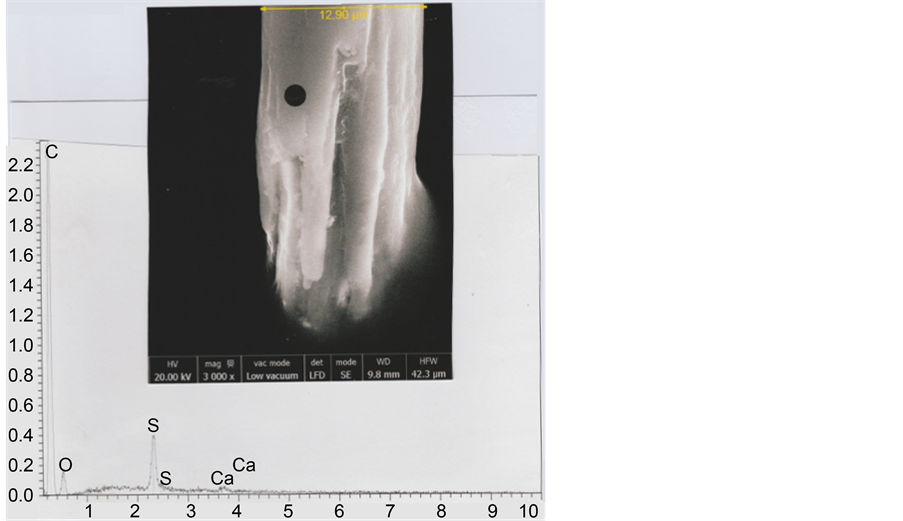
Figure 23. A down hair extremity. Above: SEM2 photograph (in LFD, 3000×) of this down hair extremity, where keratin fibers and crests of the hair cortex terminate. Below: The corresponding spectrum (taken at the black point indicated).
Table 2 compares distinctive characteristics of the four hair specimens. The b1 hair fragment is similar to the down hair for the diameter, and to the beard hair for scales spacing; so we conclude that b1 is a fragment of a down hair regularly shaven.
Melanosomes (Wakamatsu & Ito, 2002) are hair (and skin) organites containing melanin pigments. Table 3 summarizes the global counting of all the detectable melanosomes that we have observed on the b1 hair surface (see Figure 15): for a total number of 25 melanosomes observed, 8 (32%) are of the MS1 (with eumelanin) type, and 17 (68%) are of the MS2 (with phaeomelanin) type; so, there is a proportion of less than one MS1 for two MS2. This approximately double number of melanosomes of red colour compared to that of melanosomes of dark colour is the usual melanosome proportion in red and blond-red hairs (Szabo et al., 1969) . That explains the observed blond-red colour of the b1 particle (see Figure 2).
This not exclude the possibility that, as already signalled for archaeological human and animal hair samples (Wilson, 2001) , the exhibited red colouration of the b1 sample could be also due to photodegradation in sunlight or to oxidation of melanin pigments over millennia.
5. Conclusions
Although our studies were performed to a unique sample, because concerning only one small particle (named b1) located on the Face of the Turin Shroud, our results based on the morphology, elemental analysis and cuticular scale pattern of this b1 particle studied using most advanced investigational methods clearly shows that the particle is a fragment of hair.
We showed also that this hair fragment was cut at both extremities by a razor blade made of copper; comparisons with present hairs of different types show that the hair is
Table 2. Comparison of some characteristics of the different sorts of hairs.
Table 3. Counting of the melanosomes observed.
probably some sort of down hair, regularly shaven, located between the two eyebrows. The distribution and counting of the two melanosome sorts at the hair surface confirm the blond-red colour of this hair observed in optical microscopy.
This study contributes to the knowledge of the pilosity of the Man who was buried in the Shroud, the Christ according to most of the Christians. Interestingly, the Coran depicts the Prophet Jesus of Nazareth as a man with red hairs.
Cite this paper
Lucotte, G., & Thomasset, T. (2017). Scanning Electron Microscopic Characterization and Elemental Analysis of One Hair Located on the Face of the Turin Shroud. Archaeological Discovery, 7, 1-21. http://dx.doi.org/10.4236/ad.2017.51001
References
- 1. Bouillon, C., & Wilkinson, J. (2005). The Science of Hair Care. New York: Taylor and Francis Group.
https://doi.org/10.1201/b14191 [Paper reference 1] - 2. Deedrick, D. W., & Koch, S. L. (2004). Microscopy of the Hair Part 1: A Practical Guide and Manual for Human Hairs. Forensic Science Communications, 6, 1-45. [Paper reference 2]
- 3. Heller, J. H., & Adler, A. D. (1981). A Chemical Investigation of the Shroud of Turin. Canadian Society of Forensic Science Journal, 14, 81-103.
https://doi.org/10.1080/00085030.1981.10756882 [Paper reference 1] - 4. Lucotte, G. (2012). Optical and Chemical Characteristics of the Mineral Particles Found on the Face of the Turin Shroud. Scientific Research and Essays, 7, 2545-2553. [Paper reference 2]
- 5. Lucotte, G. (2015a). Exploration of the Face of the Turin Shroud. Linen Fibers Studied by SEM Analysis. International Journal of the Latest Research in Science and Technology, 4, 78-83. [Paper reference 2]
- 6. Lucotte, G. (2015b). Exploration of the Face of the Turin Shroud. Pollens Studied by SEM Analysis. Archaeological Discovery, 3, 158-178.
https://doi.org/10.4236/ad.2015.34014 [Paper reference 2] - 7. Lucotte, G. (2015c). Red Blood Cells on the Turin Shroud. Jacobs Journal of Hematology, 1, 1-14. [Paper reference 2]
- 8. Lucotte, G. (2016). Skin Debris on the Face of the Turin Shroud: A SEM-EDX Analysis. Archaeological Discovery, 4, 103-117.
https://doi.org/10.4236/ad.2016.42008 [Paper reference 2] - 9. Mansilla, J., Bosch, P., Menéndez, M. T., Pijoan, C., Flores, C., Lòpez, M. C., Lima, E., & Leboreiro, I. (2011). Archaeological and Contemporary Human Hair Composition and Morphology. Chungarà, 43, 293-302.
https://doi.org/10.4067/s0717-73562011000200010 [Paper reference 1] - 10. Marion, A., & Lucotte, G. (2006). Le Linceul de Turin et la Tunique d’Argenteuil. Paris: Presses de la Renaissance. [Paper reference 1]
- 11. McCrone, W. C., & Skirius, C. (1980). Light Microscopial Studies of the Turin Shroud. Microscope, 28, 105-112. [Paper reference 1]
- 12. Modern Gent (2015). History of Shaving. Dover. [Paper reference 1]
- 13. Riggi di Numana, G. (1988). Rapporto Sindone 1978/1987. Milano: 3M Edizioni. [Paper reference 1]
- 14. Szabo, G., Gerald, A. B., Pathak, M. A., & Fitzpatrick, T. B. (1969). Racial Differences in the Fate of Melanosomes in Human Epidermis. Nature, 222, 1081-1082.
https://doi.org/10.1038/2221081a0 [Paper reference 1] - 15. Wakamatsu, K., & Ito, S. (2002). Advanced Chemical Methods in Melanin Determination. Pigment Cell Research, 15, 174-183.
https://doi.org/10.1034/j.1600-0749.2002.02017.x [Paper reference 1] - 16. Wilson, A. S. (2001). Yesterday’s Hair—Human Hair in Archaeology. Biologist, 48, 225-236. [Paper reference 1]