Archaeological Discovery
Vol.2 No.3(2014), Article
ID:47919,13
pages
DOI:10.4236/ad.2014.23006
Archaeo-Geophysical Survey around Itay El-Baroud Area, Nile Delta, Egypt
Hany Shaaban1, Gad El-Qady1,2*, El-Said Al-Sayed1, Ashraf Khozaym1, Ahmed Al-Emam1, Hosni Ghazala3
1National Research Institute of Astronomy and Geophysics, Helwan, Egypt
2Egypt-Japan University of Science and Technology (EJUST), New Borg ElArab, Alexandria, Egypt
3Geology Department, Faculty of Science, Mansoura University, Mansoura, Egypt
Email: *gadosan@yahoo.com
Copyright © 2014 by authors and Scientific Research Publishing Inc.
This work is licensed under the Creative Commons Attribution International License (CC BY).
http://creativecommons.org/licenses/by/4.0/

![]()

Received 15 May 2014; revised 20 June 2014; accepted 2 July 2014
ABSTRACT
Around the Nile Delta branches, the ancient settlements had been created and left their remains to be good witness for the paleoenvironment during the Holocene time. Therefore, tracing of these remains and their associated environments are of great importance. The area of study is located in the central part of the western Nile Delta (west of Rosetta branch), around Itay El-Baroud city. It is located between Latitudes 30˚50'N - 31˚N and Longitudes 30˚35'E - 30˚45'30''E covering an area of about 380 Km². It is mainly covered with cultivated lands and is characterized by its numerous archaeological hills such as Kom Geif. It also includes the Greek trading centre of Naukratis. The city was extinct about the beginning of the third century A.D. The archaeological site of Naukratis is now occupied by Kom Geif village. Integrated geophysical studies including magnetic and multi-frequency electromagnetic methods were conducted at Kom Geif village. The study area is divided into two main sectors sites: A (100 m × 20 m in length) and B (40 m × 40 m in length), respectively in 18 grids. Each gird is 10 m × 20 m and subdivided into a number of parallel traverses with spacing of 0.5 meter. Site A was selected to carry out a detailed electromagnetic survey in E-W direction, 20 zigzag profiles with 100 m length and 1 m interval were carried out. The station intervals along each line were 1 m. Based on the interpretation of the acquired geophysical data, seven structures of possible archaeological interest (mud bricks) have been recognized in a relatively small area at the southern end of Kom Geif Lake. Further detail geophysical studies are important to establish the nature, date, depth and state of preservation of these buried archaeological remains.
Keywords:Geophysics, Nile Delta, Kom Geif, Canopic Branch

1. Introduction
Egypt is known by its deep roots civilization that extends thousands of years through the history of the human being. This civilization has left a huge amount of traces and antiquities. The monuments of Egypt also vary from era to era. They involve Pharaonic, Greek, Roman, Coptic and Islamic traces.
The area of study is located in the central part of the western Nile Delta (west of Rosetta branch), around Itay El-Baroud city (Figure 1). It is located between Latitudes 30˚50'N and 31˚N and Longitudes 30˚35'E and 30˚45'30''E covering an area of about 380 Km². The area of study is mainly covered with cultivated lands and is characterized by its numerous archaeological hills such as Kom Geif and El-Nukrash. Of many geophysical exploration techniques, the electromagnetic (EM) method provides significant advantages for shallow geophysical exploration (Won, 1980). This is mainly a result of their high acquisition speed. Inductive coupling allows data to be collected without the need to have a physical contact between the electromagnetic equipment and the ground (Fitterman & Stewart, 1986).
The New broadband electromagnetic (EM) sensors have been used to detect landfills, unexploded ordnance, buried drums, trench boundaries, contaminant plumes, underground facilities and for other applications (Keiswetter et al., 1997, Keiswetter & Won, 1997; Murray & Keiswetter, 1998, Sternberg & Birken, 1999, Witten & Calvert, 1999; Won et al., 1996, 1997, 1998). In such applications, interpretations is commonly based on analysis of the measured inphase and quadrature parts per million (ppm) components and mapping the apparent conductivity derived from a single component of the EM responses (Won et al., 1996, 1997).
On the other hand, magnetic method has been first used in the 1950s and has since become the backbone of archaeological prospection. It is a fast and effective technique for mapping the distribution of archaeological remains in the shallow subsurface (Clark, 1990, Scollar et al., 1990; Reynolds, 1997). However, magnetic method can be used mainly to detect the archaeological features that contain magnetic minerals. These minerals have been found in the features, made of mud bricks and fired bricks, which constitute the majority of the archaeological remains in the study area.
It becomes a standard tool for delineation of contaminated waste sites and measures variation in electrical conductivity (EC) levels (Nabighian & Macanae, 1991). The output of an EM survey is generally a map, or 3D surface, showing the variation in EC across a site in units of mS/m.
The archaeological record has two basic properties or mechanisms by which it distorts the Earth’s magnetic
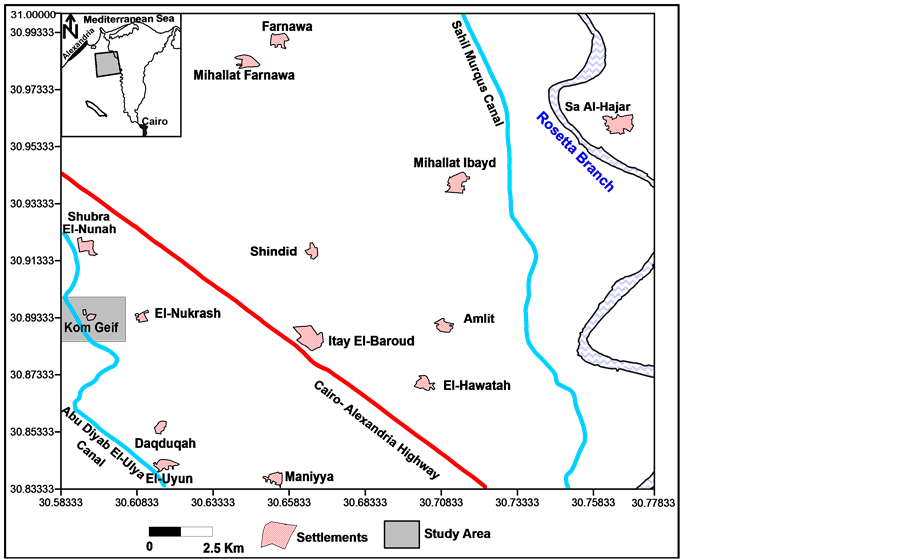
Figure 1. Location map of the study area around Itay El-Baroud area, Nile Delta, Egypt.
field. These are called remnant magnetization (a permanent magnetic effect) and the magnetic susceptibility (a bulk magnetic property similar to density). Both magnetisms are dependent on the presence of iron (iron oxides in soils, sherds, hearths etc.) and both magnetisms alter the magnetic field at the surface of the site. They are thus mapped as distortions of the Earth’s magnetic field (Herwagner et al., 2000).
The contrast in magnetic susceptibility can be observed in the top-soil and sub-soil by using different types of magnetic instruments. Soils compacted by human occupation or disturbed by a burial will also show a variation from background values of magnetic susceptibility.
2. Archaeological Context
Ancient settlements in the Nile Delta are frequently encountered on the high parts of the alluvial plain, away from the danger of the annual Nile flood and close as possible to the flood basins for cultivation and agriculture after they become dry (Van Wesemael, 1988). Human settlements which are indicated by the occurrence of large amounts of sherds are located on the Pleistocene sand mounds (buried Geziras) and Holocene natural levees. These settlements grew gradually due to the accumulation of debris and the construction of new houses on the top of the remains of collapsed ones. In this way the Tells kept their elevation above the alluvial plain. During the annual Nile floods sediments were deposited and the alluvial plain rose steadily and Geziras were partially buried.
The following is a brief account on the archaeological importance of the Greek city at Naukratis; extracted mainly from Coulson and Leonard (1982). About 80km south-east of Alexandria, just off the Cairo-Alexandria highway, are the villages of Kom Geif, El-Nubeira and El-Nukrash, which cover the scattered archaeological site of Naukratis (Figure 1). The settlement, founded at least as early as Dynasty 26 when foreign settlers were granted a monopoly on Aegean trade, later became one of the most important Greek commercial centers, serving the needs of its various communities (Coulson & Leonard, 1982). Naukratis was the principal centre of cultural relations between Greece and Egypt during the late pharaonic era until the founding of the great city of Alexandria. Petrie discovered Naukratis early in his career and excavated parts of this unique site in 1884-1885. When Petrie first visited Naukratis, the area to the south of the site at Kom Geif, consisted of a large mound measuring 400 m by 800 m, then in poor condition but now completely flattened and waterlogged (Figure 2). To the east of this a large temenos wall enclosed the town’s main temple, thought to be dedicated to Amun and Thoth. The enclosure also contained a large platform, at least 15 m high, which may have been used for military or administrative purposes. Trade was regulated by Egyptian law and subject to taxes paid to the Saite pharaohs and seems to have consisted of Mediterranean luxury commodities such as silver and olive oil in exchange for Egyptian corn, linen and papyrus (Coulson & Leonard, 1982). To the northern end of the site were three temples dedicated to Dioscuri, Apollo, Hera, constructed in Hellenistic style and each within their own sacred enclosure, thought to be built during the early 6th century BC (Coulson & Leonard, 1982). Here Petrie found remains of Ionic columns from the Apollo Temple and there are still a few extant remains of the Greek monuments, although now in poor condition (Coulson & Leonard, 1982). To the east of these shrines was a “Hellenium” and a tiny shrine of Aphrodite was found further to the south. Several vessels have been recovered from around the sanctuaries, inscribed with dedications to the town’s Greek deities. Some of these were donated by well-known characters from history, including a fragment of a cup incised with the name of Herodotus himself. The centre of the site contained the main town, with many houses built during the Ptolemaic period.
It was in this area that Petrie found a faience workshop which had produced both Egyptian and Greek objects, including numerous glazed scarabs dating as far back as the reign of Psamtek I. Many silver and bronze Greek coins have been found during excavation of the site, the only coins known from pharaonic Egypt, although probably not generally circulated at that time as most of them appeared to be in mint condition. The most significant finding from Naukratis is the Dynasty 30 stela of Nectanebo I, one of the last truly Egyptian pharaohs. The perfectly preserved carvings on the Naukratis stela (now in Cairo Museum) announce a decree by the king that a tax of one tenth of all goods from Naukratis be paid into his treasury for the benefit of the Temple of Neith at Sais (Coulson & Leonard, 1982).
3. Geophysical Data Acquisition
In the present study, a micro-magnetic survey has been first applied as a rapid and accurate way to detect the archaeological features made of mud bricks and fired bricks which represent the majority of the structures in the
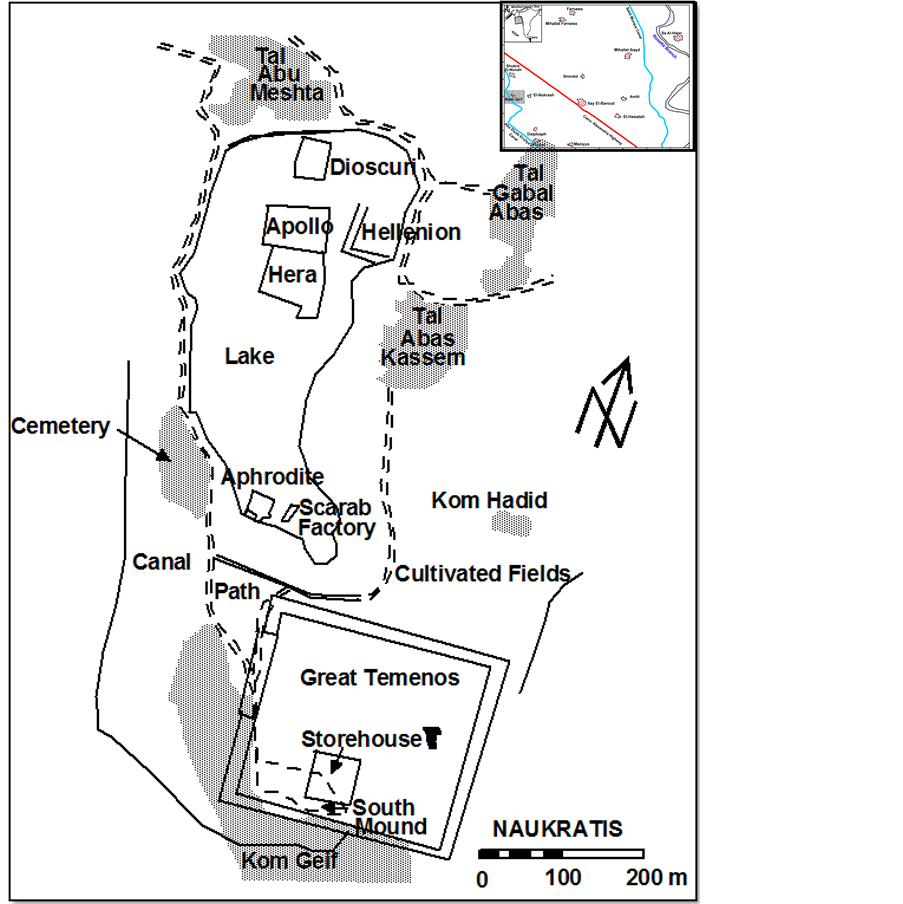
Figure 2. Plan of Naukratis showing the buildings uncovered by the early excavators in relation to the present state of the site (after Coulson & Leonard, 1982).
area of study. The micro magnetic survey was carried out by the fluxgate gradiometer model FM36 through a raster of 0.5 m × 0.5 m. The processing of magnetic data have been achieved by using Geoplot software (Geoscan Research, 1994) and then extracted to Surfer software to be more representative for interpretation. Secondly, multi-frequency electromagnetic method of a selected area had been utilized to support the results of the magnetic survey.
3.1. Magnetic Data Acquisition
Field procedures for the magnetic prospection method have been refined considerably in the last two decades. Some archaeologists now use magnetic gradiometer and microcomputer-controlled automatic data collection systems to make low-noise, high-productivity surveys. It is not unusual for a field crew to acquire as such as a third of a hectare of 1 meter grid data in a single day.
The use of two magnetometers sensors mounted at different heights allows the recording of vertical magnetic gradient in nano-Tesla per meter (nT/m). Such measurements usually reflect the distribution of archaeological remains at relatively shallow depths; can be within few meters. The vertical gradient field is given by:
 (1)
(1)
where F1 and F2 are the reading at the upper and lower sensors, and ∆Z is the separation between the sensors. The vertical magnetic gradient has several interesting properties (Scollar et al., 1990; Herwagner et al., 2000). It filters out the effects of the regional magnetic field, is only weakly influenced by magnetic time variations and better divines shallow magnetic features (Bossuet et al., 2001).
The measurements of the vertical magnetic gradient for the purposes of archaeological investigations has been extensively used in Egypt (Kamei et al., 2002; Abdallatif et al., 2003, 2005; Ghazala et al., 2003; Herbich, 2003; Abbas et al., 2005; Odah et al., 2005; Wilson, 2006).
Prior to the measurements, the study area has been cleaned from any visible surface iron materials and the corners of the surveyed areas are marked with wooden sticks. The micro-magnetic survey was carried out using the fluxgate gradiometer through a raster of 0.5 m × 0.5 m.
A pilot area was selected to investigate the buried remains in the archaeological site of Kom Geif village (Naukratis). The selected area has been extended later according to the obtained results. The area under investigation (Figure 3) is divided into two main sectors; Sites A (100 m × 20 m) and Site B (40 m × 40 m), respect-
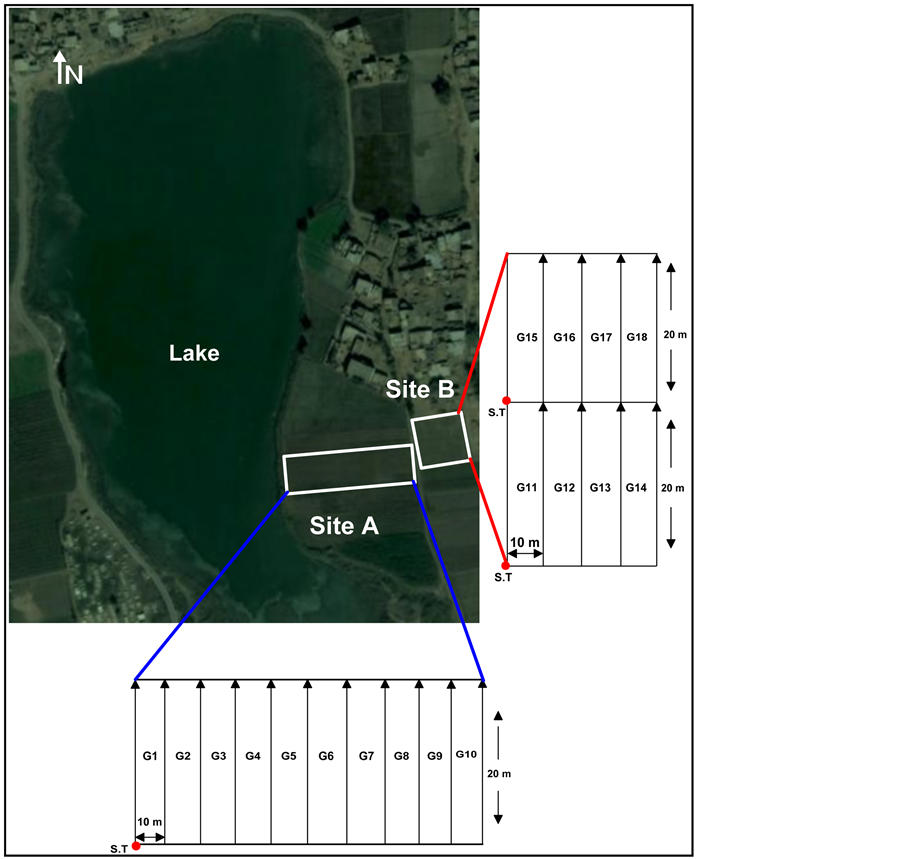
Figure 3. Location map and sketch grid layout of the vertical magnetic gradient survey using the fluxgate gradiometer FM36.
tively in 18 grids. Each gird is 10 m × 20 m and subdivided into a number of parallel traverses with spacing of 0.5 meter. Non-magnetic tapes were used to measure the distances and traverses.
3.2. Multi-Frequency Electromagnetic Technique
Electromagnetic induction survey included conductivity mapping with conductivity meter (GEM-300) (GSSI, 1998). The area (A (100 m × 20 m)) was selected according to the magnetic survey and the availability of places to do the survey can easily be mapped with a conductivity meter. The measurements are done at walking speed and it is suitable to map large areas in a short time. Site A in the magnetic survey (Figure 3) was selected to carry out a detailed electromagnetic survey using GEM-300. The device (GEM-300) is mainly used to record multiple frequency (low, medium and high) electromagnetic induction data. The effective depth of exploration for a given earth medium is determined by the operating frequency of the primary electromagnetic signal. In fact, the lower EM frequencies penetrate deeper than the higher frequencies. Therefore, measuring the areas response to multiple frequencies [low, 750 Hz), medium, (1710 Hz & 3870 Hz) and high, (8790 Hz & 19,950 Hz)] was equivalent to measuring the Earth response from multiple depth levels in terms of the few meters range (deep, intermediate and shallow). This powerful tool allows for more detailed of the subsurface than ever before, and is ideally suited for a wide range of applications.
The EM survey parameters through the surveyed site were designed in a grid pattern which has a dimension of 100 m × 20 m. In E-W direction, 20 zigzag profiles with 100 m length and 1m interval are carried out. The station interval along each line was 1 m.
4. Data Processing and Interpretation
4.1. Magnetic Method
The initial presentation of the obtained raw magnetic data for the two sites is presented in Figure 4. The main objective of data processing is to remove the expected noises and to enhance the archaeological remains responses and make it smoother for presentation and expressive for interpretation.
The handled raw data have been initially presented in shade-plots to find out the main field errors and noises. Many processing functions such as Zero Mean Grid, Zero Mean Traverse, Despike, Low Pass Filter and Clip have been used to remove these errors and to enhance the presentation of the obtained magnetic data. Finally, the obvious features are recognized easily in the sense of archaeological interest.
4.1.1. The Applied Processing Functions
The field errors concerning grids and traverses normally occur with the gradiometer survey due to several reasons such as the sensitivity of the instrument to any vertical movement , repeat measuring of the last points at the former and the later grids, irregularities of the ground surface and instability of the operator (Geoscan Research, 1994).
The acquired raw data have been presented as a grayscale image (Figure 4). The gradient of the vertical component of the geomagnetic field ranges from −220 to +140 nT. At a glance, the resultant magnetic image (Figure 4) exhibits foggy and disturbed with many noises that make it difficult to be interpreted clearly to the comparable archaeological meaning. To remove the field errors and enhance the obtained data, the following processing sequences have been achieved:
• The grid edge discontinuities are treated by the application of Zero Mean Grid (ZMG) with a threshold value = 0.25 standard deviation.
• The stripes between traverses are removed by the application of Zero Mean Traverse (ZMT) with least mean square fit.
• The data are clipped initially for Site A (−5/+5 nT) and for Site B (−10/+10 nT) to remove the high frequencies resulting from any expected surface iron spikes. Also, the Despike function (K) is applied for more enhancement and good presentation.
• A Gaussian Low-Pass Filter (L) is applied to remove the high frequencies as well as to smooth and enhance the weak anomalies of the deep archaeological features. The Low-Pass Filter parameters are set to be X and Y radii = 2.
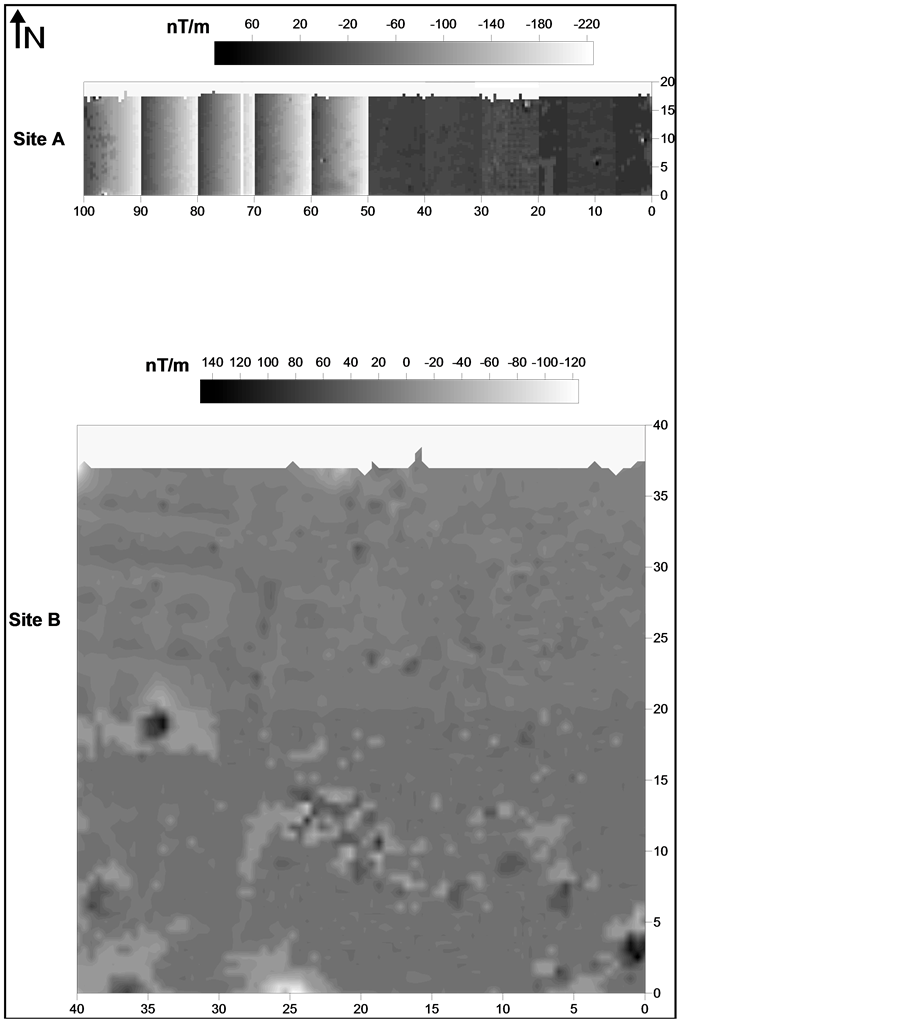
Figure 4. Raw magnetic data of the studied archaeological sites (A and B).
The resultant processed magnetic image is presented in (Figure 5). It is well represented to the expected buried remains at the study area and could be considered as a base for the interpretation process.
4.1.2. Magnetic Data Interpretation
Geophysical data images typically present a two dimensional representation of a complex sequence of archaeological events and natural conditions. Therefore, interpretation of geophysical data must be a cooperative process involving both geophysicists and archaeologists that are familiar with the specific cultural context of the site being studied. The understanding of the geological background and geomorphology are also important and valuable for a complete interpretation of the obtained results.
Interpretation of magnetic anomalies to the comparable monuments is the main target of the previous steps. It
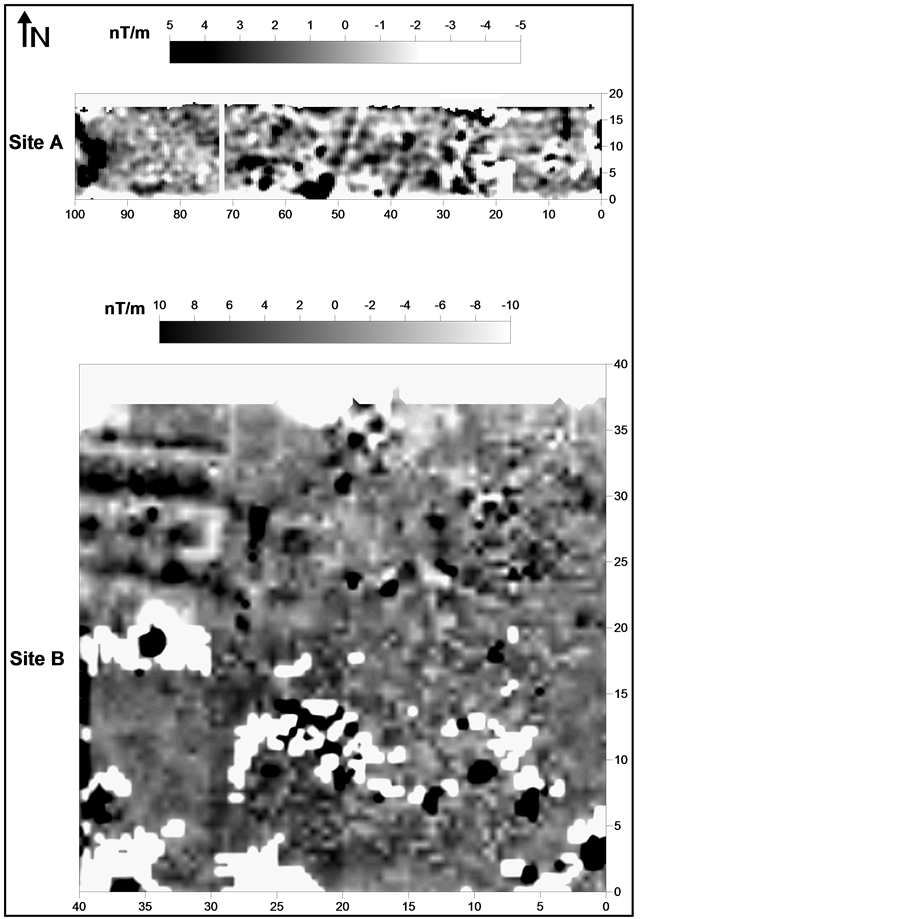
Figure 5. Magnetic image of the studied sites (A and B) after application of the processing functions.
is interesting to know the archaeological findings resulting from the application of magnetic method. However, the interpretation process is not an easy job and needs a lot of experience to differentiate between what is archaeological and what is non-archaeological. The interpretation rules in the present study are based mainly on the clarity of the deduced features, their location, polarities, dimensions, shapes etc.
The dark areas in the processed gray scale magnetic image (Figure 5) indicate positive anomalies, while the lighter areas indicate negative anomalies. The magnetic image appears as if it is an aerial photo of surface foundation, so it can be used to guide archaeologists for any future excavations. The clearance of the observed features, their shapes, locations, dimensions and polarities facilitates interpretation of the obtained results to produce a good final archaeological view of the study area.
On the ground, wide field observations have been made in and around the study area indicate that, there was no evidence of any surface mud bricks. Meanwhile, the surface discoveries around the study area indicate the existence of some broken pottery made of fired mud. This is an important note, which could help in the illustration of the obtained results, and could guide to good comprehensive conclusions.
4.1.3. Interpretation of Magnetic Anomalies at Site (A)
The analysis of magnetic image showed scattered and dissected anomalies associated with negative anomalies (Figure 6). The magnetic anomalies within Site (A) shows three different distinctive anomaly features with different colors, traced with colored lines (Figure 6). Their magnetic intensity depends on the amount/density of the magnetic carrier’s minerals; for example, the blacker anomaly indicates the presence of more magnetic minerals.
The first anomaly zone (S1) is represented by a connected positive magnetic anomaly and suggests a part of rectangular shape. The rest of this anomaly probably occurs in the adjacent lake (Figure 3). This anomaly may be a part of buried mud brick wall.
The second anomaly (S2) has a triangular shape and may refer to the entrance of tomb. Besides, it has been noticed that the small random negative anomalies (white color) are not representing a magnetic dipole effect. These negative parts may refer to the presence of subsurface archaeological structure that often filled with sediments. The third anomaly (S3) has a rounded shape with big positive magnetic anomaly. This may be a part of a buried wall made of mud bricks.
4.1.4. Interpretation of Magnetic Anomalies at Site (B)
Four interesting anomalies can be distinguished in this site (Figure 7). The first and the second anomalies (S1 & S2) lie at the west of the study area, while the third anomaly (S3) lies at the north and the fourth anomaly (S4) lies at the south right corner of the study area. The scattered and dissected anomalies associated with negative anomalies are found in some grids all over the site.
The first anomaly (S1) is represented by a big connected positive magnetic anomaly elongated from east to west with rectangular shape. The first anomaly may represent a subsurface archaeological structure which made of mud bricks.
The second anomaly (S2) is represented by positive magnetic anomaly. It has a semi-circular shape. This anomaly is surrounded by obvious negative anomaly which is magnetic dipole of the positive one. This anomaly started to appear again after some distance towards the south of the area. This new anomaly is incomplete but it has the same shape and the same behavior of the first one. This anomaly may be supposing the existence of some buried archaeological feature with high magnetic response; it may be kind of metallic body!!
The third and fourth anomalies (S3 & S4) are represented by scattered positive magnetic anomalies. These anomalies may be a result of collapsed buried mud bricks wall.
The magnetic image of Site (B) reveals the presence of many scattered and separated positive magnetic anomalies all over the study area. These anomalies may be a result of some archaeological features or from the existence of highly magnetized minerals.
4.2. Multi-Frequency Electromagnetic Technique
The EM data have been analyzed at different frequencies from low to high. Figure 8 shows the apparent electrical conductivity in the surveyed site. Variations between the five maps are due to the variations of depth of penetration resulted from the different applied frequencies.
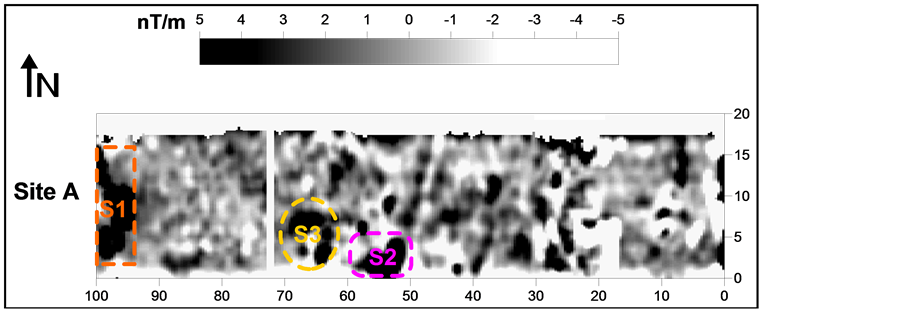
Figure 6. Interested magnetic anomaly zones derived from magnetic image at Site A.
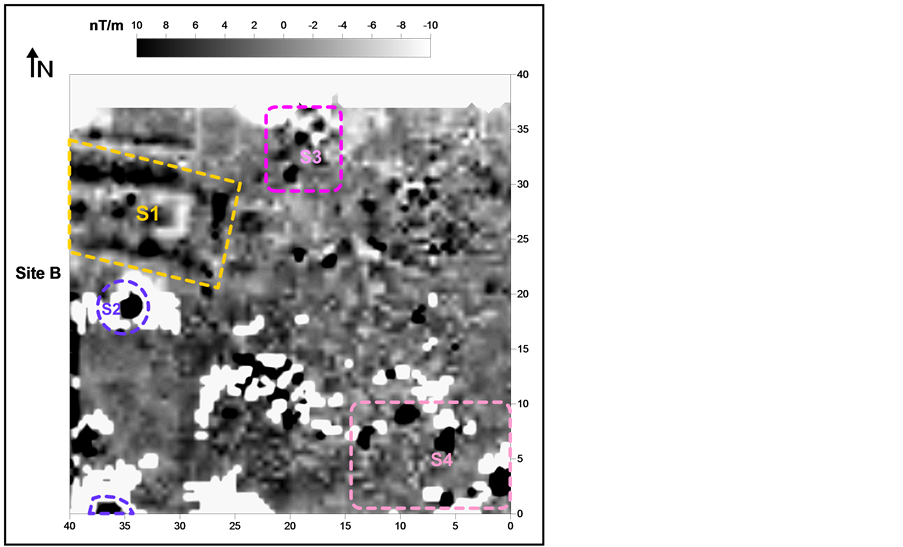
Figure 7. Interested magnetic anomaly zones derived from magnetic image at Site B.
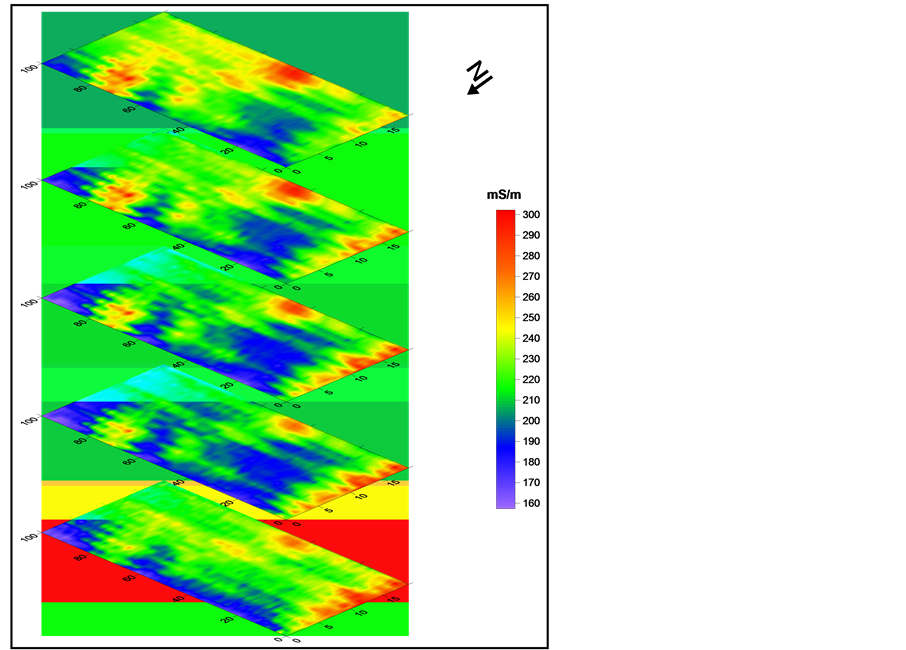
Figure 8. Conductivity maps for Site A at frequencies from bottom to top 750, 1710, 3870, 8970 and 19,950 Hz, respectively.
In practice, the apparent conductivities are more representative of the conductivity structure than EM data (Fitterman & Stewart, 1986). For example, quadrature is proportional to conductivity in low to mid induction numbers but is inversely proportional at mid to high induction numbers (Huang & Fraser, 1998), which is true for the case of multi frequency EM data we used in this work.
Figure 9(a) & Figure 9(b) shows the magnetic results of Site (A) and the conductivity maps at five different frequencies from high to low (i.e. from shallow to deep). Initial comparison between the magnetic gradient and electromagnetic results, shows matching between each other.
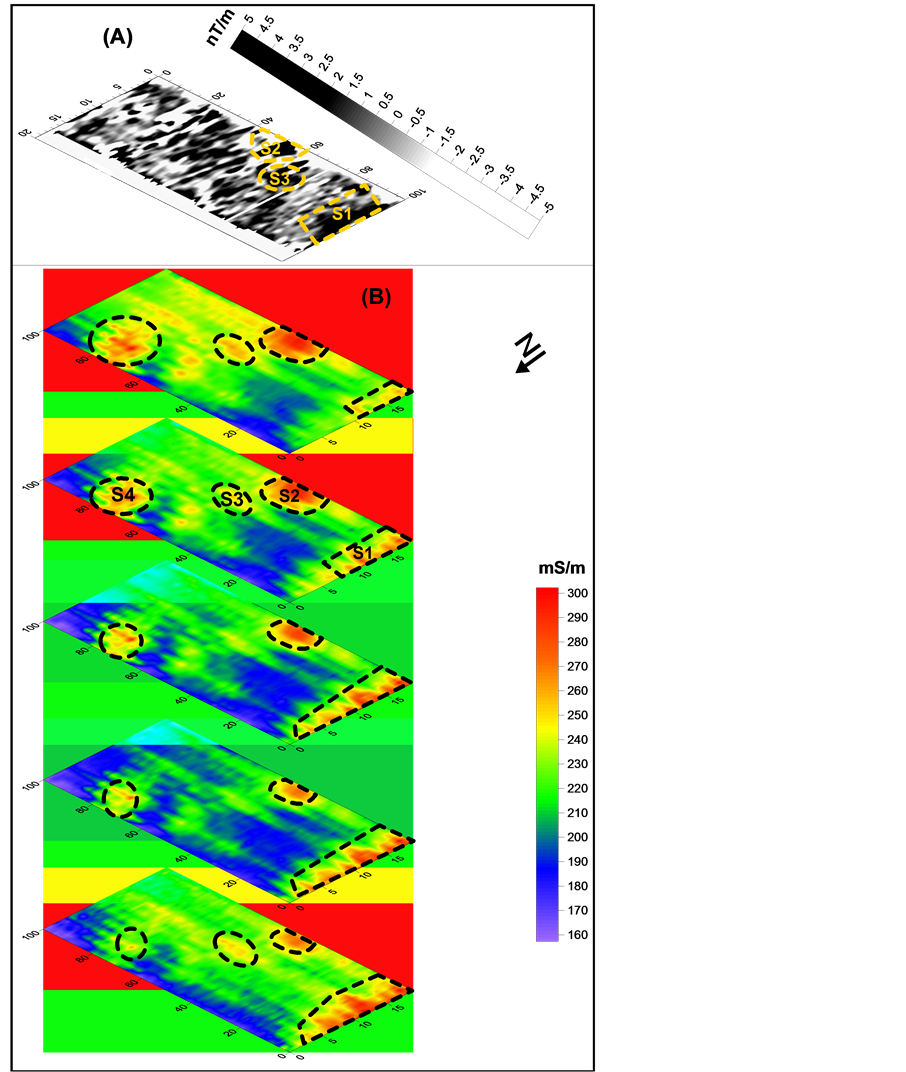
Figure 9. (A) Magnetic image of Site A., (B) Conductivity maps for frequencies from bottom to top 750, 1710, 3870, 8970 and 19950 Hz, respectively.
The correlation between the magnetic results and the conductivity maps (Figure 9(a) & Figure 9(b)) reveals the existence of a big elongated anomaly with rectangular shape (S1). This anomaly started to appear at the high frequency and then become more obvious and clear in intermediate and low frequency. This anomaly suggests the existence of archaeological feature at relatively shallow and intermediate depths of the explored sections which is within few meters depth. The high conductivity with high magnetic anomaly suggests that this archaeological feature is made of mud bricks. The conductivity map (Figure 9(b)) shows a big anomaly of high conductivity (S2) which has a rounded shape. The high frequency of this big anomaly supposes to be originated from a near-surface archaeological feature. This high conductivity anomaly with high magnetic anomaly suggests the existence of archaeological feature made of mud bricks, which agrees well with the magnetic results of (Figure 9(a)). There is also another big anomaly (S3) appears at high frequency and then disappeared at intermediate frequency and then appear again at low frequency. This big anomaly has a semi-circular shape with high conductivity. The high frequency of this anomaly may suggest a near-surface archaeological feature.
There is also another big anomaly (S4) appears at high frequency and then become less obvious at intermediate frequency. This big anomaly has a semi-circular shape with high conductivity. The high frequency of this anomaly may suggest a near-surface archaeological feature.
5. Summary and Conclusions
Two sites (A & B) around Kom Geif village (Naukratis) were selected to carry out the detailed archaeo-prospection survey. The micro-magnetic survey was carried out by the fluxgate gradiometer model FM36 through a raster of 0.5 m × 0.5 m. The measurements of the vertical magnetic gradient have been taken through successive parallel traverses separated by 0.5 m interval.
The acquired data were then represented through the Geoplot program as a grayscale image that represented the raw data. The processed magnetic image is very clear and appears as if it was an aerial photo of surface foundation, so it can be used to guide archaeologists during future excavation. Seven archaeological structures of mud bricks have been recognized in Sites A & B.
Site A was selected to carry out a detailed electromagnetic survey using GEM-300. There is very clear similarity between the magnetic data and the five conductivity maps and the anomaly associated between them which indicate that these anomalies are made of mud brick.
Acknowledgements
Sincere thanks for all of NRIAG stuff, who helped in acquiring the geophysical data using NRIAG facilities. We also would like to thank the anonymous reviewers for their valuable comments. The authors are indebted to the anonymous referees and their valuable comments that enrich the manuscript to its present form.
References
- Abbas, M. A., Abdallatif, T. F., Shaaban, F., Salem, A., & Suh, M. (2005). Archaeological Investigation of the Eastern Extensions of the Karnak Temple Using Ground-Penetrating Radar and Magnetic Tools. Geoarchaeology, 20, 537-554. http://dx.doi.org/10.1002/gea.20062
- Abdallatif, T. F, Abd El-All, E. M., Suh, M., Mohamad, R. M., & El-Hemaly, I. A. (2005). Magnetic Tracing at Abu Sir (Land of Forgotten Pyramids), Northern Egypt. Geoarchaeology, 20, 438-503.
- Abdallatif, T. F., Mousa, S. E., & El-Bassiony, A. (2003). Geophysical Investigation for Mapping the Archaeological Features at Qantir, Sharqyia, Egypt. Archaeological Prospection, 10, 27-42. http://dx.doi.org/10.1002/arp.190
- Bossuet, G., Camerlynck, C., Brehonnet, C., & Petit, C. (2001). Magnetic Prospecting of Diachronic Structures (Antiquity to First World War) on the Site of Sanctuary of Ribemont-sur-Ancre, Somme, France. Archaeological Prospection, 8, 67-77. http://dx.doi.org/10.1002/1099-0763(200103)8:1<67::AID-ARP153>3.0.CO;2-Y
- Clark, A. J. (1990). Seeing Beneath the Soil Prospecting Methods in Archaeology. London: B.T. Batsford Ltd., 176p. http://dx.doi.org/10.1002/1099-0763(200103)8:1<67::AID-ARP153>3.0.CO;2-Y
- Coulson, W. D. E., & Leonard Jr., A. (1982). Investigations at Naukratis and Environs, 1980 and 1981. American Journal of Archaeology, 86, 361-380. http://dx.doi.org/10.2307/504426
- Fitterman, D. V., & Stewart, M. T. (1986). Transient Electromagnetic Sounding for Groundwater, Geophysics, 51, 995-1005. http://dx.doi.org/10.1190/1.1442158
- Geoscan Research (1994). Instruction Manual Version 1.01. (Geoplot 2.01). Bradford, West Yorkshire, England, Geoscan Research.
- Ghazala, H. H., El-Mahmoudi, A. S., & Abdallatif, T. F. (2003). Archaeogeophysical Study on the Site of Tell Toukh EL-Qaramous, Sharkia Governorate, East Nile Delta, Egypt. Archaeological Prospection, 10, 43-55. http://dx.doi.org/10.1002/arp.195
- GSSI (1998). Operating System Version 1.10 (GEM-300). North Salem, NH 03073-0097 USA, Geophysical Survey System Inc. 79p.
- Herbich, T. (2003). Archaeological Geophysics in Egypt. The Polish contribution. Archaeologia Polona, 41, 13-55.
- Herwagner, J., Muarer, H., & Green, A. G. (2000). 3-D Inversion of Magnetic Gradiometer Data in Archaeological Prospecting. Possibilities and Limitations. Geophysics, 65, 849-860. http://dx.doi.org/10.1002/arp.195
- Huang, H., & Fraser, D. C. (1998). Magnetic Permeability and Electrical Resistivity Mapping with a Multi-Frequency Airborne EM system. Exploration Geophysics, 29, 249-253. http://dx.doi.org/10.1071/EG998249
- Kamei, H., Atya, M. A, Abdallatif, T. F., Mori, M., & Hemthavy, (2002). Ground-Penetrating Radar and Magnetic Survey to the West of Al-Zayyan Temple, Kharga Oasis, Al-Wadi Al-Jadeed (New Valley), Egypt. Archaeological Prospection, 9, 93-104. http://dx.doi.org/10.1002/arp.185
- Keiswetter, D. A, Novikova, E., Won, I. J., Hall, T., & Hanson, D. (1997). Development of a Monostatic, Multi-Frequency Electromagnetic Mine Detector. Society of Optical Engineering, 3079, 831-839.
- Keiswetter, D. A., & Won, I. J. (1997). Multi-Frequency Electromagnetic Signature of the Cloud Chamber, Nevada Test Site. Journal of Environmental and Engineering Geophysics, 2, 99-104.
- Murray, C., & Keiswetter, D. A. (1998). Application of Magnetic and Multi-Frequency EM Techniques for Landfill Investigations, Case Histories. Symposium on the Application of Geophysics to Environmental and Engineering Problems, Proceedings, 445-452.
- Nabighian, M. N., & Macanae, J. C. (1991). Time-Domain Electromagnetic Prospecting Methods. In M. N., Nabighian, (Ed.), Electromagnetic Methods in Applied Geophysics, Vol. 2 (pp. 427-514), Society of Exploration Geophysics. http://dx.doi.org/10.1190/1.9781560802686.ch6
- Odah, H., Abdallatif, T. F., El-Hemaly, I. A., & Abd El-All, E. M. (2005). Gradiometer Survey to Locate the Ancient Remains Distributed to the Northeast of the Zoser Pyramid, Saqqara, Giza, Egypt. Archaeological Prospection, 12, 61-68. http://dx.doi.org/10.1002/arp.245
- Reynolds, J. M. (1997). An Introduction to Applied and Environmental Geophysics. Chichester: John Wiley and Sons Ltd. 796p.
- Scollar, I., Tabbagh, T., Hesse, A., & Herzog, I. (1990). Archaeological Prospecting and Remote Sensing. Cambridge: Cambridge University Press, 692p.
- Sternberg, B. K., & Birken, R. A. (1999). A New Method of Subsurface Imaging, The LASI High Frequency Ellipticity System. Part 3, System Tests and Field Surveys. Journal of Environmental and Engineering Geophysics, 4, 227-240. http://dx.doi.org/10.4133/JEEG4.4.227
- Van Wesemael, B. (1988). The Relation between Natural Landscape and Distribution of Archaeological Remains in the Northeastern Nile Delta. In E. C. M. Van Den Brink (Ed.), The Archaeology of the Nile Delta: Problems and Priorities (pp. 125-134). Amsterdam: Netherlands Foundation for Archaeological Research in Egypt.
- Wilson, P. (2006). The Survey of Sais (Sa El-Hagar) 1997-2002. London: Egyptian Exploration Society, 336p.
- Witten, A. J., & Calvert, G. (1999). Characterizing the Distribution of Near-Surface Solution Channels Using Electromagnetic Induction and Ground Penetrating Radar. Journal of Environmental and Engineering Geophysics, 4, 35-43. http://dx.doi.org/10.4133/JEEG4.1.35
- Won, I. J, Keiswetter, D. A., Hanson, D. R., Novikova, E., & Hall, T. M. (1997). GEM-3: A Monostatic Broadband Electromagnetic Induction Sensor. Journal of Environmental and Engineering Geophysics, 2, 53-64. http://dx.doi.org/10.4133/JEEG2.1.53
- Won, I. J. (1980). A Wide Band Electromagnetic Exploration Method, Some Theoretical and Experimental Results. Geophysics, 45, 928-940. http://dx.doi.org/10.1190/1.1441097
- Won, I. J., Keiswetter, D. A., & Novikova, E. (1998). Electromagnetic Induction Spectroscopy. Journal of Environmental Engineering Geophysics 3, 27-40. http://dx.doi.org/10.4133/JEEG3.1.27
- Won, I. J., Keiswetter, D. A., Fields, G. R. A., & Sutton, L. C. (1996). GEM-2: A New Multi-Frequency Sensor. Journal of Environmental and Engineering Geophysics, 1, 129-138. http://dx.doi.org/10.4133/JEEG1.2.129
NOTES

*Corresponding author.