Geomaterials
Vol.06 No.01(2016), Article ID:62185,17 pages
10.4236/gm.2016.61001
Soil Subgrade’s Characterization and Classification of Thies (Senegal, West Africa) on a Radius of 2.5 Kilometers along Five Roads
El Hadji Bala Moussa Niakhate1, Séni Tamba2, Makhaly Ba1, Adama Dione1, Issa Ndoye1
1Laboratoire de Mécanique et Modélisation-UFR Sciences de l’Ingénieur, Université de Thies, Thies, Sénégal
2Ecole Polytechnique de Thies (EPT/Thies), Thies, Sénégal

Copyright © 2016 by authors and Scientific Research Publishing Inc.
This work is licensed under the Creative Commons Attribution International License (CC BY).
http://creativecommons.org/licenses/by/4.0/


Received 9 September 2015; accepted 21 December 2015; published 24 December 2015
ABSTRACT
This article explains the results of a study conducted on the characterizations of subgrade soils in the region of Thies. The road platforms are mainly composed of a background soil, which is generally overlapped by a surface layer that plays two roles. Firstly, it protects the soil structure, ensures the leveling, and facilitates the movement of vehicles. Secondly, it brings harmony in the mechanistic characteristics of the materials that compose the soil while improving the long-term life force. The methodology consisted in taking samples of subgrade soil along the roads all over the region of Thies in a 5 km diameter span. The identification tests allowed the Thies-Tivaoune, Thies-Khombole and Thies-Noto axes are characterized by tight sands, poorly graded size. While Thies Pout-axis is characteristic of severe solid particle size and spread well graded and serious to spread and well graded particle size. Finally the Thies-Montrolland axis is characterized by severe to very tight particle size and graduated to spread and serious and well graded particle size. The specific gravity values found Proctor test shows the presence of sand, sandy laterite and laterite. In the target area, polished soils of the A-3 type according to the AASHTO classification system are the most represented with 60%, followed by the A-2-6 type 25%, and the A-2-4 type with 9%, which are typical of gravel, clay, and silty sands. Soils of the A-1-b type (2%) typical of roc fragments, sands and clay are also represented. Polished sands of the A-3 type have a better efficiency on road infrastructures than other types of soil listed above. Finally, we’ve also noted the presence of soils of the A-2-7 and A-4 types with the low percentage of 2%. Subgrade soils of class S4 are the most represented with 58%, followed by those of class S5 with 42%. Samples of the Thies- Montrolland road have a claylike plasticity (CL or CH group), while those of the Thies-Pout road belong to the ML or OL and CL or OL groups with a tendency mostly directed to the CL or OL group. All these results confirm the very nature of soils on the two roads and put the light on the presence of lateritic materials with certain plasticity.
Keywords:
Subgrade Soil, Mechanistic Pavement Design, Arc GIS, AASHTO, CBR, Resilient Modulus

1. Introduction
Road infrastructures are among the key criteria currently used to measure the development of countries in general; that’s why their construction is of paramount importance. They are vital to the transportation of people and goods; hence, developing countries are investing in roads that contribute to boosting their economy by facilitating movement to and from their most isolated areas. A road is a structure that has three main layers: 1) the platform, 2) the intermediate layer, and 3) the surface layer, each of which plays a precise role. This study targets the platform, which is the background of the road. It is established nowadays that road structures deteriorate very early and very easily. Therefore, the study aims at studying the characterization of platform soils for the sake of a mechanistic dimensioning. To achieve that goal, samples of subgrade soil were taken over a diameter of 5 km on both sides of roads going through Thies. Identification tests were then conducted on all the samples and the results presented and commented. Knowledge of the identification parameters and the classification of soils based on the AASHTO system made it easy to deal with the mechanistic pavement design.
2. Literature Review
The background platform of a road has various functions. Its first function is to protect the base layer against weathers hazards, support the vehicle’s movement during the construction phase. It also has to supply enough and long-life roughness; which is also called life force so that a satisfactory mechanical motion of the structure can be obtained while ensuing a life cycle that is appropriate it its dimensioning. The environment largely conditions the life force of the background platform of a road [1] . The pair PST-base layer determines the long-term life force of the background platform of the road. Before any work should be undertaken, a laboratory should analyze and classify the soils composing the platform. Figure 1 below could be a representation of a road structure.
Top-down, the structure is composed of three layers: the upper layer, the modeling layer, and the adjustment layer. The platform must meet the following requirements: guarantee, not only a short term life force that exceeds 50 MPa necessary to having good quality compacting or materials densification; but also a long term life force that could allow for the traffic of vehicles to happen correctly during the construction phase, while protecting the PST against weather hazards. The life force of the platform corresponds to the capacity of interrelated layers to resist the constraints and deformations applied to them during the traffic. The life force of the platform refers, in the short term, to the values estimated or measured in the construction site; in the long term, it refers to the values used for the dimensioning and targeted during the conception phase (Babilotte et al., 1994) [3] .
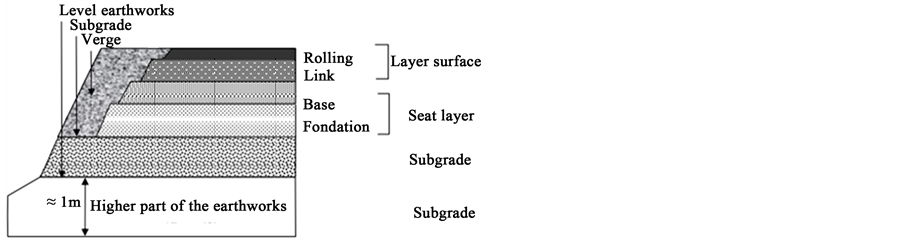
Figure 1. The elements of a roadway (LCPC, 1994) [2] .
3. Methodology
This study aims at focusing first on the Thies region where samples of soil are taken from the local platform.
At first, it consists in considering the following:
- A circle of diameter 2.5 km is identified and samples are taken all along the roads going through it.
Figure 2 determines the limits of the field of action.
- Samples are taken every 500 m.
- An interval of 50 m is observed between testing sites.
- A GPS is used to localize each testing site.
Therefore, samples are taken from five roads inside the identified circle. There are two types of roads:
- Highways: Thies-Tivaoune, Thies Pout, Thies-Khombole.
- Secondary roads: Thies-Montrolland, Thies-Notto.
4. Results
4.1. Altitude Variation
The sampling points are marked with their GPS coordinates x, y and z, the distance between the sampling points is measured using a pedometer. Using the GPS coordinates we represented the curve elevations in Figure 3 below.
Figure 3 shows that the highest altitudes are noted on the axes Thies-Montrolland and Thies-Pout with values
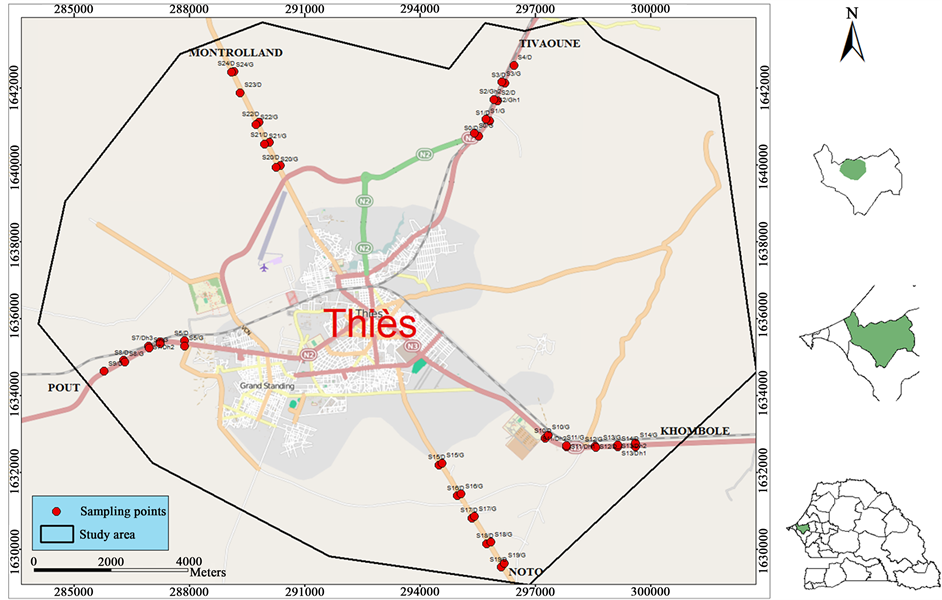
Figure 2. Delimitation of the scope of the study.
Figure 3. Altitude variation on five-axis characteristics of the study.
4.2. Laboratory Test Results
Particle size analysis on the samples is carried out according to the procedure of the French standard NF P 94-056 (1996) [4] , and the results are shown in Figure 4.
Examination of grading curves makes it possible to establish the particle size characteristics of Table 1 corresponding to the uniformity coefficients and coefficients of curvature platform sampled soils.
For the analysis of these data we propose to make the graph to try to identify coéfficientd'uniformié variation range and curvature coefficient following the axes below.
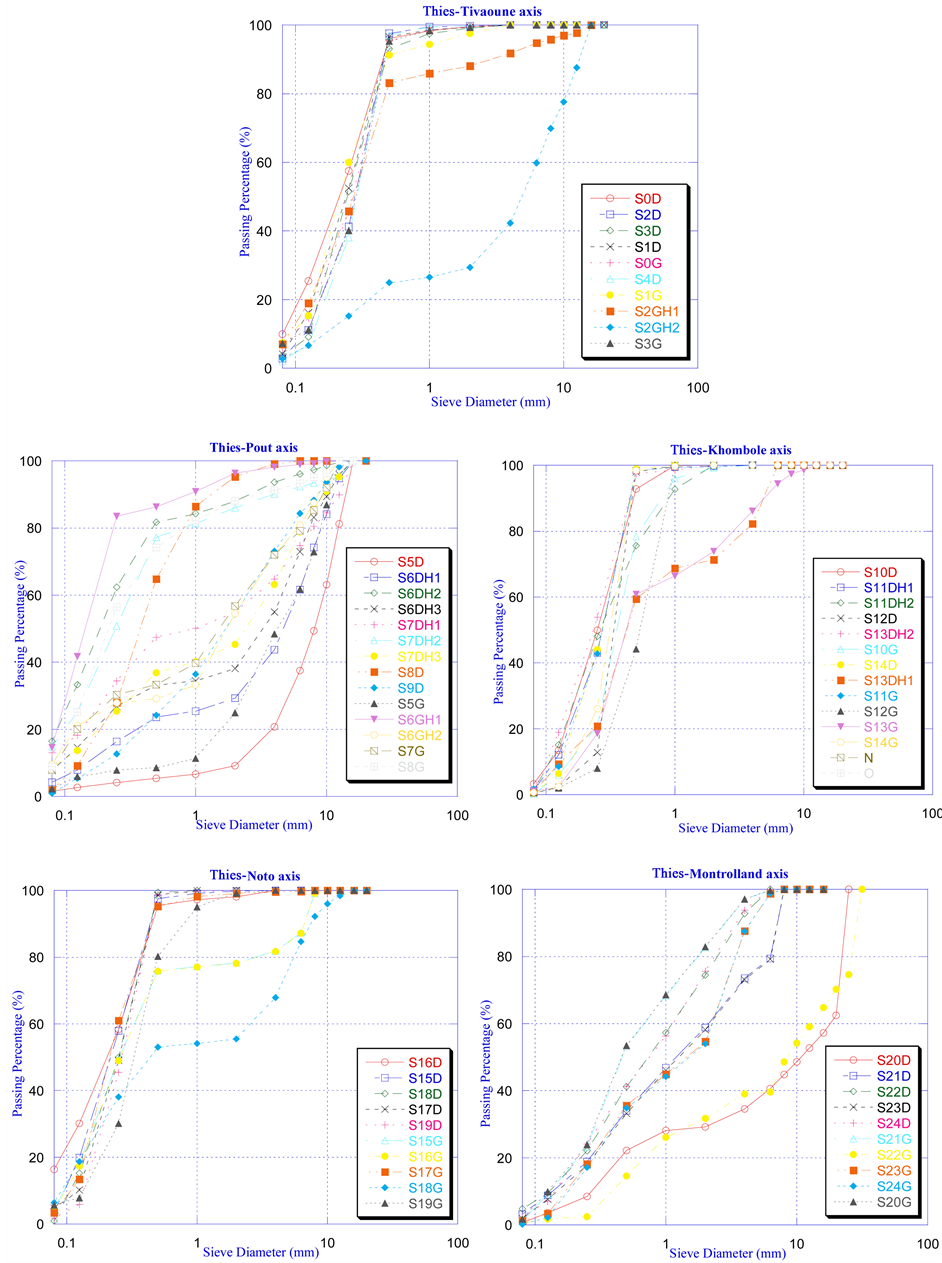
Figure 4. Particle size curves subgrade soil samples on five axes features of Thies (Thies-Tivaoune axis; Thies-Pout axis; Thies-Khombole axis; Thies-Noto axis and Thies-Montrolland axis.
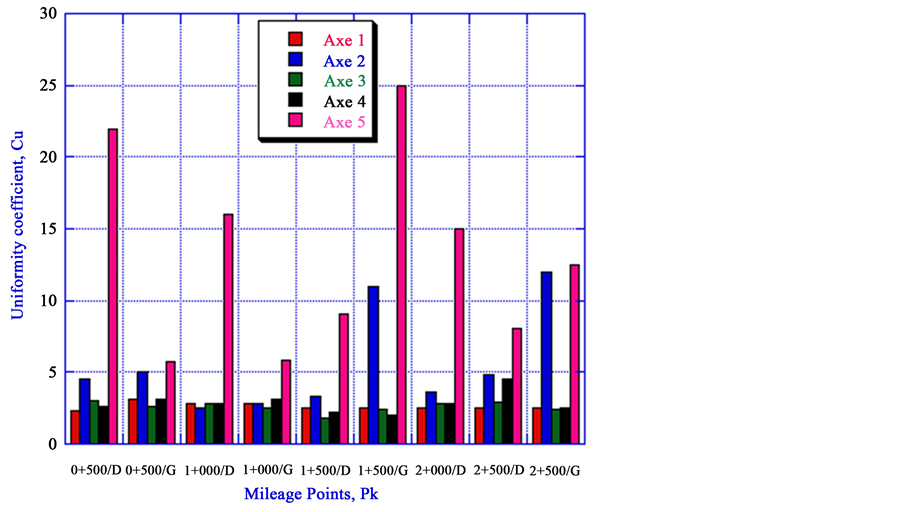
Figure 5. Variation of coefficient of uniformity along five roads.

Table 1. Subgrade soils size characteristics in the region of Thies.
The Proctor modified test on sampled soils platform is performed according to the procedure of the French standard NF EN 13286-2 (February 2005) [6] , and the results are presented in Figure 7.
The review of Proctor curves allow to establish Table 2 showing the optimum water content and maximum dry volumetric weight.
Figure 8 and Figure 9 show the variation of the optimum moisture content and maximum dry weight density following the five axis characteristics of the study.
Analysis of Figure 8 and Figure 9 shows that on the axle 1, the natural water content varies according to a maximum variation range ΔWn = 7.44%. With a maximum equal to 9.92%, these materials are sand and have a draining behavior resulting in a very low water holding capacity. While on the axis 2, the natural water content varies according to a maximum variation range ΔWn = 7.7%. With a maximum equal to 15.06%, these materials are gritty in nature. Therefore possess pores which can retain water. Note that on the axis 3 the maximum variation range is ΔWn = 1.76%. With a maximum equal to 2.12%, these low values of contents in natural water can be explained by the sandy nature of the samples on this axis and thus have a draining conduct. About the axis 4, the maximum change range is ΔWn = 4.69%. With a maximum equal to 5.36%, these low values of contents in natural water are related to the presence of sand having a draining conduct. And finally on the axis 5, there is as beach ΔWn = 13.49%. With a maximum equal to 15.59%, the natural water content values are explained by gritty nature of the samples. What made these samples be able to retain some moisture.
The CBR test is performed on the platform soils collected during the sampling campaign following the procedure of the NF P 94-078 standard. [7] . Table 3 gives the CBR 95% of the Proctor optimum platform and corresponding class according to (CEBTP, 1984) for all the samples in situ.
Table 3 shows that on the axle 1, the CBR varies ΔCBR maximum variation range equal to 5.5%. With a maximum equal to 23%, the CBR values are explained by the presence of sand samples and not plastic. While on the shaft 2 there is a variation range between 9%, with a maximum equal to 41%. It is in the presence of laterite containing iron minerals, which results in an increase in the volume maximum dry weight and therefore the CBR. Note that the laterite is rich in iron minerals. Samples of axis 4 vary an 8% variation range with a maximum of 23 or less justified by the sandy nature of the samples on this axis. On the axis 5 the range of variation is 9% with a maximum equal to 54%. These materials are of gritty nature and little plastic; this plasticity may explain these CBR values. Note that the CBR values are greater on Thies-Montrolland and Thies Pout-axes. It is noted the presence of laterite samples from these two axes. Laterite has high mechanical properties compared to sand, while in the other three axes samples are composed mainly of sand guide CEBTP [8] defines the traffic classes and platform soils described in Table 4.
The Thies-Montrolland axis is not overstretched in terms of traffic can be classified into low traffic T4 so the CBR values found allow the use of this material foundation layer and base layer of road structures on this axis. While Thies Pout-axis being very busy in circulation can be classified into T1 heavy traffic, forcing the improvement of laterite for Montrolland to reach 98% to 100% of compactness using foundation layer and layer Base on this axis. When the Khombole-Thies axis with the presence of factory so opportunity truck output can be classified T2 and the Thies-Tivaoune axis T3 traffic. Figure 10 shows the variation of the natural water content in the following five-axis characteristics of the study. Figure 11 shows the variation of the optimum water content according to the five-axis characteristics of the study.
From Figure 10 it is noted that the highest levels of natural water are observed in Thies-Montrolland and Thies-Pout axes. This is explained by the nature of laterite samples from these two axes, knowing that the laterite having pores can then maintain certain humidity. While samples are on―Thies Tivaoune axes; Thies-Noto and Thies-Khombole have lower water contents. This is explained by the sandy nature of the soil samples platform. When the optimum water content the opposite behavior is observed which is linked to the fact the materials that can retain some moisture will be absorbed water to achieve the optimum water content. Figure 12 shows the weight of each type of soil encountered along the five axes characteristic of the study. As for Figure 13, it shows the different platform classes encountered the following five areas of study characteristics.
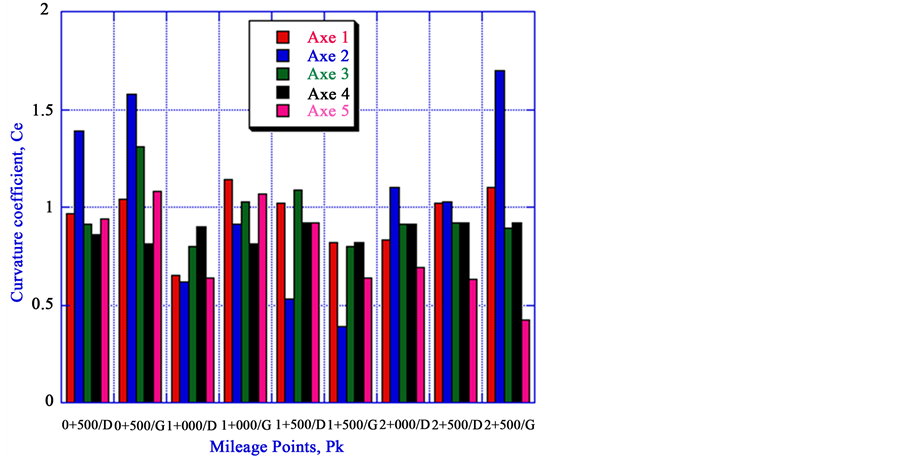
Figure 6. Variation of curvature coefficient along five roads.
Table 2. Maximum dry unit weight and water content of natural Platform soils in the region of Thies.
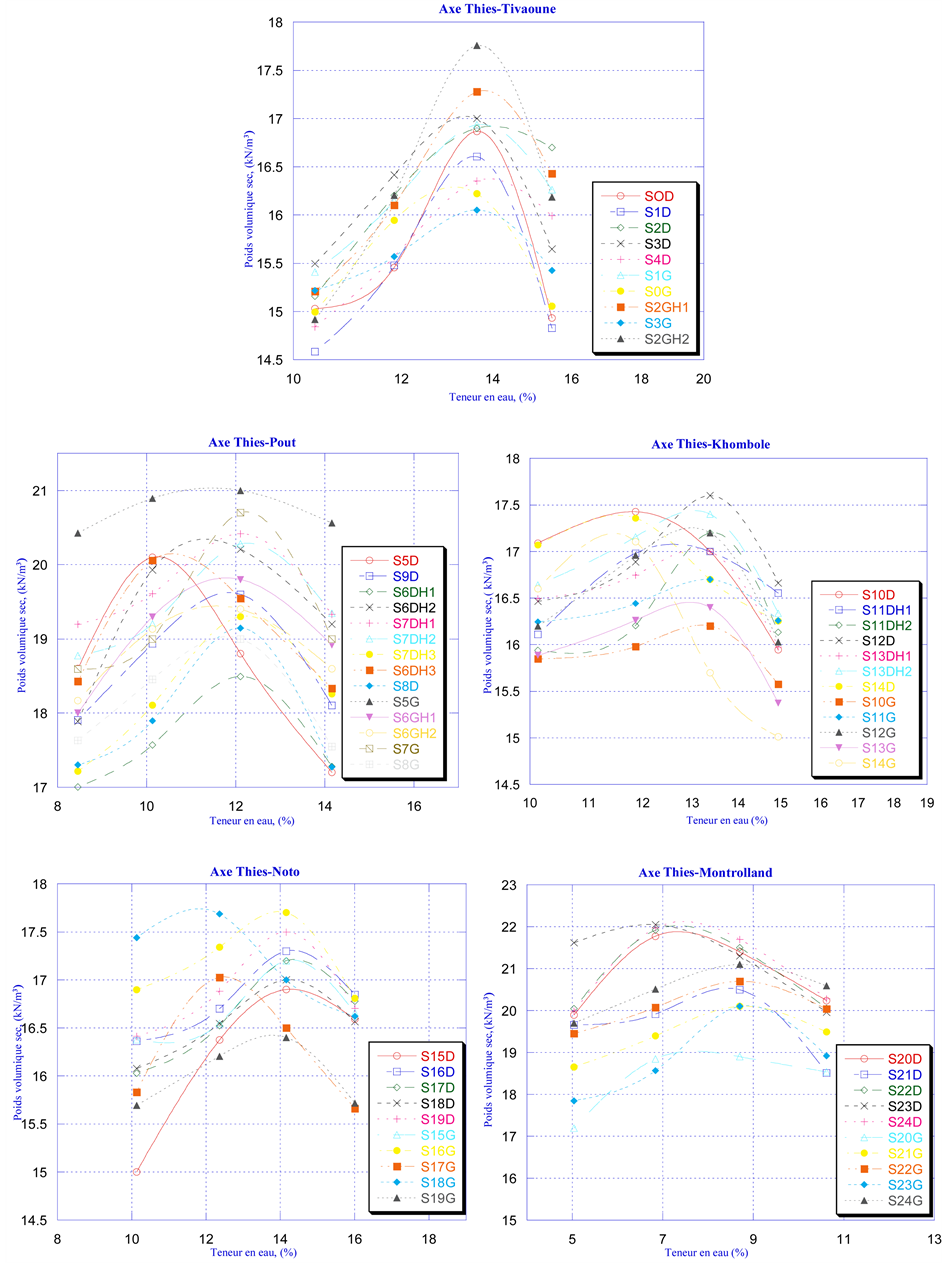
Figure 7. Proctor curves subgrade soil samples on five axes features of Thies (Thies-Tivaoune axis; Thies-Pout axis; Thies- Khombole axis; Thies-Noto axis et Thies-Montrolland axis).
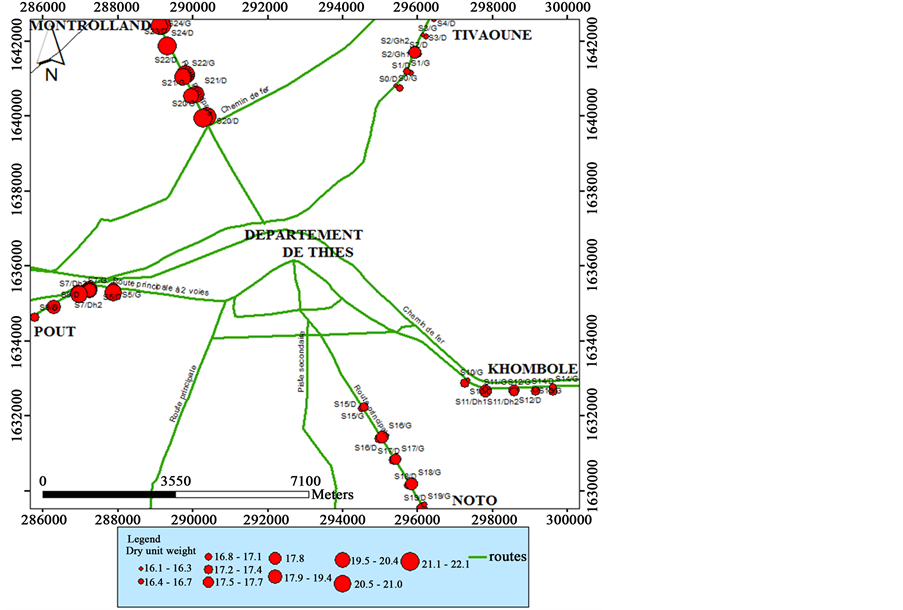
Figure 8. Dry unit weight variation after the five axes features on left bank and right.
Table 3. CBR and soil class platform in the region of Thies.
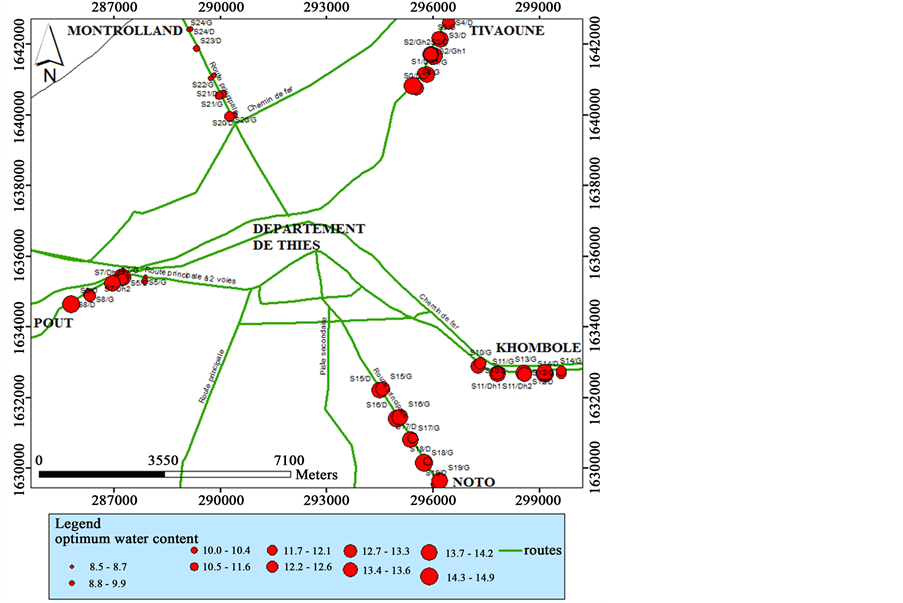
Figure 9. Change in optimum water content according to the five-axis features on left bank and right.
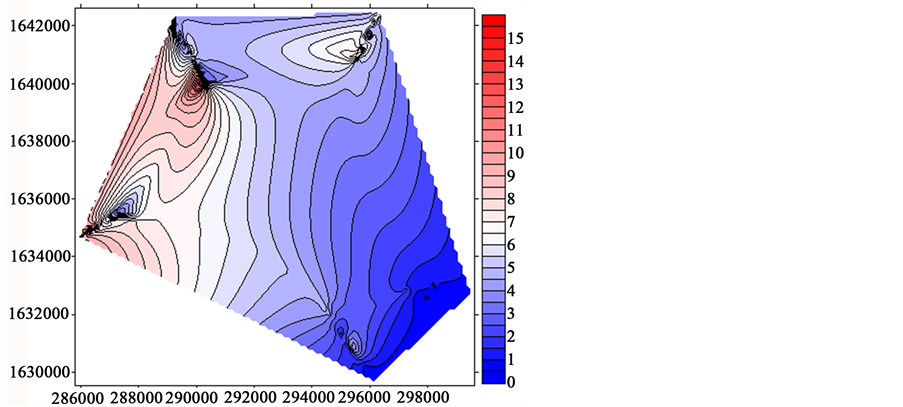
Figure 10. Variation of the natural water content Wn for the five characteristics axes.
Table 4. Classes’ traffic and platform (CEBTP, 1982, in Ba, 2008) [9] .
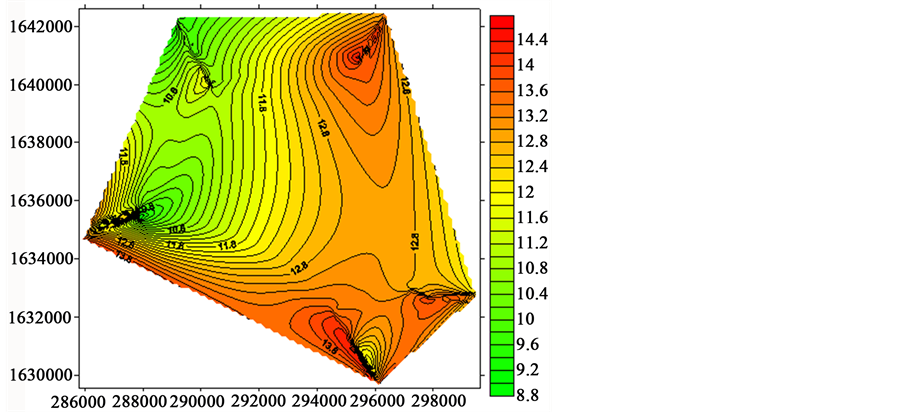
Figure 11. Variation of the optimum water content Wopt, for all five axes.
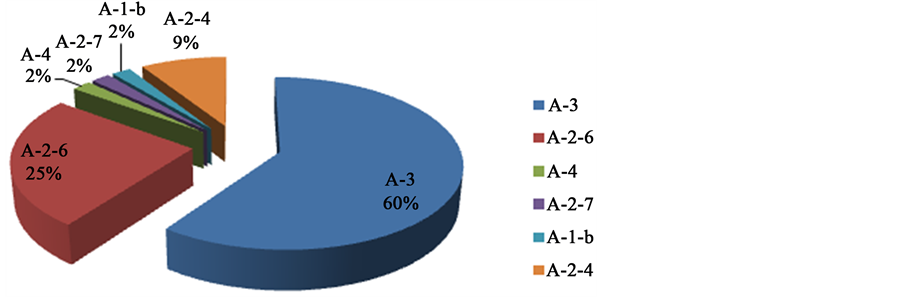
Figure 12. Distribution by type of subgrade in AASHTO system on five axes.
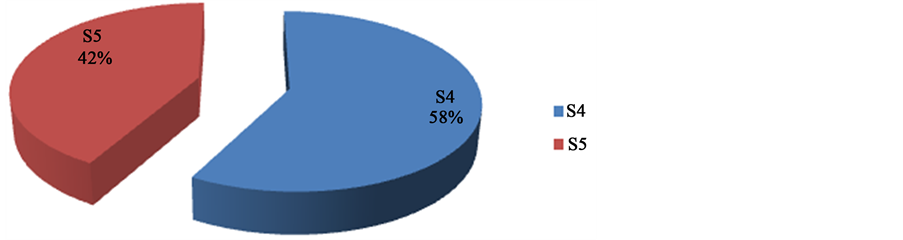
Figure 13. Distribution of subgrade class on five axes.
Atterberg limits on the samples are performed according to the procedure of the French standard NF P 94-051 (March, 1993) [10] , and the results are shown in Figure 15.
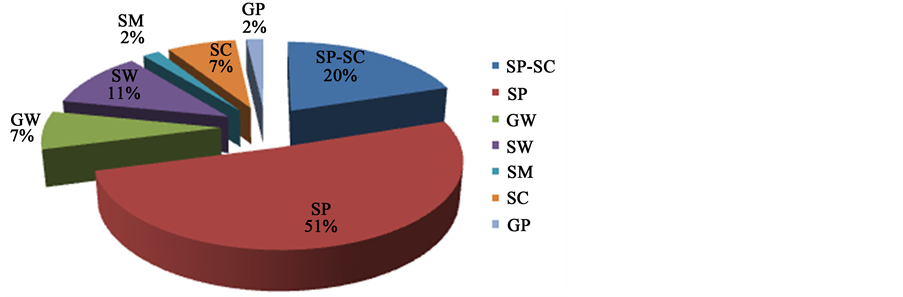
Figure 14. Distribution by type of subgrade in USCS system on five axes.
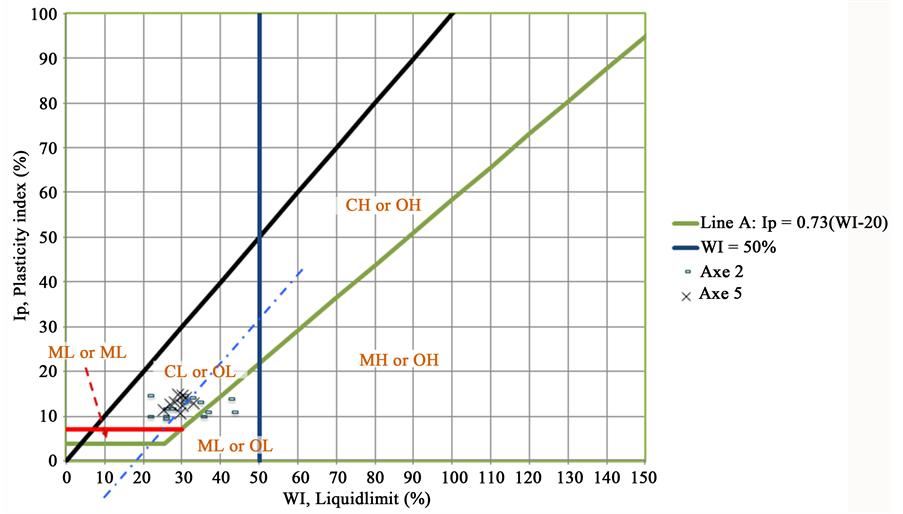
Figure 15. Land positions in place in the diagram Casagrande.
Figure 13 shows that the samples Thies-Montrolland axis lie above line A, the plasticity is of clay origin (CL or CH group), while the soil samples of Thies-Pout axis are shared by side of line A thus belong to ML or OL and CL or OL groups but the trend is particularly facing CL or OL group. All this confirms the nature of the soil Thies-Pout and Thies-Montrolland axes, highlighting the presence of laterite materials with high plasticity.
Table 5 gives the GPS coordinates, and the geotechnical profiles for all investigated axes.
4.3. Log Stratigraphic and Classification in AASHTO System of Subgrade Soil
The study of soils cuts represent different sampling points in the tables below. After conducting laboratory tests, we used the results of the test particle size analysis and Atterberg limits to classify soil samples in the classification system (AASHTO, 1929, in Robitaille et al., 1997) [11] . The following tables provided soils cuts at the different sampling point.
It may be observed on these soils cuts that Thies-Tivaoune, Thies Khombole and Thies-Noto axes consist mainly of sand while Thies Pout-axis is composed of laterite and lateritic sand, finally the Thies-Khombole axis laterite which confirms the results of preliminary studies drawn from maps (morpho soil, surface and geotechnical formations).
Table 5. Log stratigraphic of subgrade soil.
Legend:  : Topsoil;
  : Sand;
  : Laterite;
  : Sable;
  : Sand;
  : Topsoil.
5. Conclusion
The results for all tests on five (05) axes reveal the following important points: The highest altitudes are noted on the Thies-Pout and Thies-Montrolland axes and three axes show the lowest altitudes. From the viewpoint of particle size allowed, the Thies-Tivaoune, Thies-Khombole and Thies-Noto axes are characterized by tight sands, poorly graded size. While Thies Pout-axis is characteristic of severe solid particle size and spread well graded and serious to spread and well graded particle size. At last the Thies-Montrolland axis is characterized by severe to very tight particle size and graduated to spread and serious and well graded particle size. Soils in place are mostly lateritic or similar materials and it corroborates initial information from maps (morpho soil, surface and geotechnical formations). The Thies-Montrolland axis lies above line A, and the plasticity is of clay origin (CL or CH group), while the soil samples of Thies Pout-axis are divided on either side of A line so belong to the ML or OL and CL or OL groups. Also, lateritic materials sampled on the axis Thies-Montrolland show CBR and maximum volume and dry weight (max γd) highest and best water contents (Wopt.) Lower. The Thies-Mon- trolland axis is not overstretched in terms of traffic that may be classified into low traffic T4 so the CBR values found allow the use of this material foundation layer and base layer of road structures on this axis. While Thies Pout-axis being very busy in circulation can be classified into T1 heavy traffic, forcing the improvement of laterite Montrolland to reach 98% to 100% of compactness using foundation layer and layer base on this axis. When the Thies-Khombole axis with the presence of factory so opportunity for truck output can be classified T2 and lastly, the Thies-Tivaoune axis T3 traffic. This recognition of the soil up allowed the classification of soils in the AASHTO system subject to the standard (ASTM, 1992). And so, it is noted that the platform soils covering our fields of study consist of 60% of fine soils (A-3), 25% gravel and silty or clayey sands A-2-6, 9% soil types A-2-4 (characterizing gravel and silty or clayey sands). In sum considering the same wave length of 2% of soil type A-2-7, A-1-b and A-4, fine soils types A-3 that are most predominantly met, have a better performance in road infrastructure (Robitaille et al., 1997). We also meet 58% of S4 platform floors class, 42% of S5 class soils.
Cite this paper
E.H.B.M.Niakhate,SéniTamba,MakhalyBa,AdamaDione,IssaNdoye, (2016) Soil Subgrade’s Characterization and Classification of Thies (Senegal, West Africa) on a Radius of 2.5 Kilometers along Five Roads. Geomaterials,06,1-17. doi: 10.4236/gm.2016.61001
References
- 1. SETRA (2009) Apport du drainage dans la conception des plateformes supports de chaussées. Ministère de l’écologie, de l’énergie, du Développement Durable et de l’Aménagement du Territoire, 10 p.
- 2. LCPC-SETRA (1994) Conception et dimensionnement des structures de chaussées: Guide technique.
- 3. Babilotte, C. and de Lyon, C.S.C. (1994) Dimensionnement des structures de chaussées communautaires du Grand LYON: Guide technique communautaire. Parution initiale en, 85 p.
- 4. Norme Francaise NF P 94-056 (1996) Sol: Reconnaissance et essais Analyse Granulométrique Méthode par tamisage à sec après lavage. Norme Francaise, 16.
- 5. Norme Française XP P 94-011 (1999) Sols: Reconnaissance et essais, Description-Identification-Dénomination des sols, 24 p.
- 6. Norme Française NF P 94-093 (1999) Sol: Reconnaissance et essais Détermination des références de compactage d’un matériau. Norme Française, 18 p.
- 7. Norme Française NF P 94-078 (1997) Sol: Reconnaissance et essais CBR après immersion-indice CBR Immédiat-Indice portant immédiat. Norme Française, 12.
- 8. CEBTP (1984) Guide Pratique de Dimensionnement des chaussées pour les pays Tropicaux, 155 p.
- 9. Ba, M. (2012) Comportement Mécanique sous Sollicitations Cycliques de Granulats Quartzitiques de Backel-Co paraison avec des Matériaux de Référence du Sénégal et d’Amérique (USA): Application au Dimensionnement Mécanistique des Chaussées Souples. Thèse de Doctorat Université Cheikh Anta Diop de Dakar, 239.
- 10. Norme Francaise NF P 94-051 (1993) Détermination des limites d’Atterberg: Limite de liquidité à la coupelle, limite de plasticité au rouleau, 16 p.
- 11. Robitaille, et al. (1997) Mécanique des sols théorie et pratique. 647 p.