World Journal of Nuclear Science and Technology
Vol.4 No.3(2014), Article ID:48326,9 pages
DOI:10.4236/wjnst.2014.43018
Determination of Major, Minor and Trace Element Compositions of the Gd2O2S:Pr,Ce Scintillation Ceramics with Neutron Activation Analysis
Vladimir G. Zinovyev1, Ivan A. Mitropolskiy1, Yuriy E. Loginov1, Georgiy I. Shulyak1, Tatyana M. Tyukavina1, Sergey L. Saharov1, Sergey V. Kosianenko1, Elena I. Gorokhova2, Vladimir A. Demidenko2
1National Research Centre “Kurchatov Institute”, B.P. Konstantinov Petersburg Nuclear Physics Institute, PNPI, Gatchina, Russia
2NITIOM Vavilov State Optical Institute, St. Petersburg, Russia
Email: pitzinovjev@yandex.ru
Copyright © 2014 by authors and Scientific Research Publishing Inc.
This work is licensed under the Creative Commons Attribution International License (CC BY).
http://creativecommons.org/licenses/by/4.0/


Received 31 March 2014; revised 2 May 2014; accepted 27 May 2014
ABSTRACT
Neutron activation analysis technique of the Gd2O2S:М scintillation ceramics was developed. The concentrations of 15 trace, minor and major elements (As, Ce, Co, Cr, Cs, Eu, Fe, La, Sc, Tb, Zn, Zr, Pr, Gd, Na) have been measured with the instrumental neutron activation analysis of the Gd2O2S:Pr sample. The concentrations range of the determined elements is from 3 × 10⁻⁸ to 2.0% in mass. The determination limit of the elements was calculated to be (0.6 - 1.3 × 10⁻⁸% in mass).
Keywords:Neutron Activation Analysis, Nuclear Reaction, Trace Elements, Thermal Neutron Flux, Nuclear Reactor

1. Introduction
Creation of a high-performance and fast-responding scintillators is one of the most essential concept of the material authority of late. Combination of the high conversion efficiency and the short lifetime which gadolinium oxysulfide (Gd2O2S) obtain at the alloying with trivalent praseodymium (Pr3+) in combination with impurity of Ce3+ and F−, have defined a choice of the phosphor as a base at the development of the ceramic scintillators for a computed tomography [1] [2] .
The Pr3+ is a scintillating ion. The ion emits the radiation quantum at 513 nm corresponding to the transition 3P0 → 3HJ, 3FJ, with a decay constant of about 3 μs. The Ce3+ secures the necessary level of the afterglow; F− ion was introduced in the host lattice for increasing the luminescence intensity and reducing the afterglow. In the literature, hot pressing of the material with traces of Li2GeF6 as a sintering aid is usually used in order that the ceramic scintillator has high translucent. The density of the scintillator is 7.34 g∙cm−3. The Gd2O2S:Pr,Ce as well as Gd2O2S:Tb,Ce and Gd2O2S:Eu scintillation optical ceramics were investigated and were developed at Company “NITIOM Vavilov State Optical Institute”, St. Petersburg, Russia since 2000. The uniaxial hot pressing method was used toward this end. Various domestic and foreign firms produce powder phosphors which were used for ceramics manufacture. The pressing process of the high-melting compound Gd2O2S is carried out together with the easily melted additive of the LiF to produce the ceramics with the high density and the transparency. The scintillation and the optical characteristics of the ceramics depend on the quality of the base phosphor powder and on its synthesis feature which determines a distribution of the lattice and the impurity defects in the crystal lattice. High transparency, uniformity of the ceramics and the required scintillation parameters are defined with the quality of the initial powder with other things being equal (Table 1).
The optical properties of the ceramics worsen, the specific light yield decreases and the afterglow increases, if the initial powder contains uncontrollable impurities. The purpose of the paper is to reveal the causes of deterioration of optical and scintillation characteristics of the Gd2O2S:Pr,Ce samples produced from the raw materials containing uncontrollable impurities.
The research of the trace, minor and major elements has been carried out with instrumental neutron activation analysis in Gd2O2S:Pr,Ce in view of the above mentioned.
2. Examination
The impurity content determination of Gd2O2S:Pr samples with neutron activation analysis is very intricate problem. First nuclei 32P, 33P and 35S are accumulated in the sample when Gd2O2S:Pr is subjected to neutron irradiation. The 32P, 33P and 35S isotopes are obtained with nuclear reactions described with the equations 32S(n,p)32P (T1/2 = 14.262 d), 33S(n,p)33P (T1/2 = 25.34 d), 34S(n,p)35S (T1/2 = 87.51 d). These isotopes are powerful sources of beta radiation with Eβ = 1710.66 keV (32P), Eβ = 248.5 keV (33P) and Eβ = 167.14 keV (35S). The decay schemes of the isotopes are given in the Figure 1 [3] . Beta radiation generates the low energy bremsstrahlung in the gamma spectrum of the sample.
The next problem to be solved is the presence twelve isotopes 151,153,159,161,162Gd, 155,157,158Eu, 153,155,157Sm and 161Tb which natural Gd produces under a reactor irradiation. The radioactive isotopes have a lot of gamma-rays of the large intensity at the energy of Eγ < 250 keV. The calculations and the experiment have shown that specific activities of the daughter Gd and Pr isotopes vary from 105 to 1011 Bq if irradiations were performed in the reactor in a thermal flux of 6.3 × 10¹³ s−1∙cm−2 and in a epithermal neutron flux of 3.1 × 10¹² s−1∙cm−2 after irradiation of 1 hour (Table 2). As the multichannel analyzer used had dead time about 95% - 100%, the gamma-ray spectrum of the sample cannot be registered with HPGe detector with a desired statistical precision because 153Gd, 151Gd and 160Tb are long-lived isotopes. The main nuclear characteristics of Gd and Pr isotopes are given in the Table2
The continuous background of the gamma-ray spectra is one of the limiting factors for the sensitivity of the analysis. It may be reduced by absorption of the interfering radiation, mainly beta radiation or low energy gamma radiation, by more or less thick foils placed between the sample and the detector. This technique is useful if

Table 1 . The main characteristics of the optical scintillation ceramics based of the Gd2O2S:Pr,Ce, made from high-quality phosphor powder (Siemens).
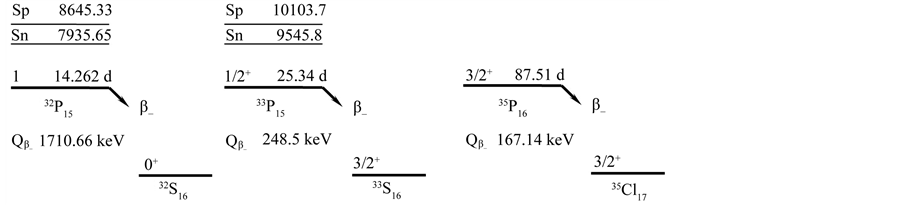
Figure 1. Decay schemes of the 32P, 33P and 35S isotopes.
Table 2. The nuclear characteristics of the Gd and Pr isotopes which the sample produces under a reactor irradiation [4] [5] . The Abn is the isotopic abundance, the En is the neutron energy, the Eγ is the gamma energy of a daughter nucleus, the γ-abn is gamma-ray abundance, the σ is the activation cross-section, the I is the resonance integral, the Asa is the specific activity.
weak high-energy photo-peaks have to be measured in the presence of intensive low-energy radiation. In the favorable case, photons of the certain energies can be selectively absorbed by materials whose K X-ray absorption edge corresponds to that energy.
The concentrations of the trace elements were measured by the absorption method in Gd2O2S:Pr. The Cu (0.1 mm thick), Cd (0.5 mm), W (0.1 mm) and Pb (0.1 mm) plates have been used as absorbing filters because these elements have the K X-ray absorption edges at the energies of 8.982 keV, 26.712 keV, 69.51 keV and 87.95 keV, respectively. The Cu and Cd plates have been used for the absorption of beta radiations and bremsstrahlung of 32P, 33P, 35S. The W and Pb plates have been used for the absorption of low energy gamma and X-ray radiation of 151Gd (X-ray: 40.902 keV, 41.542 keV, 46.905 keV, 47.038 keV, 48.249 keV, gamma radiation: 21.532 keV, 63.91 keV, 64 keV, 93.17 keV), 153Gd (X-ray: 5.85 keV, 40.902 keV, 41.542 keV, 46.905 keV, 47.038 keV, 48.249 keV, gamma radiation: 14.06383 keV, 19.81295 keV, 69.673 keV, 75.42212 keV, 83.36717 keV, 89.48594 keV), 161Tb (X-ray: 6.5 keV, 45.208 keV, 45.988 keV, 51.947 keV, 52.113 keV, 53.476 keV, gamma radiation: 25.65134 keV, 48.91532 keV, 57.19169 keV, 74.56668 keV).
The gamma-ray spectra of the multielement reference standard of IAEA 433 are given in the Figure 2. The reference standard of IAEA 433 was irradiated and cooled for 2 hours and 3 days respectively. One of the spectra has been measured by using the Cu-Cd-W-Pb filter and another spectrum has been measured without the filter. The gamma-ray spectra were measured with the 15% coaxial HPGe detector (FWHM 1.7 keV at 1173.238 keV, Canberra, USA) coupled with “Lynx” multichannel analyzer (Canberra, USA).
The counting rate of the complete absorption peaks at the energy of Eγ < 250 keV is much less in case of use of the Cu-Cd-W-Pb absorbing filters compared to the case without the filter. This distinction strongly decreases, if the gamma energy increases. The ratio S0/SF is plotted against the gamma energy in the Figure 3, where SF and S0 are the peak areas in the spectra of Gd2O2S:Pr sample measured with and without the Cu-Cd-W-Pb gamma rays and X-rays absorbing filter. The S0/SF value tends to 1 at the energy of Eγ > 250 keV (Figure 3) when Cu-Cd-W-Pb filter is placed between sample and detector. Thus, on the one hand we suppress gamma radiation at the energy of Eγ < 250 keV and on the other hand optimum conditions are achieved when we measured gamma spectrum at the gamma energy of Eγ > 250 keV.
The spectra of the sample at the energy of Eγ < 200 keV measured under the same conditions are presented in the Figure 4.
3. Determination Techniques
In our work the NAA technique of Gd2O2S:Pr,Ce samples has been developed. The technique provides the high
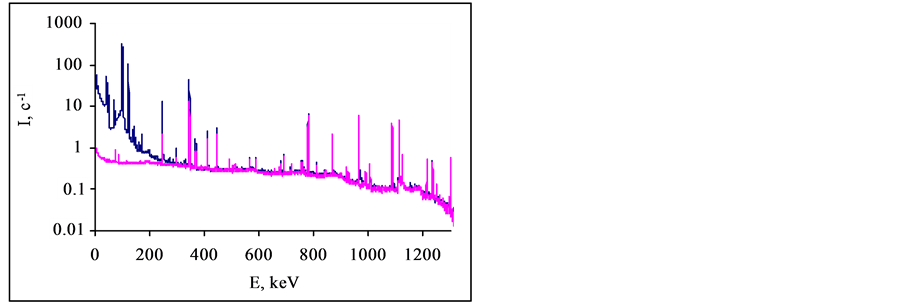
Figure 2. Gamma-ray spectra of the reference standard of IAEA433 were measured with and without the Cu-Cd-W-Pb absorbing filter. The decay time of the standard was 7 days. Measurement times of the spectra were reduced to 1 second.
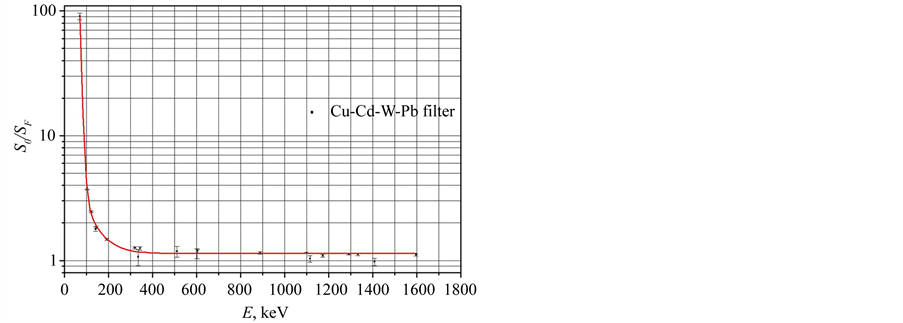
Figure 3. The S0/SF values plotted against the gamma energy for the spectra of the IAEA433 reference standard. The SF and S0 are peak areas in the spectra measured with and without the Cu-Cd-W-Pb filter.
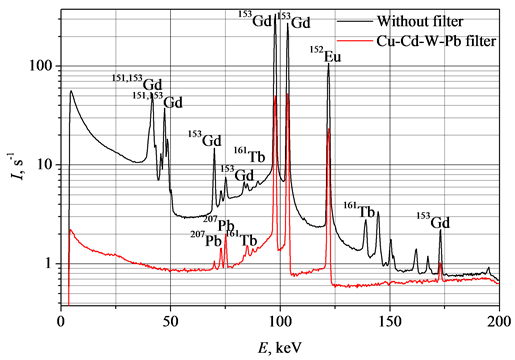
Figure 4. Parts of the Gd2O2S:Pr,Ce spectra at the energy of Eγ < 200 keV. For measurement the time period of 1 second and for decay the time period of 8 months have been taken.
sensitivity and the results reproducibility for the large number of elements in one run. The analyses of the sample were performed using two methods. The first method is the k0-method (Gd, Pr) of NAA and the second method is relative NAA (As, Ce, Co, Cr, Cs, Eu, Fe La, Sc, Tb, Zn, Zr, Na).
The k0-method was used to determine concentrations of the Gd and Pr in Gd2O2S:Pr,Ce samples. Masses of the sample and the monitors were about 30 - 50 mg. The Al(99.9%)-Co(0.1%) and Al(99.9%)-Au(0.1%) alloys were used as the thermal and the epithermal flux monitors. The Ni foil (0.1 mm thick) was used as the fast neutron flux monitor. The Fe foil (0.1 mm thick) was used as the k0-monitor. The samples, the k0-monitor and the flux monitors were packed up into quartz glass ampoules. The ampoule’s glass was HQS high-purity quartz glass (Heraeus Quarzglas, Germany). The samples and the monitors were irradiated into the water channel of the WWR-M reactor with thermal neutrons (fth), epithermal neutrons (fepi), and fission-spectrum fast neutrons (ff). Typical values of these fluxes at a sample irradiation positions in the 17 MW reactor are thermal fth = 6.3 × 10¹³ s−1∙cm−2, epithermal fepi = 3.1 × 10¹² s−1∙cm−2and fast ff = 4.1 × 10¹¹ s−1∙cm−2. For irradiation the time-period of two hours has been taken. The ampoules were washed out with 0.5 M HNO3 aqueous solution and distilled water after the irradiation. The sample, the k0-monitor and the flux monitor activity were measured with the 15% coaxial HPGe detector (Canberra, FWHM 1.7 keV at Eγ=1332.5 keV). The Cu-Cd-W-Pb gammas and X-rays absorbing filter was placed between the sample and the detector when we measured spectra. The gamma-ray spectra were measured after 7 and 15 days of cooling time.
The mass of Gd and Pr was calculated following the equation
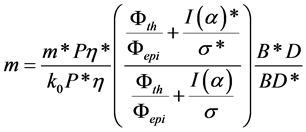 (1)
(1)
The k0 factor includes only natural constants
 (2)
(2)
The asterisk marks the values belonging to the monitor. The η is counting efficiency of HPGe detector, the M is the atomic weight of the element, the a is the abundance of the isotope yielding the radionuclide to be measured. The σ is the thermal cross section. The I(α) value is determined with the equation
 (3)
(3)
where I0 is the resonance integral of the isotope and
![]() is effective resonance energy [6] [7] . The P is counting rate in photo-peak, the
h is the gamma ray abundance. The Φth and Φepi are thermal
and epithermal neutron fluxes, respectively. The
is effective resonance energy [6] [7] . The P is counting rate in photo-peak, the
h is the gamma ray abundance. The Φth and Φepi are thermal
and epithermal neutron fluxes, respectively. The
 is build up term. The
 is the decay and the measuring terms, the
![]() is the decay constant. The tb, td and tm are the
irradiation, the decay and the measurement times, respectively. The T1/2
is half-life of the analytical isotope. The α value is the epithermal flux deviation
from the ideal (1/E) distribution.
is the decay constant. The tb, td and tm are the
irradiation, the decay and the measurement times, respectively. The T1/2
is half-life of the analytical isotope. The α value is the epithermal flux deviation
from the ideal (1/E) distribution.
The thermal and the epithermal neutron fluxes were measured with the double monitor method [6] . The Al(99.9%)-Co(0.1%) and Al(99.9%)-Au(0.1%) alloys were used as the monitors. These monitors were irradiated together with the samples without disturbing the neutron flux. The flux ratio was calculated following the equation
 (4)
(4)
where
 . The deviation α of the epithermal flux from the ideal (1/E)
distribution is determined by the “Cd ratio” method (Au, Co monitors) [6] . The result of measurement was α = 0.024
with the uncertainty of about 10%.
. The deviation α of the epithermal flux from the ideal (1/E)
distribution is determined by the “Cd ratio” method (Au, Co monitors) [6] . The result of measurement was α = 0.024
with the uncertainty of about 10%.
Relative technique was used to measure the concentrations of 13 trace elements in the samples.
The Gd2O2S:Pr,Ce samples and comparison standard (IAEA 433 reference material) were packed in high-purity quartz glass ampoules. The sample and the comparison standard mass were about 30 - 50 mg. The samples were irradiated in a water channel of the WWR-M reactor for two hours at thermal fth = 6.3 × 10¹³ s−1∙cm−2 and epithermal fepi = 3.1 × 10¹² s−1∙cm−2 neutron fluxes. After irradiation the ampoules were washed out with the 0.5 M HNO3 aqueous solution and the distilled water. The total the sample and the comparison standard activity was measured with the 15% coaxial HPGe detector (Canberra, FWHM 1.7 keV at Eγ = 1332.5 keV). In the time of measurements the Cu-Cd-W-Pb gamma and X-ray absorbing filters were placed between the sample and the detector. The gamma ray spectra were measured after 6, 20 and 40 days of cooling time. The gamma and X-ray absorbing filter was used in the measurements of the gamma spectra with Gd2O2S:Pr and the reference material of IAEA433. Parts of Gd2O2S:Pr,Ce spectra are presented in the Figure 5 and Figure 6. The gamma ray spectra were measured after a decay period of 6 and 20 days, respectively.
The Figure 5 shows the complete absorption peaks with respect to the well-known 1368.633 keV, 1460.8 keV and 1596.21 keV lines from 14.959 hours half-life 24Na, 1.265 × 10⁹ years half-life 40K and 1.6781 days half-life 140La respectively.
The complete absorption peaks of the 59Fe (1099.245 keV), 152Eu (1112.069 keV), 65Zn (1115.546 keV), 46Sc (1120.545 keV), 60Co (1173.2 keV), 160Tb (1177.954 keV) long-lived isotopes (T1/2 > 20 days) are presented in Figure 6. The gamma line of 65Zn isotope at the energy of Eγ = 1115.546 keV coincides with a gamma line of 160Tb isotope at the energy of 1115.12 keV (Figure 6). So, when calculating Zn concentration, the contribution of the 1115.12 keV gamma line of 160Tb into the intensity of 1115.546 keV gamma line of 65Zn was taken into account. The complete absorption peak area of 65Zn at the 1115.546 keV was counted according to the equation

Figure 5. Parts of the Gd2O2S:Pr,Ce spectrum. Cooling time of the sample is 6 days.
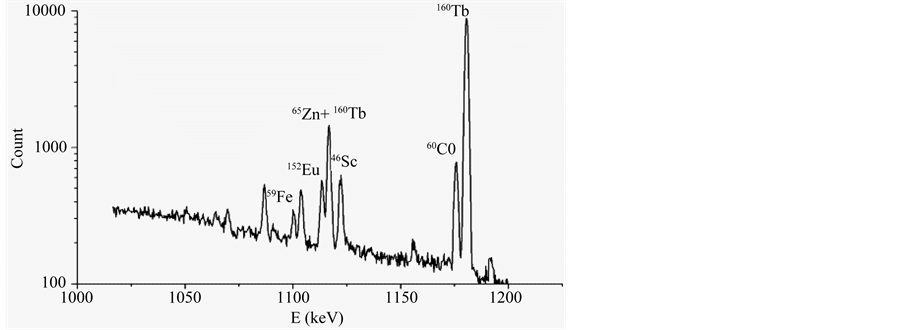
Figure 6. Part of the Gd2O2S:Pr,Ce spectrum. Cooling time of the sample is 20 days.
 , (5)
, (5)
where S1115 is the peak area in the spectrum of the sample, S2 is the peak area of 160Tb at the Eγ = 1177.954 keV in a spectrum of the sample, η1 and η2 are the registration efficiency of the HPGe-detector at the 1115.546 keV and 1177.954 keV, respectively. The V1 = 50.6% and V2 = 14.8694% are the relative intensities of the 1115.546 keV gamma ray of 65Zn and of the 1177.954 keV of 160Tb.
Mass concentration of Gd and Pr was measured with the k0-method and other elements were measured with the relative activation analysis technique in the analyzable samples. The analysis results of the sample and the nuclear characteristics [5] of the nuclides used to determine the concentrations are shown in the Table3
Specific activity of the radioactive isotope is calculated following equation:
 (6)
(6)
where
 is time factor. The minimum activity required to enable measurement with the desired
statistical precision to be taken can be estimated for example, following the equations
given by Gerhard Erdtmann [6] . He
calculated the limit quantitative determination as
is time factor. The minimum activity required to enable measurement with the desired
statistical precision to be taken can be estimated for example, following the equations
given by Gerhard Erdtmann [6] . He
calculated the limit quantitative determination as
 (7)
(7)
where Aq is the activity, which can be measured with a requisite precision. The Aq is calculated with
 , where kq is the reciprocal value of the requisite
relative standard deviation and σ0 is the standard deviation of the background
measurement. The determination limit of the trace and minor elements were calculated
with,
, where kq is the reciprocal value of the requisite
relative standard deviation and σ0 is the standard deviation of the background
measurement. The determination limit of the trace and minor elements were calculated
with,
![]() where ms is sample mass.
where ms is sample mass.
4. Results
Spectrum of the tested scintillation ceramics is shown in the Figure 7. The Gd2O2S:Pr,Ce ceramics spectrum has the characteristic spectral band at the wavelength of λmax = 513 nm (transition 3P0 → 3H4). The spectral band is Pr3+ emission in the matrix Gd2O2S:Pr,Ce.
The basic optical properties of the tested Gd2O2S:Pr,Ce ceramics are given in the Table4
Given in the Table 5 are the determination limits, reactions and the nuclear characteristics of the nuclides used to determine the concentrations of the 15 major, minor and trace elements, the conditions of irradiation, the cooling time and measurement time.
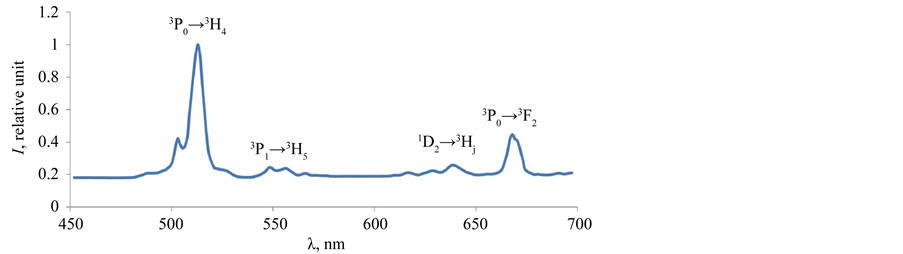
Figure 7. Spectrum of the Gd2O2S:Pr,Ce X-ray luminescent ceramics.
Table 3. Mass concentrations of determined elements measured with NAA technique in Gd2O2S:Pr,Ce samples.
Table 4. The characteristics of the tested Gd2O2S:Pr,Ce ceramics.
5. Conclusion
Table 5. The determination limits, reactions, irradiation conditions and the nuclear characteristics of the nuclides used to determine the concentrations of the 15 major, minor and trace elements. Reactor power is 17 MW. The fluxes at the sample irradiation positions are, respectively, thermal fth = 6.3 × 10¹³ s−1∙cm−2, epithermal fepi = 3.1 × 10¹² s−1∙cm−2 and fast ff = 4.1 × 10¹¹ s−1∙cm−2. Irradiation time is two hours.
Neutron activation analysis technique of the Gd2O2S:Pr,Ce scintillation ceramics was developed. The concentrations of As, Ce, Co, Cr, Cs, Eu, Fe, La, Sc, Tb, Zn, Zr, Pr, Gd, Na have been measured with the instrumental neutron activation analysis. Relative light yield (λmax = 513 nm) reduces when Ce content increases in the sam
Following designations are accepted in the table: The Еγ is gamma energy; p is isotopic abundance; σth is neutron radiative capture cross-section measured at 2200 m/sec; 1Neutron radiative capture cross section measured in a Maxwellian flux; I is resonance integral; T1/2 is half-life time; tcool is cooling time; tmeas is measurement time; γ-abn is the average number of gamma photons of energy Еγ per 100 decay events.
ple. The Gd2O2S:Pr,Ce has maximum value of the relative light yield (40%) at the Ce content about 10−5% in sample. Doping of Gd2O2S:Pr,Ce with Tb (~10−6%) leads to reducing the afterglow (0.045% - 0.055% after 5 ms and 0.001% afte 500 ms).
References
- Ito, Y., Yamada, H., Yoshida, M., Fujii, H., Toda, G., Takeuchi, H. and Tsukuda, Y. (1988) Hot Isostatic Pressed Gd2O2S:Pr,Ce,F Translucent Scintillator Ceramics for X-Ray Computed Tomography Detectors. Japanese Journal of Applied Physics, 27, L1371-1373. http://dx.doi.org/10.1143/JJAP.27.L1371
- Rossner, W., Ostertag, M. and Jermann, F. (1999) Properties and Applications of Gadolinium Oxysulfide Based Ceramic Scintillators. Electrochemical Society Proceedings (US), 98-24, 187-188.
- Firestone, R.B. (1998) Table of Isotopes [CD-ROM]. Lawrence Berkeley National Laboratory, Berkeley.
- Mughabghab, S.F. (2006) Atlas of Neutron Resonance, Resonance Parameters and Thermal Cross Sections, Part A Z = 1 – 100, Part B Z = 1 – 100. 5th Edition, Elsevier, Upton.
- (2013) Java-Based Nuclear Information Software 4.0. [CD-ROM]. The Nuclear Energy Agency, Paris.
- Erdtmann, G. and Petri, H. (1986) Nuclear Activation Analysis: Fundamentals and Techniques. In: Elving, P.J., Ed., Treatise on Analytical Chemistry (NY), Part 1, Vol. 14, 2nd Edition, John Wiley & Sons, Inc., Hoboken.
- De Corte, F. and De Wispelaere, A. (2005) The Use of a Zr, Au, Lu Alloy for Calibrating the Irradiation Facility in k0NAA and for General Neutron Spectrum Monitoring. Journal of Radioanalytical and Nuclear Chemistry, 263, 653-655. http://dx.doi.org/10.1007/s10967-005-0639-3