American Journal of Molecular Biology
Vol.4 No.1(2014), Article ID:41625,10 pages DOI:10.4236/ajmb.2014.41001
Diagnostic and prognostic value of plasma level of microRNA-92a in acute myeloid leukemia
1Department of Haematology, Faculty of Medicine, Alexandria University, Alexandria, Egypt
2Department of Clinical Pathology, Faculty of Medicine, Alexandria University, Alexandria, Egypt
Email: *amanisorour@hotmail.com
Received 27 October 2013; revised 18 November 2013; accepted 10 December 2013
ABSTRACT
Background: MicroRNAs (miRNAs) are short noncoding RNAs of ~21 to 23 nucleotides in length that post-transcriptionally regulate mRNA expression. Highthroughput methodologies have shown deregulated miRNA expression in an increasing number of human cancers. MiRNA expression patterns have been found to distinguish tumors of different developmental origin, even better than traditional mRNA expression profiling. Aim: To assess the plasma level of microRNA-92a in adult acute myeloid leukemia and to correlate it with prognostic factors and therapeutic response. Patients and Methods: This study was carried out on fifty AML patients as well as fifty healthy subjects as control. Conventional cytogenetics was performed on patients group only while measurement of the plasma level of miRNA-92a using TaqMan quantitative RT-PCR with miRNA-638 as endogenous reference for standardization and FLT3/ITD mutation was performed on patients and controls. Results: The differences in the ratio or relative quantitation (RQ) of plasma miRNa-92a to miRNA-638 in patients group to the control group have confirmed statistical significance. Also there was significant negative correlation between RQ of miRNA-92a and white blood count in patient group. Patients who achieved a response after induction chemotherapy had a mean RQ of miRNA-92a higher than non-responder with statistical significance. With regard to cytogenetics, favorable risk cytogenetics had meant RQ of miRNA-92a that was comparable to intermediate risk cytogenetics. While poor risk cytogenetics had a mean RQ which is significantly lower than both favorable and intermediate risk cytogenetics. Summary/Conclusions: Our data suggest the potential importance of the microRNA-92a as noninvasive cancer biomarkers helping in diagnosis, clinical prediction and therapeutic response.
Keywords:Acute Myeloid Leukemia; miRNAs; miRNA-92a; miRNA-638; Biomarker
1. INTRODUCTION
Acute myeloid leukemia (AML), the most frequent hematological malignancy in adults, is characterized by an accumulation and differentiation arrest of myeloid blasts in the bone marrow and blood that requires immediate treatment to prevent interference with the production of healthy white blood cells in the bone marrow. The French-American-British (FAB) classification system divides AML into 8 subtypes, M0 to M7, based on the type of cell from which the leukemia developed and the cell’s degree of maturity [1].
The single most important prognostic factor in AML is cytogenetics, which classifies AML into three risk-based categories: favorable, intermediate, and poor. The favorable prognosis, with a 5-year overall survival (OS) rate of 55%, is associated with AML patients carrying t (16; 16), t (15; 17) or t (8; 21). The intermediate subgroup has a 5-year OS rate ranging between 24% and 42% and includes patients with normal cytogenetics, trisomy 8 or t (9; 11). Patients with −5, −5q, −7, −7q, 11q23, t (3; 3), t (6; 9), t (9; 22) or complex cytogenetics are classified as having a poor prognosis, and the 5-year OS rate is only approximately 11% [2]. Characterization of transforming genetic events is becoming increasingly important in establishing diagnosis, defining prognosis, and planning therapy in AML. Advances in chemotherapy and supportive management have improved the survival of younger patients with AML. The current challenge is to improve understanding of molecular mechanisms of AML and design leukemia-specific treatments that would be applicable to older patients [3].
MicroRNAs (miRNAs) are small non-coding RNAs of 19 - 24 nucleotides in length that regulate gene expression by base pairing with the 39-untranslated region of a target gene’s mRNA, leading to degradation and/or translational repression of that gene [4].
MiRNAs have been implicated in many biological events, and their deregulation is associated with leukemogenesis. Many MiRNA expression studies have been performed to identify MiRNAs that are differentially expressed between normal and leukemic samples [5-7]. Recently, MiRNAs have been demonstrated to be present in serum or plasma in a stable and reproducible fashion, and the unique expression patterns of serum or plasma miRNAs can be used as fingerprints for various diseases [8,9].
MicroRNA expression has been linked to hematopoiesis and cancer [10,11]. In mice, the ectopic expression of miR-181 in hematopoietic progenitor cells led to the proliferation in the B-cell compartment [10]. Likewise, important roles for miRNAs have been found during human granulocytic, erythrocytic, and megakaryocytic differentiation [11-14]. The first report linking miRNAs and cancer involved chronic lymphocytic leukemia (CLL).
A cluster of 2 miRNAs, miR-15a and miR-16-1, was found to be located in the minimal region of deletion (~30 kb) at 13q14 and be deleted or down-regulated in approximately 60% of CLL samples [15]. The expression signatures of as few as two miRNAs could accurately discriminate acute lymphoblastic leukemia from AML [16].
In a study on 122 untreated adult AML cases using a microarray platform, it was demonstrated that a subset of miRNAs is clearly deregulated in AML and associated with cytogenetic groups and outcome [6].
Despite this knowledge, there is little information regarding microRNAs in plasma especially because microRNAs in plasma, if exist, were thought to be digested by RNase. Recent studies, however, have revealed that microRNAs exist and escape digestion in plasma [17]. So that trial to document the use of microRNAs as noninvasive method that may help in the diagnosis, prognosis and the plan of therapy in AML is justified.
2. SUBJECTS AND METHODS
The present study was conducted in the Department of Clinical Pathology Faculty of Medicine, Alexandria University, Egypt. Peripheral blood (PB) or bone marrow (BM) samples were obtained at AML diagnosis. Informed consent was obtained from patients and controls according to the Ethical Committee for Human Research in the Alexandria University Hospitals. Samples were collected from fifty patients diagnosed with AML from the Department of Hematology, Faculty of Medicine, Alexandria University, Egypt. They were collected over a period of 2 years; between May 2010 and May 2012, their age ranged from 18 to 60 years. The diagnosis of AML was obtained using the French-American-British (FAB) criteria after conventional cytochemical and surface marker analysis by flow cytometry which was performed only for patients in whom the diagnosis was not conclusive by morphology and cytochemistry. Control (PB) samples were obtained from fifty healthy subjects with matched age and sex and with no known malignancy. Patients group received only one cycle of induction chemotherapy (7 + 3 cycle) in the form of daunorubicin 45 mg/m2 intravenous (i. v) for 3 days and cytosine arabinoside 100 mg/m2 (i. v) over 24 hours daily for 7 days then assessment of the response was performed by bone marrow aspirate on day 28, counting from the start of induction chemotherapy.
Conventional cytogenetics was performed on patients group and the mutation of FMS-like tyrosine kinase 3(FLT3/ITD) was detected using polymerase chain reaction (PCR) for the internal tandem duplication (ITD) both in patients and control groups to determine the presence or absence of FLT3 mutations in normal individuals.
Measurement of the ratio of miRNA-92a to miRNA- 638 in the plasma samples from the AML patients comparing it with that from the control samples was carried out using TaqMan quantitative RTPCR [18].
2.1. Extraction of Total RNA
Total RNA isolation and small RNA enrichment using mirVana™ miRNA Isolation Kit (Applied Biosystems, Ambion, USA) was carried out according to the manufacturer’s instructions. The concentration and purity of RNA were measured at 260 & 280 & 230 nm using Nano Drop 2000/2000c Spectrophotometer (Thermo Scientific, USA). Ratio of A260/A280 = 1.8 - 2.1 and A260/A230 = 1.8 - 2.1 indicates highly pure RNA.
2.2. Quantitative Reverse Transcription PCR (QRT-PCR)
Extracted RNA was reverse transcribed into Complementary DNA (cDNA) using TaqMan® MicroRNA reverse Transcription Kit with miRNA-92a and miRNA 638 specific primers (Applied Biosystems, USA) according to the TaqMan MicroRNA Assay protocol. Reverse transcription was carried out in 15 µ reaction contained 10 ng of RNA samples. The reactions were incubated in (Biometrathermocycler) for 30 min at 16˚C, 30 min at 42˚C, 5 min at 85˚C and then held at 4˚C.
Real time PCR was performed using the Stratagene Mx3000P Sequence Detection System (Stratagene, USA). Real PCR was performed in 20 µl reaction mixture included 1.33 µl RT product, 10 µl TaqMan (NoUmpErase UNG) Universal PCR Master Mix and 1 µl of primers and probe mix and 7.67 µl Nuclease-free water according to TaqMan MicroRNA Assay protocol (PE, Applied Biosystems). Reactions were incubated at 95˚C for 10 min, followed by 40 cycles of 95˚C for 15 s and 60˚C for 10 min. MiRNA 638 was used as an endogenous reference for normalizing the expression levels of miRNA- 92a.
2.3. Data Analysis
The threshold cycle data (Ct) and baselines were determined using auto settings. The relative quantification of miRNA-92a expression was calculated using the comparative CT method (2–ΔΔCT) where ΔΔCT is the difference of ΔCT value between the leukemia and the control (ΔΔCT = ΔCT leukemia miRNA – ΔCT control miRNA), and ΔCT is the difference of CT value between the target (miRNA-92a) and endogenous reference (miRNA 638) (ΔCT = CT miRNA-92a – miRNA-638).
2.4. Statistical Analysis
After data were collected it was revised, coded and fed to statistical software SPSS version 16. The given graphs were constructed using Microsoft excel software.
Qualitative data were described using number and percentage. Association between categorical variables was tested using the chi-square test. When more than 20% of the cells had an expected count of less than 5, correction for chi-square was conducted using the Fisher’s exact test or Monte Carlo correction. Quantitative data were described using median, minimum, and maximum as well as mean and standard deviation. The distributions of quantitative variables were tested for normality using the Kolmogorov-Smirnov test, and the Shapiro-Wilk test. The D’Agstino test was used if there was a conflict between the results of the two previous tests. If it reveals normal data distribution, parametric tests were applied. If the data were abnormally distributed, nonparametric tests were used.
For abnormally distributed data, the Mann-Whitney Test (for data distribution that was significantly deviated from normal) was used to analyze two independent populations, and Krusal-Wallis teat: used to compare more than two groups for qualitative variables.
Significance test results are quoted as two-tailed probabilities. Significance of the obtained results was judged at the 5% level.
Correlation analysis: the Spearman correlation co-efficient (rho) is expressed as Pearson co efficient. The sign of the co-efficient indicates the strength of relation (positive/negative) while the value indicates the strength of the relation as follows: weak correlation for rho less than 0.25, intermediate correlation between 0.25 - 0.74 and strong correlation for value between 0.75 - 0.99.
3. RESULTS
This study was carried out on fifty subjects with acute myeloid leukemia as patients group and fifty healthy subjects as a control group.
3.1. Haematological Profile
Hemoglobin level in AML patients group ranged from 3.50 to 12.00 gm/dl with a mean of 8.04 ± 2.42, while in control group it ranged from 12.00 to 16.00 gm/dl with a mean of 13.50 ± 1.15, there was a significant decrease in hemoglobin level in the patients group than in the control group. (p = 0.000), the WBCs count in the AML patients group ranged from 6.50 to 180.00 (× 109/L) with a mean of 48.86 ± 47.32, while in the control group it ranged from 4.00 - 10.00 (× 109/L) with a mean of 6.88 ± 1.87, there was a significant increase of WBCs in patient group than control group (p = 0.000). The platelet count in AML patients group ranged from 4.00 to 160.00 (× 109/L) with a mean of 37.32 ± 38.43, while in control group it ranged from 156.00 to 350.00 × 10⁹/L with a mean of 233.00 ± 61.05, there was a significant decrease in platelet count in patient group than in control group (p = 0.000).
3.2. FAB Subtypes in AML Patients
16 cases (32.0%) were FAB M2, 8 cases (16.0%) were FAB M3, 8cases (16.0%) were FAB M4, 6 cases (12.0%) were FAB M1, 4 cases (8.0%) were FAB M0, 4 cases (8.0%) were FAB M5a, and 4 cases (8.0%) were FAB M6 while there were no cases with FAB M5b or M7 (Table 1).
3.3. Conventional Cytogenetic in AML Patients
Conventional cytogenetic in AML patients showed normal karyotype in 24 cases (48.0%), t (15; 17) was found in 8 cases (16.0%) each with FAB M3, t (8; 21) in 6 cases (12.0%) each with FAB M2, t (16; 16) in 4 cases (8.0%) each with FAB M4, t (9; 11) was found in 2 cases with FAB M5a , trisomy 21 was present in 2 cases with FAB M1, deletion of chromosome 5 in 2 cases with FAB M0 while trisomy 8 was found in 2 cases with FAB M2 (Table 1).
3.4. FLT3-ITD Mutation Analysis in AML Patients
FLT3-ITD+ was detected in 16 cases (32.0%) while it

Table 1.Distribution of FAB subtypes and cytogenetic in AML patients group.
was absent (FLT3-ITD-) in the other 34 cases (68.0%).
3.5. Response to Induction Chemotherapy in AML Patients
Regarding the response to induction chemotherapy in AML patients after treatment it was found that there was 34 cases (68.0%) in complete remission (CR), while 6 cases (12.0%) were in partial remission (PR), and 10 cases (20.0%) were resistant to induction chemotherapy; non responder (NR).
3.6. Plasma Level of miRNA-92a & Its Correlation to Studied Parameters
Regarding the Plasma level of miRNA-92a the relative quantitation (RQ) of miRNA-92a to miRNA-638 (internal control) in AML patients group had a mean of 0.239 ± 0.286 while in control group it had a mean of 0.969 ± 0.490 this confirmed statistical significance (p = 0.000) (Figure 1).
Correlations of plasma level of miRNA-92a in AML patients showed that there was significant negative correlation between RQ of miRNA-92a and white blood count in patient group (p = 0.000).
Also a negative correlation was found between RQ of miRNA-92a and bone marrow blast percentage (%) on
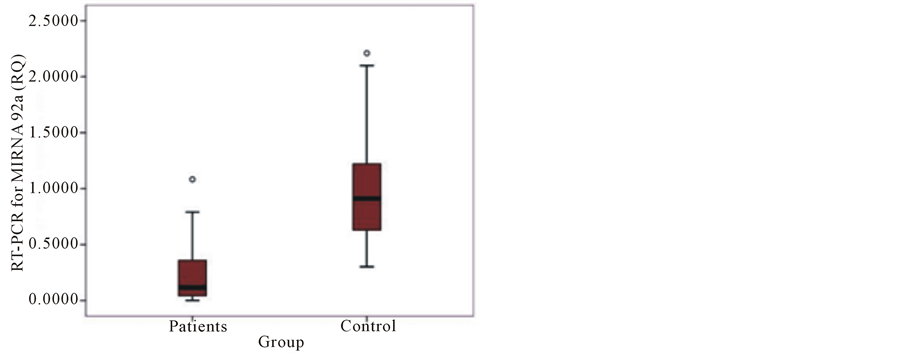
Figure 1. Comparison of the ratio of miRNA92-a signal intensity to miRNA-638 signal intensity by TaqMan qRT-PCR among the plasma of patients and controls.
admission but this was with no statistical significance (p = 0.395).
In regard to cytogenetic, favorable risk cytogenetic in 18 cases had mean RQ of miRNA-92a = 0.233 ± 0.393 that was comparable to intermediate risk cytogenetic in 30 cases, this had a mean of RQ = 0.258 ± 0.217. While poor risk cytogenetic in two cases {−5} had a mean of RQ = 0.001 which is significantly lower than both favorable and intermediate risk cytogenetic (p = 0.050) (Table 2).
Regarding the correlation of plasma miRNA-92a to the FAB subtype, the lowest mean RQ of miRNA-92a was with FAB subtype M0 (0.036 ± 0.044) while the highest mean was with FAB subtype M6 (0.486 ± 0.429).There was no significant correlation between RQ of miRNA-92a and FAB subtype (p = 0.334) (Table 3).
AML patients with FLT3-ITD+ have a mean RQ of miRNA-92a = 0.337 ± 0.313 while patient FLT3-ITD− have a mean RQ of miRNA-92a = 0.192 ± 0.269, there was no significant correlation (p = 0.322).
In patients with FLT3-ITD+ and normal karyotype, the mean RQ of miRNA-92a was 0.36 ± 0.30 while it was 0.23 ± 0.16 in patients with FLT3-ITD− and normal karyotype, there was no significant correlation (p = 0.396).
AML patients who achieved complete response after induction chemotherapy had a mean RQ higher than non-responders (0.274 ± 0.322 versus 0.073 ± 0.077 respectively) but with no statistical significance (p = 0.212). However, when patients with complete and partial response were grouped together (mean RQ of miRNA-92a = 0.28 ± 0.30) and compared to non-responders, a statistical significance is revealed; (p = 0.048) (Table 4).
4. DISCUSSION
As miRNA-92a is expressed in the majority of cells at all times, its expression profiles will form a reliable part
Table 2 . Correlation study between plasma miRNA-92a and cytogenetic in AML patients group.
X2: Kruskal-Wallis test; *p < 0.05 (significant).
of diagnosis and detection of disease [17].
The search for noninvasive tools for diagnosis and management of cancer is extremely important for reducing the world wide health burden of cancer. MiRNAs show potential as biomarkers and can even be found circulating in the serum. Some circulating miRNAs are specific to tumor patients, while miRNA-92 on the otherhand is present in healthy individuals in the serum but levels are variable and appear to change in response to the onset of some cancers [19].
The aim of the present study was the assessment of plasma level of mirRNA-92a in adult AML and its correlation with other prognostic factors and to the therapeutic response. This study was carried out on fifty subjects with AML admitted to Hematology unit in Alexandria Main University Hospital as patients group as well as fifty healthy subjects of matched age as a control group.
As regard to FAB subtypes, 16 cases (32.0%) were of FAB M2, 8 cases (16.0%) were of FAB M3, 8 cases (16.0%) were FAB M4, 6 cases (12.0%) were FAB M1, 4 cases (8.0%) were FAB M0, 4 cases (8.0%) were FAB M5a, and 4 cases (8.0%) were FAB M6 while no cases with FAB M5b or M7. The British study carried out by Bennet et al. [20], showed similar distribution of AML cases, FAB M1 20%, FAB M2 30%, FAB M3 10%, FAB M4 25%, FAB M5 10% and FAB M6 5%. The results of a study [21] done on similar patients from Alexandria and nearby provinces showed that FAB M1 15.2%, FAB M2 39.2%, FAB M3 3.8%, FAB M4 16.5%, FAB M5 24%, and FAB M7 1.3%. It is clear from the current study as well as previous studies that FAB M2 has the highest distribution followed by FAB M4.
Cytogenetic analysis with metaphase cytogenetic is a key component to the evaluation of all patients with newly diagnosed or suspected AML. As such, the 2008 WHO classification of tumors of the hematopoietic and lymphoid tissues uses genetic findings in addition to morphologic, immunophenotypic, and clinical features to define distinct subtypes of AML. In addition to establishing the type of AML, specific cytogenetic abnormalities have diagnostic, prognostic and therapeutic importance. The first descriptions of karyotypic changes in AML occurred in the 1960s; approximately half of patients with AML were found to have cytogenetic abnormalities in the 1970s, when studies using banding were carried out. With technical improvements, recent studies have reported abnormal karyotypes in 55% to 78% of adults with AML [22].
Cytogenetic abnormalities in AML can be classified into three groups; favorable risk group: with favorable outcome and usually younger age group. It includes t (15; 17), t (8; 21), t (16; 16), and inversion of chromosome 16, unfavorable risk group: with unfavorable outcome and common in the elderly. It includes monsomies and deletion in log arms of chromosomes 5 and 7, as well as abnormalities that involve three or more chromosomes (complex karyotype) and intermediate risk group: accounts for 50% - 60% of AML patients. It includes normal karyotype, +8, +21, +22 and t (9; 11) [23].
Our data showed that normal karyotype was found in (48.0%), t (15; 17) was found in (16.0%) each with FAB M3, t (8; 21) in (12.0%) each with FAB M2, t (16; 16) in (8.0%) each with FAB M4, t (9; 11) in 2 cases with FAB M5a, trisomy 21 in 2 cases with FAB M1, deletion of chromosome 5 in 2 cases with FAB M0 while trisomy 8 in 2 cases with FAB M2.
A number of independent studies in Japan, Europe, and the United States have established that the prevalence of FLT3/ITD+ mutations is as high as 34% in AML. Patients with AML with FLT3/ITD+ mutations are consistently characterized as having higher than normal peripheral leucocyte counts and a higher frequency of normal cytogenetic [24].
FLT3-ITD+ in the present study was detected in16 cases (32.0%) while it was not detected in the other 34 cases (68.0%). Eight of the detected cases were of nor
Table 3 .Correlations of plasma miRNA-92a to cytogenetic, FAB subtypes, response to induction chemotherapy and FLT3/ITD in AML patients.
X2: Kruskal-Wallis test; Z: Mann-Whitney test.
Table 4. Correlation of plasma miRNA-92a and response to induction chemotherapy in AML patients group.
Z: Mann-Whitney test for two independent groups; *p < 0.05 (significant).
mal cytogenetic, presenting 33.33% of this group while the other 8 cases were detected in patients with abnormal karyotype presenting 30.7% of them. These findings are similar to a study carried out by Frohling et al. [25] who reported that the frequency of FLT3-ITD+ was 22.8% among AML patients, with a frequency of 31.7% in patients having normal cytogenetic.
In the present study, after induction chemotherapy in the form of daunorubicin 45 mg/m2 (i. v) for 3 days and cytosine arabinoside 100 mg/m2 (i. v) over 24 hours daily for 7 days with addition of ATRA 45 mg/m2 daily to patients with FAB M3 subtype (8 cases), it was found that 17 cases (68.0%) achieved complete remission (CR), while 6 cases (12.0%) were in partial remission (PR), and 10 cases (20.0%) were resistant to induction chemotherapy or non-responders (NR). This agreed with Lowenberg et al. [26] who reported that anthracyclines (daunorubicin, idarubicin) and cytarabine have been the cornerstones of remission induction therapy for adult AML with some variety, most centers apply treatment schedules based on these drugs and these combinations induce complete remission in an average of 70% to 80% of adults aged less than 60 years.
Also Solomons et al. [27] reported that the (7 + 3) regimen results in complete remission rates of approximately 60% to 80% in patients younger than 60 years of age.
On the other hand, in a study carried out on 30 patients with de novo AML in Alexandria [28], it was found that complete remission occurred in 17 patients (56.6%), partial remission occurred in 4 patients (13.3), and no significant response occurred in 9 patients (30%). The slight difference between this study and our study may be attributed to different age distribution, with younger age group in our study.
Cheson et al. [29] has established response criteria as follow: Complete remission required presence of platelet count more than 100 × 109/L, a bone marrow that has <5% blasts in 20% or more cellular marrow and absent extramedullary leukemia. Partial remission includes all of the criteria for complete remission except that bone marrow has 5% - 20% blasts or less than 5% blasts with auer rods or myeloid cells with abnormalities unrelated to chemotherapy.
In the present study, qRT-PCR for the plasma miRNA-92a presented as ratio or relative quantitation (RQ) of miRNA-92a (target miRNA) to miRNA-638(internal control, as miRNA-638 is an miRNA that seems to have a consistent presence in human blood plasma and may be physiologically necessary).[20] Comparison of the ratio of miRNA-92a signal intensity (0.239 ± 0.286) to miRNA-638 signal intensity by TaqMan qRT-PCR among the plasmas of AML and control samples (0.969 ± 0.490) determined statistical significance difference (p = 0.000) this confirmed downregulation in plasma of miRNA-92a in AML patients This result was in agreement with the study carried out by Tanaka et al. [17] on the plasma samples from normal (n = 16) and leukemia (AML, n = 54; ALL, n = 7) by TaqMan qRT-PCR. They reported that miRNA-638 is stably present in human plasmas, and miRNA-92a dramatically decreased in the plasmas of acute leukemia patients. The ratio of miRNA-92a/miRNA-638 in plasma, in particular, was very useful for distinguishing leukemia patients from healthy subjects.
They concluded that down-regulation of miRNA-92a in human plasma is a novel marker for acute leukemia patients. Moreover, they found that miRNA-92a is strongly expressed in the leukemia cells themselves with no expression detected in normal blasts (in situ hybridization).
It seems that there is an inverse relationship between leukemia cell miRNA-92 levels and blood plasma miRNA- 92 levels in patients with leukemia and this discrepant expression is attributed to the fact that miRNA-92a is an essential molecule for proliferation of cells, and cancer cells both actively transcribe miRNA-92a and take in miRNA-92a from the blood.
Exosomes are small (50 - 90 nm) membrane vesicles of endocytic origin that are released into the extracellular environment on fusion of multivesicular bodies (MVB) with the plasma membrane [30]. Many cells including reticulocytes [31], dendritic cells, B cells, T cells, mast cells, epithelial cells and tumor cells [32] have the capacity to release exosomes, and exosomes contain both mRNAs and microRNAs, which can be delivered to another cell and function in a new location [33]. In addition, endogenous plasma microRNAs exist in a form that is resistant to RNase activity in plasma [34]. These studies suggested that microRNAs are packaged inside exosomes that are secreted from cells. Thus, it might be possible that leukemic cells specifically take in the exosome that contain miRNA-92a and, as a result, miRNA- 92a decreases from the blood. As an alternative explanation, leukemic cells may specifically digest miRNA-92a in the plasma directly or indirectly [19].
Another study [35] with similar results performed on AML patients over the age of 40 in Egypt, established that the ratio of miRNA-92a/miRNA-638 in plasma by qRT-PCR in AML patients on admission ranged from 0.0010 - 1.914, with a mean value of 0.3729 ± 0.5055 which was much lower than the healthy control group in which ratio of miRNA-92a/miR-638 in plasma ranged from 0.1250 - 2.5400 with a mean value of 1.0522 ± 0.7613. This means that there was significant reduction of plasma level of microRNA-92a in AML patients.
Several methods, such as northern blot [36], beadbased flow cytometry, [37] microarray, quantitative realtime PCR (qRT-PCR) [38], and deep sequencing [39] have been developed to measure miRNA expression. Of these methods, Mestdagh P et al. [40] reported that qRTPCR is superior due to its high sensitivity, specificity and reproducibility. While other methods, such as microarray, require a larger amount of RNA sample (usually more than 1 μg), qRT-PCR requires less RNA input, where even as little as a single cell can be used for profiling. Since the expression levels of circulating miRNAs are very low, qRT-PCR is well adapted for analyzing circulating miRNAs profiles because of its sensitivity. In addition, Kozomara A and Griffiths-Jones S found approximately 1900 mature miRNAs in human genome [41].
As qRT-PCR is easily adapted to 384-well plates, it is possible to carry out high-throughput screening [42].
There was significant negative correlation in the current study between RQ of miRNA-92a and white blood count in patient group (p = 0.000). Also a negative correlation was found between RQ of miRNA-92a and bone marrow blast percent on admission but this didn’t reach statistical significance (p = 0.395). This can be explained by the increase in white blood count in AML which is usually caused by the increase in blast cells that take in the exosomes that contain miRNA-92a and, as a result, miRNA-92a decreases more from the blood correlated with the increase in white blood cells.
Cytogenetic analysis showed that, favorable risk cytogenetic found in 18 cases with a mean RQ of miRNA-92a = 0.233 ± 0.393. The intermediate risk cytogenetic was found in30 cases, and had a mean RQ = 0.258 ± 0.217. Poor risk cytogenetic was found in 2 cases {−5} with a mean RQ = 0.001 which is significantly lower than both favourable and intermediate risk cytogenetic (p = 0.050).
High rate of uncontrolled proliferation in poor risk cytogenetic relative to favorable and intermediate risk cytogenetic can explain the more intake of the exosomes which contain miRNA-92a and therefore significantly decreases plasma level of miRNA-92a.
As regard to the correlation of plasma miRNA-92a to the FAB subtypes in the current study, the lowest mean RQ of miRNA-92a was found with FAB subtype M0 (0.036 ± 0.044) while the highest mean was found with FAB subtype M6 (0.486 ± 0.429).There was no significant correlation between RQ of miRNA-92a and FAB subtype (p = 0.334). Further study on a higher number of patients is recommended.
Regarding correlation to FLT3-ITD, in the present study, patients withFLT3-ITD+ have a mean RQ of miRNA-92a = 0.337 ± 0.313 while patient FLT3-ITD− have a mean RQ of miRNA-92a = 0.192 ± 0.269, there was no significant correlation (p = 0.322). In patients with FLT3-ITD+ and normal karyotype, the mean RQ of miR-92a was 0.36 ± 0.30 while it was 0.23 ± 0.16 in patients with FLT3-ITD− and normal karyotype, also there was no significant correlation (p = 0.396).
Patients who achieved complete response after induction chemotherapy had a mean RQ of miRNA-92a higher than non-responders (0.274 ± 0.322 versus 0.073 ± 0.077 respectively) but it didn’t reach statistical significance (p = 0.212).
However, when patients with complete and partial response grouped together (mean RQ of miRNA-92a = 0.28 ± 0.30) and when compared to non-responders, a statistical significance is revealed (p = 0.048).This findings suggest that the low plasma level of miRNA-92a is associated with resistance to induction chemotherapy and therefore, poor prognosis. This is a novel finding in our study.
5. CONCLUSION
To conclude our study showed that there was a down regulation of miRNA-92a in the plasma of AML patients compared to healthy control and this down regulation is associated with poor response to induction chemotherapy regimen and poor risk cytogenetic group. However, there was no significant correlation between the ratio of miRNA92a/miRNA-638 and FLT3/ITD+ mutation, FAB subtypes or bone marrow blast cells percentage on admission.
CONFLICT OF INTERESTS
The authors hereby declare that they have no conflicts of interest.
This research was completely funded by the authors.
All the authors of this paper have no financial relationship with the organization where the research was carried out.
REFERENCES
- Tefferi, A., Thiele, J. and Vardiman, J.W. (2009) The 2008 world health organization classification system for myeloproliferative neoplasms: Order out of chaos. Cancer, 115, 3842-3847. http://dx.doi.org/10.1002/cncr.24440
- Gregory, T.K., Wald, D., Chen, Y., Vermaat, J.M., Xiong, Y., et al. (2009) Molecular prognostic markers for adult acute myeloid leukaemia with normal cytogenetics. Journal of Hematology & Oncology, 2, 23. http://dx.doi.org/10.1186/1756-8722-2-23
- Suhag, V., Solomon, S. and Malkovska, V. (2005) Acute myelogenous leukemia. In: Rodgers, P. and Young, N., Eds., Bethesda Handbook of Clinical Hematology, Lippincott Williams &Wilkins, New York, 131-147.
- Bartel, D.P. (2009) MicroRNAs: Target recognition and regulatory functions. Cell, 136, 215-233. http://dx.doi.org/10.1016/j.cell.2009.01.002
- Marcucci, G., Radmacher, M.D., Maharry, K., Mrozek, K., Ruppert, A.S., et al. (2008) MicroRNA expression in cytogenetically normal acute myeloid leukemia. New England Journal of Medicine, 358, 1919-1928. http://dx.doi.org/10.1056/NEJMoa074256
- Garzon, R., Volinia, S., Liu, C.G., Fernandez-Cymering, C., Palumbo, T., et al. (2008) MicroRNA signatures associated with cytogenetics and prognosis in acute myeloid leukemia. Blood, 111, 3183-3189. http://dx.doi.org/10.1182/blood-2007-07-098749
- Jongen-Lavrencic, M., Sun, S.M., Dijkstra, M.K., Valk, P.J. and Lowenberg, B. (2008) MicroRNA expression profiling in relation to the genetic heterogeneity of acute myeloid leukemia. Blood, 111, 5078-5085. http://dx.doi.org/10.1182/blood-2008-01-133355
- Chen, X., Ba, Y., Ma, L., Cai, X., Yin, Y., et al. (2008) Characterization of microRNAs in serum: A novel class of biomarkers for diagnosis of cancer and other diseases. Cell Research, 18, 997-1006. http://dx.doi.org/10.1038/cr.2008.282
- Mitchell, P.S., Parkin, R.K., Kroh, E.M., Fritz, B.R., Wyman, S.K., et al. (2008) Circulating microRNAs as stable blood-based markers for cancer detection. Proceedings of the National Academy Science of USA, 105, 10513-10518. http://dx.doi.org/10.1073/pnas.0804549105
- Chen, C.Z., Li, L., Lodish, H. and Bartel, D. (2004) MicroRNAs modulate hematopoietic lineage differentiation. Science, 303, 83-86. http://dx.doi.org/10.1126/science.1091903
- Lu, J., Getz, G., Miska, E.A., et al. (2005) MicroRNA expression profiles classify human cancers. Nature, 435, 834-838. http://dx.doi.org/10.1038/nature03702
- Fazi, F., Rosa, A., Fatica, A., et al. (2005) A mini-circuitry comprising microRNA-223 and transcription factors NFI-A and C/EBPa regulates human granulopoiesis. Cell, 123, 819-831. http://dx.doi.org/10.1016/j.cell.2005.09.023
- Felli, N., Fontana, L., Pelosi, L., et al. (2005) MicroRNAs 221 and 222 inhibit normal erythropoiesis and erythroleukemic cell growth via kit receptor down-modulation. Proceedings of the National Academy Science of USA, 102, 18081-18086. http://dx.doi.org/10.1073/pnas.0506216102
- Garzon, R., Pichiorri, F., Palumbo, T., et al. (2006) MicroRNAs fingerprints during human megakaryocytopoiesis. Proceedings of the National Academy Science of USA, 103, 5078-5083. http://dx.doi.org/10.1073/pnas.0600587103
- Calin, G.A., Dumitru, C.D., Shimizu, M., et al. (2002) Frequent deletions and down-regulation of micro-RNA genes miR-15 and miR-16 at 13q14 in chronic lymphocytic leukemia. Proceedings of the National Academy Science of USA, 99, 15524-15529. http://dx.doi.org/10.1073/pnas.242606799
- Mi, S., Lu, J., Sun, M., Li, Z., Zhang, H., Neilly, M.B., Wang, Y., Qian, Z., Jin, J., Zhang, Y., Bohlander, S.K., Le Beau, M.M., Larson, R.A., Golub, T.R., Rowley, J.D. and Chen, J. (2007) MicroRNA expression signatures accurately discriminate acute lymphoblastic leukemia from acute myeloid leukemia. Proceedings of the National Academy Science of USA, 104, 19971-19976. http://dx.doi.org/10.1073/pnas.0709313104
- Tanaka, M., Oikawa, K., Takanashi, M., Kudo, M., Ohyashiki, J., et al. (2009) Down-regulation of miR-92 in human plasma is a novel marker for acute leukemia patients. PLoS One, 4, e5532. http://dx.doi.org/10.1371/journal.pone.0005532
- Livak, K.J. and Schmittgen, T.D. (2001) Analysis of relative gene expression data using real-time quantitative PCR and the 2−ΔΔCT methods. Methods, 25, 402-408.
- Smith, M.A., Gurnew, J.G., et al. (1995) Cancer incidence and survival amongchildren and adolescence: United States SEERProgram 1975-1995. NIH Pub 99-4649. National Cancer Institute, SEER Program: Bethesda MD.
- Bennett, J.M., Catovsky, D., Dariel, M.T., Flandrin, G., Galton, D.A., Gralnick, H.R., et al. (1985) Proposed revised criteria for the classification of acute myeloid leukemia: A report of FAB cooperative group. Annals of Internal Medicine, 103, 626-629.
- Grimwade, D., Walker, H., Harrison, G., et al. (2001) The predictive value of hierarchical cytogenetic classification in older adults with AML: Analysis of 1065 patients entered into the UK medical research council AML 11 trial. Blood, 1, 1312-1320. http://dx.doi.org/10.1182/blood.V98.5.1312
- Kaushansky, K., Lichtman, M., Beutler, E., Kipps, T., Seligsohn, V. and Prchal, J. (2010) Acute myelogenous leukemia in Williams hematology. 8th Edition, 89, Mc Graw Hill, 1930-1998.
- Whitman, S.P., Archer, K.J., Feng, L., et al. (2001) Absence of the wild-type allele predicts poor prognosis in adult de novo acute myeloid leukemia with normal cytogenetics and the internal tandem duplication of FLT3: A cancer and leukemia group B study. Cancer Research, 61, 7233-7239.
- Frohling, S., Schlenk, R.F., Breitruck, J., et al. (2002) Prognostic significance of activating FLT3 mutations in younger adults (16 to 60) with acute myeloid leukemia and normal cytogenetic: A study of AML study group. Blood, 99, 4372-4380. http://dx.doi.org/10.1182/blood-2002-05-1440
- Lowenberg, B., Putten, W., Theobald, M., Gmuer, J., Verdonck, L.F., Sonneved, P., et al. (2003) Effect of priming with granulocyte-colony-stimulating factor on outcome of chemotherapy fot AML. New England Medcine, 349, 743-752. http://dx.doi.org/10.1056/NEJMoa025406
- Soloman, S. and Malkovska, V. (2005) Acute myelogenous leukemia. In: Rodgers, P. and Young, N., Eds., Bethesda Handbook of Clinical Hematology, Lippincott Williams &Wilkins, 135, 150.
- Cheson, B.D., Cassileth, P.A., Head, D.R., et al. (l999) Report of the national cancer institute-sponsored workshop on definitions and response in acute myeloid leukemia. Journal of Clinical Oncology, 8, 813.
- Farag, N. (2007) Study of NAD (P) H: Quinone oxireductase-1 gene polymorphism and cytogenetics studie in acute myeloid leukemia in correlation to treatment and prognosis. (MD) Thesis. Alexandria University.
- Van-Niel, G., Porto-Carreiro, I., Simoes, S. and Raposo, G. (2006) Exosomes a common pathway for a specialized function. Journal of Biochemistry, 140, 13-21. http://dx.doi.org/10.1093/jb/mvj128
- Pan, B.T. and Johnstone, R.M. (2003) Fate of the transferrin receptor during maturation of sheep reticulocytes in vitro: Selective externalization of the receptor. Cell, 33, 967-978. http://dx.doi.org/10.1016/0092-8674(83)90040-5
- Mears, R., Craven, R.A., Hanrahan, S., Totty, N., Upton, C., et al. (2004) Proteomicanalysis of melanoma-derived exosomes by two-dimensional polyacrylamide gelelectrophoresis and mass spectrometry. Proteomics, 4, 4019- 4031. http://dx.doi.org/10.1002/pmic.200400876
- Valadi, H., Ekstrom, K., Bossios, A., Sjostrand, M., Lee, J.J., et al. (2007) Exosome mediated transfer of mRNAs and micro RNAs is a novel mechanism of geneticexchange between cells. Nature Cell Biology, 9, 654-659. http://dx.doi.org/10.1038/ncb1596
- Mitchell, P.S., Parkin, R.K., Kroh, E.M., Fritz, B.R., Wyman, S.K., et al. (2008) Circulating microRNAs as stable blood-based markers for cancer detection. Proceedings of the National Academy Science of USA, 105, 10513-10518. http://dx.doi.org/10.1073/pnas.0804549105
- Morsy, M. (2012) Plasma level of micro-RNA 92a in acute myeloid leukemia patients over forty years old. (MS) Thesis on Press, Alexandria University.
- Valoczi, A., Hornyik, C., Varga, N., Burgyan, J., Kauppinen, S. and Havelda, Z. (2004) Sensitive and specific detection of micro RNAs by northern blot analysis using LNA-modified oligonucleotide probes. Nucleic Acids Research, 32, 175-183. http://dx.doi.org/10.1093/nar/gnh171
- Lu, J., Getz, G., Miska, E.A., Alvarez-Saavedra, E., Lamb, J., Peck, D., et al. (2005) Micro RNA expression profiles classify human cancers. Nature, 435, 834-838. http://dx.doi.org/10.1038/nature03702
- Fichtlscherer, S., De-Rosa, S., Fox, H., Schwietz, T., Fischer, A., Liebetrau, C., et al. (2010) Circulating microRNAs in patients with coronary artery disease. Circulation Research, 107, 677-684. http://dx.doi.org/10.1161/CIRCRESAHA.109.215566
- Yang, H., Schmuke, J.J., Flagg, L.M., Roberts, J.K., Allen, E.M., Ivashuta, S., et al. (2009) A novel real-time polymerase chain reaction method for high throughput quantification of small regulatory RNAs. Plant Biotechnology Journal, 7, 621-630. http://dx.doi.org/10.1111/j.1467-7652.2009.00429.x
- Wu, Q., Lu, Z., Li, H., Lu, J., Guo, L. and Ge, Q. (2011) Next-generation sequencing of micro RNAs for breast cancer detection. Journal of Biomedicine and Biotechnology, 597, 145-152.
- Mestdagh, P., Feys, T., Bernard, N., Guenther, S., Chen, C., Speleman, F., et al. (2008) High-throughput stemloop RT-Qpcr mi RNA expression profiling using minute amounts of input RNA. Nucleic Acids Research, 36, 143- 151. http://dx.doi.org/10.1093/nar/gkn725
- Kozomara, A. and Griffiths-Jones, S. (2011) MiRBase: Integrating micro RNA annotation and deep-sequencing data. Nucleic Acids Research, 39, 152-157. http://dx.doi.org/10.1093/nar/gkq1027
- Kang, K., Peng, X., Jun, L. and Deming, G. (2012) Identification of circulating miRNA biomarkers based on global quantitative real-time PCR profiling. Journal of Animal Science and Biotechnology, 3, 4-5.
NOTES
*Corresponding author.