Journal of Encapsulation and Adsorption Sciences
Vol.04 No.02(2014), Article ID:47184,15 pages
10.4236/jeas.2014.42005
Adsorption of 5.5’-Disulfonicindigotin (5.5’-DI) onto Green Coconut Fiber (Cocos nucifera L.): Kinetic and Isotherms
Lívia F. Zeferino1, Ivanise Gaubeur2, Maria E. V. Suárez-Iha3, Patricia A. M. Freitas1*
1Centro Universitário do Instituto Mauá de Tecnologia, Escola de Engenharia Mauá, São Caetano do Sul, Brazil
2Centro de Ciências Naturais e Humanas, Universidade Federal do ABC, Santo André, Brazil
3Escola de Engenharia, Universidade Presbiteriana Mackenzie, São Paulo, Brazil
Email: *pantonio@maua.br
Copyright © 2014 by authors and Scientific Research Publishing Inc.
This work is licensed under the Creative Commons Attribution International License (CC BY).
http://creativecommons.org/licenses/by/4.0/


Received 13 April 2014; revised 16 May 2014; accepted 16 June 2014
ABSTRACT
Green coconut fiber (Cocos nucifera L.) has been largely used in solid-phase extraction. The effect of the initial dye concentration (1.91, 3.02 and 4.02) × 10−5 mol∙L−1 and solid phase contact (SPE) time were evaluated at different temperatures (283, 298 and 313) K at pH 2. Kinetic experimental data were applied to three simplified kinetic models: pseudo-first order, pseudo-second order, and intraparticle diffusion. The adsorption of 5.5’-DI onto the solid phase showed excellent fit to the pseudo-second order model. At 283, 298 and 313 K the maximum sorption, qmax,exp, for the lowest initial concentration (Co = 1.91 × 10⁻⁵ mol∙L−1) of 5.5’-DI were (5.01, 5.24 and 6.14) × 10−4 g∙g−1; for Co = 3.02 × 10⁻⁵ mol∙L−1 (0.93, 1.01 and 1.03) × 10−3 g∙g−1 and for Co = 4.02 × 10⁻⁵ mol∙L−1 (1.32, 1.40 and 1.49) × 10−3 g∙g−1, respectively. The adsorption of 5.5’-disulfonicindigotin (5.5’-DI) onto green coconut fiber has been investigated and the experimental equilibrium data were fitted to the Langmuir, Freundlich and Dubinin-Radushkevich models at different temperatures (283, 298 and 313) K. The evaluation of the mean sorption energy characterized the adsorption as physical and the adsorbent surface energetically homogeneous (n < 1). Thermodynamic studies show adsorption process to be endothermic ΔHo (+11.6 kJ∙mol−1) and spontaneous ΔGo (−9.7 kJ∙mol−1 at 283 K, −10.8 kJ∙mol−1 at 298 K and −11.9 kJ∙mol−1 at 313 K).
Keywords:
5.5’-Disulfonicindigotin, Green Coconut, Isotherm and Kinetic Modeling

1. Introduction
Coconut palm is cultivated in more than 90 tropical countries and it represents an important source of income [1] . Approximately 60 million tons of coconut (Cocos nucifera L.) were produced worldwide in 2010: 85% in Asia, 8.5% in the Americas, 2.9% in Africa and 3.2% in Oceania [2] [3] . The whole coconut tree may be used, but the main products are obtained from the fruit such as copra and oil, coconut milk, lauric acid, fiber, flour and coconut water (from immature fruit). These main products have several applications, e.g. composites, soaps, beverages, animal feed, detergents and cosmetics [4] .
Green coconut husk is an agricultural residue whose high potential for use has yet to be explored in Brazil [5] . This residue corresponds to about 85% of the fruit and has become a serious environmental problem due to its slow degradation [6] and large volume of waste generated and discarded into landfills in Brazil. The decomposi- tion of coconut husks generates methane, which is one of the most responsible gases for global warming [7] .
Coconut husk can be processed to the condition of fiber, which is composed of cellulose, hemicellulose, lig- nin, pectin and various minerals. This fiber can be used in the preparation of composites such as bioplastics, natural adsorbent and as a source of raw materials for several processes [8] . It represents an alternative low-cost (bio)adsorbent and may be used for the removal of pollutants (metal ions, dyes and other natural and inorganic substances) present in wastewater. The retention capacity of several metallic ions in aqueous solution has been previously reported using coconut fiber as the adsorbent [9] .
The environment is highly impacted by a significant volume of wastewater (not always treated accordingly before discharge) produced by the textile industry [10] . Some dyes and organic compounds from effluents of textile industries contain a high level of toxicity, and their removal is hampered by the stability of the com- pounds; they do not break down in light or heat and most of them are not biodegradable, thus causing serious problems to the aquatic life in lakes, rivers and seas.
Therefore, appropriate procedures for the removal of colored dyes from wastewater must be obtained [11] [12] . Kyzas et al. reported a review about changes from past to the future for adsorbent materials in treatment of dyeing wastewaters [13] .
This study aims to use coconut fiber as a (bio)adsorbent for retention of the organic compound 5.5’-disulfoni- cindigotin (5.5’-DI), sulphonated species of Indigo blue dye (Figure 1) at different temperatures (283, 298 and 313) K.
Four simplified kinetic models including pseudo-first-and -second-order [14] - [16] equations and the intrapar- ticle diffusion [17] were used to describe the adsorption processes. Adsorption equilibrium was described by using three commonly applied mathematical expressions: Langmuir [18] , Freundlich [19] and Dubinin-Radush- kevich [20] isotherm models.
2. Materials and Methods
2.1. Reagents and Solutions
All reagents and solvents used were of analytical grade. Distilled deionized water (Milli-Q) was used to prepare solutions. Indigo blue dye ((3H-indole-3-one2-(1.3-dihydro-3-oxo-2H-indol-2ylidene)-1.2-dihydro) is known in literature as CI Vat Blue or D&C no.6 and is used to dye natural and synthetic fibers. It is a blue crystalline solid with the molecular formula C16H10N2O2 (262.27 g∙mol−1), CAS Number 482-89-3 and a melting point between 300˚C and 303˚C. To prepare 5.5’-disulfonic indigotin solution (C16H8N2O8S2), 466.36 g∙mol−1, 1.05 g of the Indigo blue dye (Sigma Aldrich) was added to 35 mL of concentrated H2SO4 while stirring.
The sulphonated species is obtained according to the chemical reaction (Figure 2). The temperature was kept at 80˚C. And after cooling, the solution was diluted to 1000 mL with deionized water [12] .
2.2. Biosorbent Material Preparation
Green coconuts (Cocos nucifera L.) were grown in Brazil northern state of Paraiba and purchased at Ceasa (Supply Center of Santo Andre, Brazil) [1] . Physicochemical properties of the adsorbent are show in Table 1 [21] [22] .
The fruits were washed and cut in two halves. To obtain the fibers, the coconuts used were initially drilled to remove the water and then cut to remove the pulp. The bark was first ground in a toothed rollers mill to remove water, and then shredded in a hammer mill and placed in an oven at 378 K for a period of approximately six

Figure 1. Chemical structure of the reagent indigo blue dye [12] .

Figure 2. Sulfonation reaction of indigo blue dye [12] .

Table 1. Physicochemical properties of green coconut adsorbent [21] [22] .
hours. The fiber was then fractionated and stored in a suitable container. No chemical or physical treatments were performed prior to adsorption experiments.
2.3. Apparatus
The UV-Vis spectra were measured on a Shimadzu Model UV-2600 spectrophotometer using 1.00-cm quartz cells. All cuvettes, glass and plastic vessels were washed with a 10% (v/v) HNO3 aqueous solution followed by distilled and deionized water to remove trace of contaminants. The pH measurements were performed with a Metrohm pH-meter Model 827 with a combined glass electrode with the Ag/AgCl reference electrode filled with 3 mol∙L−1 NaCl solution. Centrifugation of the mixtures was carried out in a FANEM 206-R centrifuge. Agita- tion of the mixtures was performed on an Incubator Shaker Model AL-222-CF American Lab with controlled velocity and temperature (283, 298 and 313) K.
2.4. Adsorption and Desorption Experiments
The adsorption kinetics was investigated using the solution depletion method [23] . For kinetic studies, the solu- tions (samples and blanks) were prepared in 10.0 mL volumetric polyethylene flasks with screw caps. In stop- pered plastic tubes, 0.1 g samples of coconut fiber were kept in contact with 10.0 mL of 5.5’-DI aqueous solu- tions (1.91, 3.02 and 4.02) × 10−5 mol∙L−1 and were shaken for specific periods of time at different temperatures (283, 298 and 313) K. The supernatants were separated by centrifuging the mixtures and the concentration of 5.5’-DI was calculated by molecular absorption measurements at 612 nm (pH 2), with a 1-cm optical path cell. The adsorbed amount of 5.5’-DI at equilibrium was calculated by the difference (attenuation) in the absorbance of the aliquots drawn before and after shaking. The blank solution was prepared in the same way, but without 5.5’-DI solution.
For isotherm studies, 0.1 g samples of coconut fiber in stoppered polyethylene flasks with an aqueous solution (10.0 mL) of 5.5’-DI (0.40 to 5.01) × 10−5 mol∙L−1 at (283, 298 and 313) K were shaken separately for a specific period of time previously defined in the kinetic studies.
A similar experimental procedure was used to evaluate 5.5’-DI desorption from the loaded adsorbent. In plas- tic tubes 0.1 g of coconut fiber modified by 5.5’-DI adsorption was added NaOH (10−3, 10−2 and 10−1) mol∙L−1 and the mixtures were shaken for specific periods of time (10 and 30 minutes), at controlled temperature 298 K and a constant shaking speed was kept. After the contact time, the supernatants were separated by centrifuging the mixtures and the concentration of 5.5’-DI was determined as previously described.
3. Results and Discussion
3.1. Spectral Characteristics and Analytical Curve of 5.5’-DI
The maximum absorbance wavelength was determined from the 5.5’-disulfonicindigotin (5.5’-DI) spectrum, 612 nm. The analytical curve for 5.5’-DI aqueous solutions in the concentration range of 4.01 × 10⁻⁶ to 5.01 × 10⁻⁵ mol∙L−1 at pH 2 was obtained, and the respective parameters were calculated using a least-squares method. The correlation coefficient, r2 = 0.9991, reveals an excellent linear fit to the experimental data. The linear fit equation can be written as:
 (1)
(1)
3.2. Effect of the Contact Time
Several experiments were conducted to assess the necessary time to obtain the maximum adsorption of 5.5’-DI onto green coconut fiber. Figures 3(a)-(c) show the mass-time profiles [qt = (m5.5’-DI/mfiber) vs t] for adsorption of initial concentrations (1.91, 3.02 and 4.02) × 10−5 mol∙L−1 onto the fiber at 283 K (3-a), 298 K (3-b) and 313 K (3-c) at pH 2.]
Maximum sorption of 5.5’-DI was achieved after 60 minutes for three concentrations and at all temperatures. The preliminary experiments showed that the adsorption of 5.5’-DI is fast at the initial stages and becomes slower near the equilibrium. At 283, 298 and 313 K the maximum sorption, qmax,exp, for the lowest initial con- centration (Co = 1.91 × 10⁻⁵ mol∙L−1) of 5.5’-DI was (5.01, 5.24 and 6.14) × 10−4 g∙g−1; for Co = 3.02 × 10⁻⁵ mol∙L−1 (0.93, 1.01 and 1.03) × 10−3 g∙g−1 and for Co = 4.02 × 10⁻⁵ mol∙L−1 (1.32, 1.40 and 1.49) × 10−3 g∙g−1, respectively. The rate of 5.5’-DI adsorption onto the fiber is very rapid during the initial 30 minutes and de- creases thereafter, as can be seen from Figure 3.
It is revealed that there was no considerable adsorption for 5.5’-DI after 120 minutes. The time profile of 5.5’-DI uptake is a single, smooth, and continuous curve leading to saturation (qmax,exp), suggesting a possible monolayer coverage of 5.5’-DI on the surface of the coconut fiber adsorbent [24] . The increase in the adsorption capacity at a higher temperature indicated the endothermic nature of the adsorption process of 5.5’-DI onto co- conut fiber. Similar results of adsorption of dyes onto different adsorbents with a positive change in entropy and enthalpy have been reported in literature [25] - [28] .
3.3. Adsorption Kinetics
The kinetic adsorption study is essential to optimize the processes and ensure that significant adsorption of the 5.5’-DI occurred under different conditions. Furthermore, it is possible to determine the solute uptake rate that controls the residence time of the adsorbate at the solid-solution interface. Kinetic models were applied to in- terpret the experimental data in order to understand the mechanisms that control the adsorption process, such as the mass transfer in solution and the chemical interactions [29] .
The first kinetic model used to fit the experimental data was that of Lagergren, Equation (2), which was the first equation developed to describe adsorption in liquid-solid systems based on the capacity of the solid [14] [15] :
 (2)
(2)
where k1 (min−1) is the rate constant of pseudo-first-order adsorption, qmax,calc is the maximum amount of 5.5’-DI
 (a)
(a) (b)
(b) (c)
(c)
Figure 3. Dependence of adsorbed mass of 5.5’-DI per fiber unit mass on time of contact at pH 2. (a) 283 K; (b) 298 K; and (c) 313 K. ▲ 4.02 × 10⁻⁵ mol∙L−1, ■ 3.02 × 10⁻⁵ mol∙L−1 and ● 1.91 × 10⁻⁵ mol∙L−1.
adsorbed (g5.5’-DI/gfiber) (based on the adsorption capacity which corresponds to the monolayer coverage) and qt is the amount of 5.5’-DI adsorbed on the fiber (g5.5’-DI/gfiber) when t ¹ 0 and tmax (equilibrium time of solid-liquid system which corresponds to the maximum adsorption kinetics). Integrating Equation (2) considering the initial conditions as qt = 0 at t = 0 and the equilibrium condition qads = qt for each time t, becomes:
 (3)
(3)
By applying the pseudo-first order model to the experimental values (Figures are not shown here) the slope and the intercept of each linear fit were used to calculate the first order rate constant (k1) and the adsorption at equilibrium (qmax,calc).The correlation coefficients (r2) of the first order kinetic fit to the experimental conditions were not very good for all studied temperatures. Such behavior was observed throughout the contact time and initial concentration evaluated. Also, the values of qmax,calc were quite different from the values found in the ex- perimental kinetic study (qmax,exp). These results suggest that the adsorption of 5.5’-DI onto green coconut fiber does not follow a pseudo-first order model, indicating that 5.5’-DI does not adsorb onto material occupying one adsorption site.
The adsorption kinetics may also be described by a pseudo-second order equation introduced by Blanchard et al. [16] and reviewed by Ho and McKay [30] :
 (4)
(4)
where k2 is the pseudo-second order adsorption rate constant, (min−1 gfiber/g5.5’-DI), and qmax,calc and qt have the same definitions as in Equation (3). Integrating Equation (4) and applying the same boundary conditions gives we can obtain:
 (5)
(5)
The second-order rate constant (k2) and the maximum amount of 5.5’-DI adsorbed (qmax,calc) may be calculated from the intercept and the slope of the linear relationship, Equation (5), between t/qt and t. The curve fit was calculated by adjusting Equation (5) to the experimental data (Figures are not shown here). The parameters qmax,calc and k2 are shown in Table 2.
The correlation coefficients (r2) for the pseudo-second order kinetic model fit are very good and the values of qmax,calc (Table 2) are quite similar to those obtained from the kinetic experiment data (qmax,exp) at different tem- peratures (283, 298 and 313) K and initial concentrations of 5.5’-DI (1.91, 3.02 and 4.02) × 10−5 mol∙L−1. At 283 K, 298 K and 313 K the maximum sorption, qmax,exp, for the lowest initial concentration (Co = 1.91 × 10⁻⁵ mol∙L−1) of 5.5’-DI were (5.01, 5.24 and 6.14) × 10−4 g∙g−1; for Co = 3.02 × 10⁻⁵ mol∙L−1 (0.93, 1.01 and 1.03) × 10−3 g∙g−1 and for Co = 4.02 × 10⁻⁵ mol∙L−1 (1.32, 1.40 and 1.49) × 10−3 g∙g−1, respectively. The pseudo-second order model fit suggests that the interaction of each molecule of dye with the fiber surface occurs by the occupa- tion of two sites on the biomaterial. In the lowest initial concentration (Co = 1.91 × 10⁻⁵ mol∙L−1), the large number of adsorption sites favored the adsorption and, consequently, k2 presents a higher value for all tempera- tures studied 283 K (5.44 × 10² min−1), 298 K (4.58 × 10² min−1) and (5.79 × 10² min−1). However, considering all 5.5’-DI initial concentrations, values of k2 show an irregular variation. A minimum value was observed and as a result, k2 tends to a constant value, irrespective of the initial concentration. Therefore, considering the whole time interval and 5.5’-DI concentrations, it can be assumed that the adsorption mechanism follows the pseu- do-second order model. It was observed that the increase in values of the maximum amount of 5.5’-DI adsorbed, qmax,calc, for Co = (1.91, 3.02 and 4.02) × 10−5 mol∙L−1 respectively with an increase in the temperature 283 K, 298 K and 313 K indicates a possible endothermic system. Similar behavior was seen in literature [31] .
Table 2. Pseudo-second order parameters for the adsorption of 5.5’-DI onto fiber at pH 2.
Adsorption involves varied stages, where the rate controlling step is the intraparticle diffusion mechanism. Close to the equilibrium, the intraparticle diffusion becomes slower due to low concentration. Considering that pseudo-first order and -second models cannot identify the diffusion mechanisms, an intraparticle diffusion mod- el [17] was also evaluated. The rate parameters for intraparticle diffusion (kP) may be obtained by using Equa- tion (6), where qt is the amount of 5.5´-DI on coconut fiber at different times, t (min):
 (6)
(6)
where kP is the intraparticle diffusion rate constant (min−1/2 g5.5’-DI/gfiber). According to Equation (6), a plot of qt versus t1/2 should be a straight line with a slope corresponding to kP when the intraparticle diffusion is a rate-li- miting step and B is the intercept corresponding to the linear coefficient. Figures 4(a)-(c) shows the data for (1.91, 3.02 and 4.02) × 10−5 mol∙L−1 initial concentration of 5.5’-DI at 283 K (a), 298 K (b) and 313 K (c).
The intraparticle diffusion model could be applied to experimental data obtained in different initial concentra- tions (Figure 4). It was observed that nonlinear plots over the whole range of time (multilinearity) indicating that other processes drive the adsorption of 5.5’-DI on coconut fiber. In general, a first sharper portion of the curve may be considered as an external surface adsorption or a faster adsorption stage. A second portion is a gradual adsorption stage, where intraparticle diffusion is rate-controlled and an irregular variation of the diffu- sion rate with the initial 5.5’-DI concentration was observed. The third portion is attributed to the final equili- brium stage where the intraparticle diffusion is slower due to the extremely low adsorbate concentrations in so- lution.
The rate of uptake might be limited by size of adsorbate molecule, concentration of the adsorbate and its af- finity to the adsorbent, diffusion coefficient of the adsorbate in the bulk phase, the pore-size distribution of the adsorbent and agitation rate. Values of kP (min−1/2 g5.5’-DI/gfiber) and the correlation coefficients for all 5.5’-DI ini- tial concentrations investigated are shown in Table 3. High correlation coefficient (r > 0.97) is found to the range of the experimental data to the diffusion model. The second portion of the curves can be attributed to intraparticle diffusion [32] - [34] and an irregular variation of the diffusion rate with initial 5.5’-DI concentration and temperature were observed.
An irregularity of the kP values was also reported in literature [35] that can be related to either the heterogene- ity of the material or the capability of adsorbate molecules to agglomerate on its surface. Intercept values of the linear diffusion segments, named as B, does not pass through the origin of the graphic plot indicating that intra- particle diffusion is not the single mechanism rate-controlling and other mechanisms may control the rate ad- sorption.
Validation requires the comparison of quantitative correlation coefficients, and they can be seen in the graphs of the linear equation used in its respective kinetic model [33] . Green coconut fiber has a high level of compres- sion where most of the binding sites are not exposed to the substrate. However, certain solvents can swell (decompressing) the fiber, exposing more ligands within the cellulosic network for binding with the adsorbate [35] . For all temperatures it was observed that as the initial concentration increased (1.91, 3.02 and 4.02) × 10−5 mol∙L−1 the intraparticle diffusion constant increase too (Table 3).
3.4. Desorption Studies
To verify the possibility of using successively coconut fiber, the elution of 5.5’-DI adsorbed onto fiber was stu- died. The main objective was to evaluate how often the modified solid phase can be used without losing the ini- tial properties of the same. In this experiment, it was evaluated the 5.5’-DI desorption of the fiber with NaOH solution (10−3, 10−2 and 10−1) mol∙L−1 in contact during 10 and 30 minutes at 298 K. The experiments were per- formed in duplicate and the results are shown Table 4.
Desorption percentage was estimated considering initial concentration Co = 4.02 × 10⁻⁵ mol∙L−1, corresponding qmax,exp = 1.40 × 10⁻³ g∙g−1 and qmax,calc = 1.46 × 10⁻³ g∙g−1 at 298 K. According to the results shown in Table 4, the highest leaching was observed for 10−1 mol∙L−1 NaOH during 30 minutes of contact. These differences are probably associated to the acid-base equilibria involved and neutralization of the acid. Desorption studies also contribute to selecting the suitable material to use in separation and preconcentration procedures.
3.5. Adsorption Isotherms
Figure 3 shows the plots of adsorption isotherms, qmax,exp versus Co, for 5.5’-DI adsorption by fiber at 283 K,
 (a)
(a)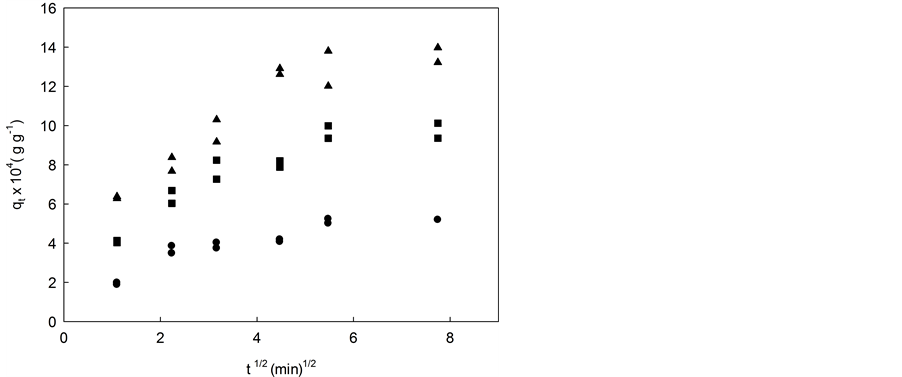 (b)
(b)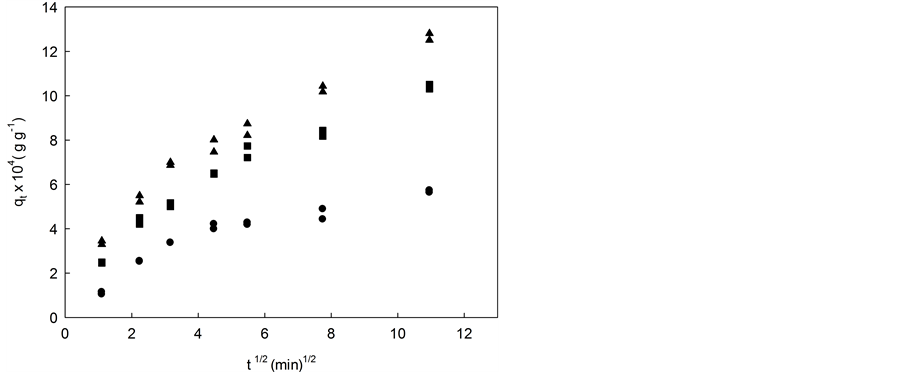 (c)
(c)
Figure 4. Intraparticle diffusion model for 5.5’-DI/fiber system at initial concentration and different temperatures: (a) 283 K; (b) 298 K; and (c) 313 K. ▲ 4.02 × 10⁻⁵ mol∙L−1, ■ 3.02 × 10⁻⁵ mol∙L−1 and ● 1.91 × 10⁻⁵ mol∙L−1.
Table 3. Difusion intraparticle parameters for the adsorption of 5.5;-DI solution onto fiber at pH 2.
Table 4. Results of desorption studies of fiber modified with 5.5’-DI (Co = 4.02 × 10⁻⁵ mol∙L−1).
298 K and 313 K. It was indicated that 5.5’-DI adsorption capacity increased with a higher temperature. After determining the best conditions for the adsorption study, experimental data were obtained by varying the initial adsorbate by keeping a constant time of contact between the fiber and 5.5’-DI adsorbate. Isotherms show the re- lationship between adsorbate concentration in solution and the amount of adsorbate adsorbed onto a specific sorbent at a constant temperature [36] [37] . To understand the adsorption equilibrium, three commonly used mathematical models were compared with experimental data: the Langmuir [18] , Freundlich [19] and Dubinin- Radushkevich [20] isotherms.
The Langmuir model [37] was originally developed to represent chemisorption on a set of well-defined an- dlocalized adsorption sites with the same adsorption energy, irrespective of the surface coverage and with no in- teraction between adsorbed molecules. Maximum sorption is defined when the adsorbent surface is covered with a monolayer of adsorbate, and each site is responsible for the adsorption of a single molecule of dye and no fur- ther adsorption may therefore occur [38] [39] . The model allows applying experimental data in an extensive range of concentration [40] . The familiar form of Langmuir isotherm, based on these kinetic considerations, is expressed as Equation (7) that describes a nonlinear form, which relates the adsorbed mass mads (g∙g−1) and the equilibrium concentration Ceq (g∙L−1).
 (7)
(7)
where mads is the amount of 5.5’-DI adsorbed on the fiber (g∙g−1),  is the maximum amount of solute ad- sorbed (g) per gram of fiber (adsorption capacity), Ceq is the equilibrium concentration of 5.5’-DI in solution (g∙L−1) and KL is the Langmuir constant (L∙g−1), which is related to the equilibrium constant of the adsorption process, including physical, chemical and energetic characteristics. The linear Equation (8) is obtained by rear- rangement of Equation (7):
 (8)
(8)
The empirical parameters were then obtained by using a dye concentration ranging from (3.01 × 10⁻⁶ to 4.70 × 10⁻⁵) mol∙L−1 at pH 2 and at (283, 298 and 313) K. The curve fit was calculated by adjusting Equation (8) to the experimental data with Origin 8.1 software (Figures are not shown here). Table 5 shows the results of ap- plying the Langmuir isotherm by the minimum square method. The fit of these linear curves resulted in correla- tion coefficients of 0.9929, 0.9902 and 0.9951, respectively, for 283 K, 298 K and 313 K. Values of KL are (61.4 L∙g−1 at 283 K), (78.4 L∙g−1 at 298 K) and (98.8 L∙g−1 at 313 K).
Table 5. Parameters of Langmuir, Freundlich and Dubinin-Radushkevich models for adsorption of 5.5’-DI on coconut fiber.
The maximum amount of solute adsorbed (g) per gram of fiber is 1.29 × 10⁻² g∙g−1 (283 K), 1.49 × 10⁻² g∙g−1 (298 K) and 1.89 × 10⁻² g∙g−1 (313 K). The Langmuir parameters described in Table 5 indicate that the adsorp- tion capacity for the 5.5’-DI/fiber system is more favorable at high temperatures. Furthermore, this may be cor- related with the higher surface area and lower pore size for fiber (Table 1) which present an important effect on the adsorption capacity. The KL contants indicate higher bonding energy of 5.5’-DI on fiber at 313 K than at 283 K. While the Langmuir isotherm assumes that the enthalpy of adsorption is independent of the amount adsorbed, the Freundlich isotherm is derived assuming a logarithmic decrease in the enthalpy of adsorption with the in- crease in the fraction of occupied sites.
The Freundlich isotherm [32] , one of the most widely used mathematical descriptions, usually fits the expe- rimental data over a wide range of concentrations. This isotherm gives an empirical expression that encompasses the surface heterogeneity and the exponential distribution of active sites and their energies [33] . The Freundlich adsorption isotherm does not predict any saturation of the solid adsorbent surface; thus, infinite surface coverage is mathematically feasible. The Freundlich model is shown in Equation (9):
 (9)
(9)
where mads and Ceq have the same definitions previously presented for the Langmuir isotherm, KF (g∙g−1) is an empirical constant which provides an indication of the adsorption capacity of adsorbent, and 1/n indicates the energetic heterogeneity of adsorption sites. Equation (9) can be manipulated to give the following linear equa- tion, Equation (10):
 (10)
(10)
The plots of logmads vs logCeq are shown in Figures 5(a)-(c) at different temperatures (283, 298 and 313) K. The constants 1/n and KF were determined from the slope and the intercept of the plots.
The high correlations (r2 = 0.9959, 0.9927 and 0.9963 for 283 K, 298 K and 313 K, respectively) show that the model is very suitable for describing the adsorption systems in the concentrations ranges, thus KF and n val- ues shown on Table 5. The values of n obtained from the adsorption of 5.5’-DI at all temperatures (283 K, 298 K and 313 K) were less than 1 (0.73, 0.52 and 0.50, respectively), indicating that adsorption is thermodynami- cally favored and the sites have a narrow energy distribution. At n = 1, all sites are energetically homogenous, and the model reduces to the Langmuir isotherm, where the adsorbed mass is a direct function of the equilibrium
 (a)
(a) (b)
(b) (c)
(c)
Figure 5. Adsorption isotherms of the 5.5’-DI/fiber system at dif- ferent temperatures: (a) 283 K; (b) 298 K; and (c) 313 K and pH 2. Solid line corresponds to the Freundlich model fitting.
concentration. When n > 1, high energy sites exist and are the first to be occupied. The higher the value of n, the more energetically heterogeneous the adsorption sites.
The Freundlich adsorption isotherm does not predict any saturation of the solid adsorbent surface, therefore the infinite coverage is predicted mathematically [37] . Adsorption on fiber shows a KF value (136.5 g∙g−1 at 298 K) higher than the corresponding KF values (30.6 g∙g−1 at 283 K) and (22.1 g∙g−1 at 313 K) which represents a stronger interaction between 5.5’-DI and coconut fiber at 298 K.
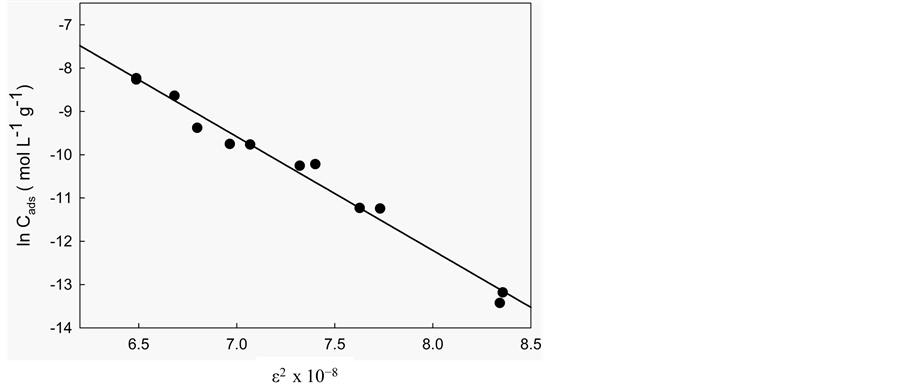
To distinguish between physical and chemical adsorption, the Dubinin-Radushkevich [41] isotherm model was applied to the data. This model examines the heterogeneity of the energies at the surface. The Dubinin-Ra- dushkevich model is shown in Equation (11):
 (11)
(11)
where Cads is the amount of 5.5’-DI adsorbed per unit mass of the fiber (mol∙L−1∙g−1), KDR is the maximum amount of 5.5’-DI adsorbed, Ceq have the same definitions as in the Langmuir isotherm (mol∙L−1), B is a con- stant with dimensions of energy; e is the Polanyi potential (e) = , where R is a gas constant (8.314 J∙K−1∙mol−1) and T is the temperature in Kelvin (K). This model is based on the theory of the Polanyi po- tential sorption that assumes a fixed volume of sorption space close to the adsorbent and the existence of sorp- tion potential over these spaces [42] [43] .
According to Antonio et al. [37] , if the surface is heterogeneous and a Langmuir isotherm approximation is chosen as a local isotherm for all energetically equivalent sites then the quantity B1/2 can be related to the mean sorption energy (E) according to:
 (12)
(12)
where E is the free energy equivalent to the transfer of 1 mol of solute from infinity to the surface of the fiber. A linear plot of  versus e2 (Figure 6) yielded linear regression coefficients of (r2 = 0.9915, 0.9918 and 0.9997 for 283 K, 298 K and 313 K, respectively).
The calculated values (Table 5) of B and KDR from the slope and intercept are (−2.63 × 10⁻⁸ J2∙mol−2) and 23.9 mol∙g−1 at 283 K, (−1.28 × 10⁻⁸ J2∙mol−2) and 18.2 mol∙g−1 at 298 K, (−2.22 × 10⁻⁸ J2∙mol−2) and 27.5 mol∙g−1 at 313 K. The numerical values of E calculated from Equation (12) are 4.36 kJ∙mol−1 (283 K), 6.26 kJ∙mol−1 (298 K) and 4.75 kJ∙mol−1 (313 K). As can be seen in Table 5, the numerical values of E as calculated from Equation (12) demonstrate a purely physical adsorption of 5.5’-DI on coconut fiber because they are smaller than 50 kJ∙mol−1 [29] . This type of adsorption involves weaker binding energies (van der Waals) which are usually between 8 and 25 kJ∙mol−1 [36] .
3.6. Evaluation of the Fit Quality
The isotherm parameters were determined by nonlinear regression [44] [45] using Origin 8.1 software. The quality of fit was assessed using the coefficient of determination (r2) and average relative error (RMD) according to Equation (13):
 (13)
(13)
where qexp and qmod are, respectively, the experimental values and the values estimated by the model. Table 5 shows the RMD for all the isotherm models at each temperature.
For all the temperatures studied, it was observed that the Freundlich model is the best to describe the 5.5’-DI adsorption isotherm in green coconut fiber (r2 > 0.9927 and RMD < 5.0). These values demonstrate the presence of energetically homogeneous adsorption sites of the adsorbent tested in which a reversible adsorption process occurs.
Thus, it is assumed that an increase in the adsorbate concentration causes an increase in the amount adsorbed on the adsorbent surface. Theoretically, using this isotherm, an infinite amount of adsorption can occur [46] .
3.7. Thermodynamic Study
Thermodynamic parameters that provide in-depth information on the inherent energetic changes associated with
 (a)
(a)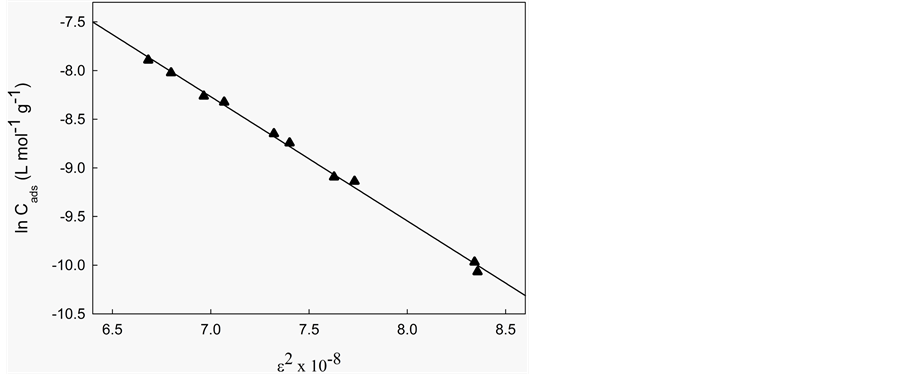 (b)
(b) (c)
(c)
Figure 6. Adsorption isotherms of 5.5’-DI/fiber system at different temperatures: (a) 283 K; (b) 298 K; and (c) 313 K and pH 2. Solid line corresponds to the Dubinin-Radushkevich model fitting.
the adsorption process were accurately evaluated [32] . From the experimental data (varying temperatures and the concentration of 5.5’-DI) the enthalpy (ΔHo), entropy (ΔSo) and Gibbs free energy (ΔGo) were determined. The Gibbs free energy was calculated using Equation (14):
 (14)
(14)
where KL, R and T were previously defined. The Gibbs free energy can also be expressed by Equation (15):
 (15)
(15)
Substituting Equation (14) into Equation (15), Equation (16) is obtained and through it ΔHo and ΔSo are cal- culated:
 (16)
(16)
Both ΔHo and ΔSo were determined from the slope and intercept of van’t Hoff plots of lnKL versus 1/T. The results of the fit to experimental data give values for the thermodynamic parameters of ΔHo and ΔSo. The posi- tive value of ΔHo (+11.6 kJ∙mol−1) confirms that the adsorption is endothermic process, and the value of ΔSo (+75.5 J∙mol−1∙K−1) suggests the increased randomness at the solid/liquid interface during the adsorption process so that increased entropy induces the replacement of ionic dye for water molecules around adsorbent particle.
The ΔGo values were negative at all temperatures −9.7 kJ∙mol−1 at 283 K, −10.8 kJ∙mol−1 at 298 K and −11.9 kJ∙mol−1 at 313 K, what corroborate that the adsorption of dyes onto coconut fiber was both spontaneous and thermodynamically favored. Furthermore, the decrease in the value of ΔGo with a rise in temperature indicates that the adsorption is more spontaneous at higher temperatures. Similar behavior was seen in literature [35] .
4. Conclusions
Green coconut fiber showed considerable potential low cost adsorbent for its use in the adsorption of 5.5’-DI from aqueous solution. The adsorbent had good adsorption capacity for 5.5’-DI and showed strong adsorption as the initial concentration of the 5.5’-DI was increased. The kinetic study demonstrated that the equilibrium time of contact was about 30 minutes for both temperatures and dye initial concentration. The pseudo-second order adsorption model adequately represents the interaction of 5.5’-DI with coconut fiber, showing that adsorption occurs by the occupation of two active sites on the surface of the bio(adsorbent) as reported in literature [47] [48] . Adsorption parameters calculated from Langmuir, Freundlich and Dubinin-Radushkevich isotherms are useful for the explanation of the mechanisms of the adsorption process as indicated by the good linear correla- tion coefficient values. The values of the mean sorption energy (E) at different temperatures all characterize a physical rather than chemical adsorption. For all temperatures studied, the Freundlich is the model that best de- scribes the adsorption isotherm of 5.5’-DI onto green coconut husk fiber (r2 > 0.9927 and RMD < 5.0). Ther- modynamic studies show the adsorption process to be endothermic and spontaneous.
Considering adsorption, desorption, kinetic modeling and physical properties of the adsorbent, coconut fiber is an appropriate material in future analytical applications.
Acknowledgments
The authors are grateful to FAPESP 2010/18713-5, FAPESP 2011/21511-8 and CNPq Brazilian Foundations for the financial support.
References
- Santana, I.A., Ribeiro, E.P. and Iguti, A.M. (2011) Evaluation of Green Coconut (Cocos nucifera L.) Pulp for Use as Milk, Fat and Emulsifier Replacer in Ice Cream. Procedia Food Science, 1, 1447-1553. http://dx.doi.org/10.1016/j.profoo.2011.09.214
- Faostat Production Crops. Coconut. (2011). http://faostat.fao.org
- de Lima, A.C.A., Nascimento, R.F., de Sousa, F.F., Filho, J.M. and Oliveira, A.C. (2012) Modified Coconut Shell Fi- bers: A Green and Economical Sorbent for Removal of Anions from Aqueous Solution. Chemical Engineering Jour- nal, 185-186, 274-284. http://dx.doi.org/10.1016/j.cej.2012.01.037
- Silva, E.T., Souza, D.A., Machado, J.C. and Hourston, D.J. (2000) Mechanical and Thermal Characterization of Native Brazilian Coir Fiber. Journal of Applied Polymer Science, 76, 1197-1206.
- Rosa, M.F., Bezerra, F.C., Correia, D., Santos, F.J.S., Abreu, F.A.P. and Furtado, A.A.L. (2002) Utilização da Casca de Coco como Substrato Agrícola. Embrapa Agroindústria Tropical, 52, 22-26.
- John, M.J. and Thomas, S. (2008) Biofibres and Biocomposites. Carbohydrate Polymers, 71, 343-364. http://dx.doi.org/10.1016/j.carbpol.2007.05.040
- Sriccia, N., Hawley, M.C. and Misra, M. (2008) Characterization of Natural Fiber Surfaces and Natural Fiber Compo- sites. Composites Part A: Applied Science and Manufacturing, 39, 1632-1637. http://dx.doi.org/10.1016/j.compositesa.2008.07.007
- Sousa, F.W., Moreira, S.A., Oliveira, A.G., Ribeiro, J.P., Rosa, M.F., Keukelereire, D. and Nascimento, R.F. (2010) Green Coconut Shells Applied as Adsorbent for Removal of Toxic Metal Ions Using Fixed-Bed Column Technology. Journal of Environmental Management, 91, 1634-1640. http://dx.doi.org/10.1016/j.jenvman.2010.02.011
- Sousa, F.W., Moreira, S.A., Oliveira, A.G., Cavalcante, R.M., Nascimento, R.F. and Rosa, M.F. (2007) Uso da casca de coco verde como adsorbente na remoção de metais tóxicos. Química Nova, 30, 1153-1157. http://dx.doi.org/10.1590/S0100-40422007000500019
- Dallago, R.M., Smaniotto, A. and de Oliveira, L.C.A. (2005) Resíduos sólidos de curtumes como adsorventes para a remoção de corantes em meio aquoso. Química Nova, 28, 433-437. http://dx.doi.org/10.1590/S0100-40422005000300013
- Sequin-Frey, M. (1981) The Chemistry of Plant and Animal Dyes. Journal of Chemical Education, 58, 301-307. http://dx.doi.org/10.1021/ed058p301
- Bayer, A. and Drewson, V. (1982) Darstellung von Indigblauaus Orthonitrobenzaldehyd. Berichte der Deutschen Che- mischen Gesellschaft, 15, 2856-2864. http://dx.doi.org/10.1002/cber.188201502274
- Kyzas, G.Z., Fu, J. and Matis, K.A. (2013) The Change from Past to Future for Adsorbent Materials in Treatment of Dyeing Wastewaters. Materials, 6, 5131-5158. http://dx.doi.org/10.3390/ma6115131
- Langergren, S. (1898) Zurtheorie der sogenannten adsorption geloesterstoffe. Veternskapsakad Handlingar, 24, 1-9.
- Yener, J., Kopac, T., Dogu, G. and Dogu, T. (2006) Adsorption of Basic Yellow 28 from Aqueous Solutions with Cli- noptilolite and Amberlite. Journal of Colloid and Interface Science, 294, 255-264. http://dx.doi.org/10.1016/j.jcis.2005.07.040
- Blanchard, G., Maunaye, M. and Martim, G. (1984) Removal of Heavy Metals from Waters by Means of Natural Zeo- lites. Water Research, 18, 1501-1507. http://dx.doi.org/10.1016/0043-1354(84)90124-6
- Annadurai, G., Juang, R.S. and Lee, D.J. (2002) Use of Cellulose-Base Wastes for Adsorption of Dyes from Aqueous Solutions. Journal of Hazardous Materials, 92, 263-274. http://dx.doi.org/10.1016/S0304-3894(02)00017-1
- Langmuir, I. (1918) The Adsorption of Gases on Plane Surfaces of Glass, Mica and Platinum. Journal of the American Chemical Society, 40, 1361-1403. http://dx.doi.org/10.1021/ja02242a004
- Freundlich, H.Z. (1906) Concerning Adsorption in Solutions. Zeitschrift für Physikalische Chemie, 57, 444-448.
- Dubinin, M.M. and Radushkevich, L.V. (1947) Equation of the Characteristic Curve of Activated Charcoal. Proceedings of the Academy of Sciences of the USSR, Physical Chemistry Section, 55, 331-333.
- Brigida, A.I.S., Calado, V.M.A., Gonçalves, L.R.B. and Coelho M.A.Z. (2010) Effect of Chemical Treatments on Properties of Green Coconut Fiber. Carbohydrate Polymers, 79, 832-838. http://dx.doi.org/10.1016/j.carbpol.2009.10.005
- Aragão, W.M., Cruz, E.M.O. and Helvécio, J.S. (2001) Caracterização morfológica do fruto e química da água de coco em cultivares de coqueiro-anão. Agrotrópica, Ilhéus, 13, 49-58.
- Freitas, P.A.M., Iha, K., Felinto, M.C.F.C. and Suárez-Iha, M.E.V. (2008) Adsorption of di-2-pyridyl Ketone Salicy- loylhydrazone on Amberlite XAD-2 and XAD-7 Resins: Characteristics and Isotherms. Journal of Colloid and Inter- face Science, 323, 1-5. http://dx.doi.org/10.1016/j.jcis.2008.04.001
- Kavitha, D. and Namasivayam, C. (2007) Experimental and Kinetic Studies on Methylene Blue Adsorption by Coir Pith Carbon. Bioresource Technology, 98, 14-21. http://dx.doi.org/10.1016/j.biortech.2005.12.008
- Zhong, Q.Q., Yue, Q.Y., Li, Q., Xu, X. and Gao, B.Y. (2011) Preparation, Characterization of Modified Wheat Resi- due and Its Utilization for the Anionic Dye Removal. Desalination, 267, 193-200. http://dx.doi.org/10.1016/j.desal.2010.09.025
- Messina, P.V. and Schulz, P.C. (2006) Adsorption of Reactive Dyes on Titania-Silica Mesoporous Materials. Journal of Colloid and Interface Science, 299, 305-320. http://dx.doi.org/10.1016/j.jcis.2006.01.039
- Dotto, G.L.,Vieira, M.L.G., Gonçalves, J.O. and Pinto, L.A.A. (2011) Remoção dos corantes azul brilhante, amarelo cre- púsculo e amarelo tartrazina de soluções aquosas utilizando carvão ativado, terra ativada, terra diatomácea, quitina e quitosana: Estudos de equilíbrio e termodinâmica. Química Nova, 34, 1193-1199. http://dx.doi.org/10.1590/S0100-40422011000700017
- Cai, W.Q., Yu, J.G., Cheng, B., Su, B.L. and Janoriec, M. (2009) Synthesis of Boehmite Hollow Core/Shell and Hol- low Microspheres via Sodium Tartrate-Mediated Phase Transformation and Their Enhanced Adsorption Performance in Water Treatment. Journal of Physical Chemistry C, 113, 14739-14746. http://dx.doi.org/10.1021/jp904570z
- Antonio, P., Iha, K. and Suárez-Iha, M.E.V. (2004) Adsorption of di-2-pyridyl Ketone Salicyloylhydrazone on Silica Gel: Characteristics and Isotherms. Talanta, 64, 484-490. http://dx.doi.org/10.1016/j.talanta.2004.03.014
- Ho, Y.S. and McKay, G. (1999) Pseudo-Second Order Model for Sorption Processes. Process Biochemistry, 34, 451-465. http://dx.doi.org/10.1016/S0032-9592(98)00112-5
- Weber Jr., W.J., Morris, J.C. and Sanit, J. (1963) Kinetics of Adsorption on Carbon from Solution. Journal of the Sa- nitary Engineering Division, American Society of Civil Engineers, 89, 31-38.
- Bilgili, M.S. (2006) Adsorption of 4-Chlorophenol from Aqueous Solutions by XAD-4 Resin: Isotherm, Kinetic and Thermodynamic Analysis. Journal of Hazardous Materials, 137, 157-164. http://dx.doi.org/10.1016/j.jhazmat.2006.01.005
- Katal, R., Baei, M.S., Rahmati, H.T. and Esfadian, H. (2012) Kinetic Isotherm and Thermodynamic Study of Nitrate Adsorption from Aqueous Solution Using Modifies Rice Husk. Journal of Industrial and Engineering Chemistry, 18, 295-302. http://dx.doi.org/10.1016/j.jiec.2011.11.035
- Al-Ghout, M.A., Khraisheh, M.A., Ahmad, M.N. and Allen, S. (2009) Adsorption Behavior of Methylene Blue onto Jordanian Diatomite: A Kinetic Study. Journal of Hazardous Materials, 165, 589-598.
- Etim, U.J., Umoren, S.A. and Eduok, U.M. (2012) Coconut Coir Dust as a Low Cost Adsorbent for the Removal of Cationic Dye from Aqueous Solution. Journal of Saudi Chemical Society, in Press. http://dx.doi.org/10.1016/j.jscs.2012.09.014
- Oguz, E. (2005) Thermodynamic and Kinetic Investigations of PO3-4 Adsorption on Blast Furnace Slag. Journal of Colloid and Interface Science, 281, 62-67. http://dx.doi.org/10.1016/j.jcis.2004.08.074
- Antonio, P., Iha, K. and Suárez-Iha, M.E.V. (2007) Kinetic Modeling of Adsorption of di-2-Pyridylketone Salicyloyl- hydrazone on Silica Gel. Journal of Colloid and Interface Science, 307, 24-28. http://dx.doi.org/10.1016/j.jcis.2006.11.031
- Klug, M., Sanches, M.N.M., Laranjeira, M.C.M. and Favere, V.T. (1998) Análise das isotermas de adsorção de Cu(II), Cd(II), Ni(II) e Zn(II) pela n-(3,4-dihidroxibenzil) quitosana empregando o método da regressão não linear. Química Nova, 21, 410-413. http://dx.doi.org/10.1590/S0100-40421998000400006
- Singh, S., Barick, K.C. and Bahadur, D. (2013) Functional Oxide Nanomaterials and Nanocomposites for the Removal of Heavy Metals and Dyes. Nanomaterials and Nanotechnology, 3, 1-19. http://dx.doi.org/10.5772/57237
- Sari, A., Mendil, D., Tuzen, M. and Soylak, M. (2009) Biosorption of Palladium(II) from Aqueous Solution by Moss (Racomitrium lanuginosum) Biomass: Equilibrium, Kinetic and Thermodynamic Studies. Journal of Hazardous Mate- rials, 162, 874-879. http://dx.doi.org/10.1016/j.jhazmat.2008.05.112
- Mastral, A.M., Garcia, T., Murillo, R., Callen, M.S., Lopez, J.M. and Navarro, M.V. (2003) Measurements of Polycyclic Aromatic Hydrocarbon Adsorption on Activated Carbons at Very Low Concentrations. Industrial & Engineering Chemistry Research, 42, 155-161. http://dx.doi.org/10.1021/ie020189i
- Peric, J., Trgo, M. and Medvidovic, N.V. (2004) Removal of Zinc, Copper and Lead by Natural Zeolite―A Compari- son of Adsorption Isotherms. Water Research, 38, 1893-1899. http://dx.doi.org/10.1016/j.watres.2003.12.035
- Dabrowski, A. (2001) Adsorption―From Theory to Practice. Advances in Colloid and Interface Science, 93, 135-224. http://dx.doi.org/10.1016/S0001-8686(00)00082-8
- Messina, P.V. and Schulz, P.C. (2006) Adsorption of Reactive Dyes on Titania-Silica Mesoporous Materials. Journal of Colloid and Interface Science, 299, 305-320. http://dx.doi.org/10.1016/j.jcis.2006.01.039
- Foo, K.Y. and Hameed, B.H. (2010) Insights into the Modeling of Adsorption Isotherm Systems. Chemical Engineering Journal, 156, 2-10. http://dx.doi.org/10.1016/j.cej.2009.09.013
- Hamdaoui, O., Naffrechoux, E., Suptil, J. and Fachinger, C. (2005) Ultrasonic Desorption of p-chlorophenol from Granular Activated Carbon. Chemical Engineering Journal, 106, 153-161. http://dx.doi.org/10.1016/j.cej.2004.10.010
- Gaubeur, I., Coutinho-Neto, M.D., Homen-de-Mello, P., Cafer, L.D.F. and Gomes, A.C.R. (2012) The Interaction of an Azo Compound with a Surfactant and Ion Pair Adsorption to Solid Phases. Journal of Colloid and Interface Science, 367, 370-377. http://dx.doi.org/10.1016/j.jcis.2011.10.032
- Garcia, S. and Gaubeur, I. (2011) An Anionic Resin Modified by di-2-pyridyl Ketone Salicyloylhydrazone as a New Solid Preconcentration Phase for Copper Determination in Ethanol Fuel Samples. Journal of the Brazilian Chemical Society, 22, 501-510. http://dx.doi.org/10.1590/S0103-50532011000300013
NOTES

*Corresponding author.