Journal of Encapsulation and Adsorption Sciences
Vol.2 No.1(2012), Article ID:18302,10 pages DOI:10.4236/jeas.2012.21001
Nano-Microencapsulation and Controlled Release of Linoleic Acid in Biopolymer Matrices: Effects of the Physical State, Water Activity, and Quercetin on Oxidative Stability
1Department of Chemistry, Western Illinois University, Macomb, USA
2Department of Physics, Western Illinois University, Macomb, USA
Email: gkk100@wiu.edu
Received December 22, 2011; revised January 25, 2012; accepted February 29,2012
Keywords: Nanoencapsulation; microencapsulation kappa-carrageenan; quercetin; rancidity; antioxidant
ABSTRACT
In this study, linoleic acid (LA) was encapsulated in the presence or absence of quercetin into a dual polymer system of whey protein and kappa-carrageenan using power ultrasound. Atomic Force Microscopy (AFM) and FlowCam imaging technology were used for imaging and size determination of nano-and micro-capsules. Differential scanning calorimeter (DSC) was used to determine the glass transition temperature (Tg) of the freeze-dried nanocapsules. In order to examine the effect of water activity (aw) on the release profile of the encapsulated LA, the nanocapsules were equilibrated over saturated salt solution conditions corresponding to the range of aw between 0.333 and 0.769 in evacuated desiccators at room temperature. Gravimetric measurements of the steady state linoleic acid (LA) contents were conducted. The antioxidant activity of quercetin and the stability of encapsulated LA toward long term and thermally induced rancidity was investigated. The capsules were in the nanosize regime and 83% of the LA was effectively encapsulated. Furthermore, at aw of 0.764, the highest percentage of LA (74%) was released from the expelling nanocapsules. Quercetin was found to exhibit protective antioxidant effect against time-dependent oxidation and thermally induced rancidity of LA. Water activity values of 0.662 and 0.764 provided ideal humidity and pressure conditions for sustained release of nanoencapsulated LA at room temperature.
1. Introduction
Encapsulation is known as one of the “nature made” techniques for protecting biological structures [1]. Encapsulation is used in product formulation to entrap essential ingredients into a carrier, in order to impart protection against oxidation, isomerization, and degradation; and to extend the shelf life of materials over a period of time [1]. Encapsulation can also be used for controlled/sustained delivery of functional substances when ingested in the body. This means, the unstable constituents should remain intact for a certain period of time in the digestive system and then, released in the intestine over a range of physiological conditions [2]. In general, nano/micro-encapsulation involves coating of emulsion droplets in fluidic dispersions in the nano and/or microsize regime [3].
Recent advances in miniaturization have aroused considerable interest in the design of materials with minute sizes. Nanomaterials, objects having one dimension in the nanometer regime below 100 nm, [4] take advantage of their dramatically increased surface area to volume ratio. When brought into a bulk system, nanomaterials can strongly influence the mechanical and textural properties, such as stiffness and elasticity [5,6].
The method and the type of carrier used are critical in the encapsulation process. Encapsulation is aimed at enhancing the stability of chemically unstable materials. Such enhanced materials could enable weight reduction, increased stability, and improved functionality [7,8].
Many bioactive ingredients are available in capsules and tablets, but their biological effects are frequently reduced or even lost due to their limited solubility in water, oil, or other food-grade solvents. Besides these problems, bioactive ingredients are unstable under several conditions like temperature (processing conditions), pH, presence of enzymes or other nutrients in the gastro-intestinal tract conditions, insufficient gastric residence time, low permeability and solubility within the gut, as well as poor oral bio-availability limit [8].
Linoleic acid (LA) belongs to the group of essential ω – 6 fatty acids 18:2(n-6). It is a carboxylic acid with an 18-carbons chain and two double-bonds. LA is sensitive to light, air, and strong oxidizing agents [9]. When ingested, LA biologically transfers to docosatetraenoic acid after several sequences to form the intermediate products, gamma linoleic acid, dihomo gamma linoleic acid and arachidonic acid [9]. LA is indispensable for proper health. However, the human body is unable to synthesize it. Hence, a lack of LA and other ω-6 fatty acids in the diet causes nutrition-related disorders such as, dry hair, hair loss, and poor wound healing [10]. Therefore, supplementing foods with LA may have nutritional benefits. However, due to the presence of conjugated double bonds in its structure, LA is very susceptible to oxidation at ambient temperature [10]. Furthermore, its oily nature may affect the texture and other organoleptic properties of foods or pharmaceutical products to which it is added. Adding LA may also bring undesirable odor or taste. These concerns can be remediated by encapsulating LA droplets using miniaturizing techniques such as nanotechnology. The stability of encapsulated materials depends on many factors including the hydrophilic/lipophilic and electrostatic interactions between the core compound and the coating material, the properties of the surfactants used during the preparation of the droplets, and the physico-chemical state of the particles.
Quercetin (3,5,7,3’,4’-pentahydroxyflavone) is a natural bio-flavonoid originating from fruits, vegetables, seeds, berries, and tea [10,11]. The antioxidant activity of quercetin and its protective effects against cardiovascular disorders, anti-cancer, anti-inflammatory, and anti-viral activities have been extensively documented [11-13]. Given that the susceptibility of omega-fatty acids to oxidation and the oily sensation has become a concern in product development [14], encapsulating LA could be an approach for improving its stability and its controlled delivery. Furthermore, incorporating minute amounts of quercetin could potentially impart stability to the oil.
In this study, a strategy is developed to encapsulate LA into a dual-biopolymer matrix of whey protein and κ-carrageenan, in the presence of minute amounts of quercetin. The physical properties of the encapsulated matrices were investigated to determine conditions pertaining to the controlled release of the encapsulated LA.
2. Materials and Methods
Power ultrasound came from Hielscher Ultrasound Technology, Ringwood, NJ, USA. Freeze dryer used was a Labconco freeze dryer 4.5 originating from Cambridge, MA. The Differential Scanning Calorimeter (DSC) Model 7 came from Perkin Elmer, Norwalk, Connecticut, USA and FlowCam was a product of Fluidic Imaging Technology on Yarmouth, Maine. The model HPLC- 20AD was made by Shimadzu, Columbia, MD, and the column used for the analysis was C18 of length 250 mm with detector SPD 20A UV also by Shimadzu UV-1601 spectrophotomer, Columbia, MD. Organic reagents such as acetonitile (ACN), petroleum ether, hexane, isooctane, and Tween 20 were obtained from Sigma-Aldrich Chemical Company, St Louis, MO. Double distilled water was used in all solutions.
2.1. Encapsulation of LA through Controlled-Emulsion
The κ-carrageenan was a gift from Ingredients Solutions, Inc, Waldo, and the whey protein was purchased from Bulkfood, Toledo, Ohio and used as bulk matrix to prepare the emulsions. In brief, a solution of whey protein was prepared by dissolving 6 g of whey protein concentrated to 40 mL of water using a magnetic stirrer. Similarly, a solution of κ-carrageenan was prepared by dissolving 0.1 g of к-carrageenan into 20 mL of water. Exactly 1.5 g of LA was added step-wise to the whey protein solution and the mixture was continuously stirred for 15 min using power ultrasound at a frequency of 10 MHz. During the mixing 1mL of Tween 20 (0.1%, pH 7.6) was added drop-wise to reduce surface tension and enhance formation of LA droplets. The solution of к-carrageenan was added to the whey protein-LA mixture and mixed at a frequency of 10 MHz using power ultrasound. This process was aimed at developing a coating layer around the lipophilic LA. A similar emulsion was prepared by adding 20 µg of quercetin to LA before mixing with the protein. The purpose of using quercetin as an additive was to explore its potential to prevent the oxidation of LA. In order to compare the effect of quercetin to that of α-tocopherol, a well established antioxidant, a reference emulsion containing 10 µg of α-tocopherol was made following the procedure used to embed quercetin. The prepared emulsions were immediately pre-frozen using liquid nitrogen to entrap the formed nanocapsules. The pre-frozen preparations were frozen overnight at −20˚C and then freeze-dried for 72 h at −40˚C. The resulting dry powder was stored in desiccators over phosphorous pentoxide (P2O5) obtained from Sigma-Aldrich, MO, to remove possible residual water. The dried powder was then used to investigate the size of the particles using AFM, for DSC analysis, to study the release profile of LA at various aw, and to evaluate the protective effect of quercetin on thermally induced rancidity and time-dependent auto-oxidation. Practically, this consisted of measuring the amount of hydroperoxides and thiobarbituric acid reactive species (TBARS) after the capsules have been exposed to various conditions, including heating at 60˚C, storage at room temperature for 12 weeks, and exposure to various water activity conditions. In order to get further insights into the structure of the encapsulated LA, a new system of LA encapsulated with a dual polymer matrix of whey protein and κ-carrageenan of identical polymeric solution like the previous was conducted. The only difference from the emulsion described above is the mixing frequency of the power ultrasound reduced to 5 MHz and the mixing time was reduced to 5 min. It was expected that lowering the mixing frequency and time will lead to microsize particles that could be determined using FlowCam Imaging Technology.
2.2. Size Characterization Using Atomic Force Microscopy (AFM)
Tiny amounts of dry capsules were sprayed on highquality gold plate and a drop of a solution made of 75% methanol and 25% PBS, pH 7.8 was added. The gold plate was left to dry overnight and the particles fixed on the gold plate were characterized using AFM. The AFM originated from Quesant Instruments, 1999 model Qscope 250, California, and was operated in the non-contact wave mode.
2.3. Size and Structure Determination Using Fluiding Imaging Technology (FlowCam)
FlowCAM is a new particle analysis technique with applications in fluidics including food fluids. FlowCAM automatically captures digital images of each particle as it passes by in a fluid stream and records up to 26 different measurements for each particle, and particles as small as 2 μm can be visualized. Freshly prepared emulsions were used to visualize the structure, size, and dispersity of the capsules in the emulsion using a FlowCAM imaging system. One ml of emulsion was diluted 50 times by adding 49 mL of water, and 0.5 mL of the resulting solution was placed in a FlowCam cell for size and structure analysis using flash duration of 40,000 microseconds.
2.4. Determination of the Physical State of the Nanocapsules
Differential scanning calorimeter (DSC 7) from Perkin Elmer, Norwalk, Connecticut, was used to characterize the physical state of the dried capsules. Triplicate samples of dried powder weighing approximately 10 mg were sealed in an aluminum pan and scanned from 2˚C to 100˚C, and change in heat capacity of the sample was recorded and a possible transition in the sample was detectable on thermograms.
2.5. Determination of Total LA
The total LA refers to the amount of LA effectively encapsulated plus the amount of LA only on the surface of the polymer matrix (surface oil). To extract the total LA in the sample, triplicate 200 mg samples of the dry powder were added to 10 ml hexane, vigorously shaken and then filtered using 0.2 μm Nylon Acrodisc filter from Fischer-scientific. The solvent was decanted and the residue was then dried in an oven at 60˚C - 70˚C until a constant weight was obtained. The total oil was determined from the difference between the initial weight of the sample and the weight of the dry sample after completion of the hexane oil extraction.
2.6. Gravimetric Determination of Surface and Encapsulated LA
The surface LA was determined as follows: about 5 mL of HPLC grade petroleum ether was added to 200 mg of dried nanocapsules in a 50 mL glass vial and gently mixed for 5 min. The supernatant was transferred to a 100 mL glass vial and the wet solid was dried in an oven at temperatures between 60˚C - 70˚C. The surface oil was determined from the difference between the initial weight and the dry weight of the sample after completion of the petroleum ether-oil extraction. For the encapsulated LA, 200 mg of dried samples powder were treated with petroleum ether, as described above for extraction of surface LA. The remaining sample was flushed for 5 min with nitrogen gas and dried in the oven at temperatures between 60˚C - 70˚C. About 5 mL of hexane was added to the dried sample and mixed with a glass rod to release the encapsulated LA. The mixture was pressed on vortex for 5 min to further release the encapsulated LA. The supernatant solvent containing LA was removed and the sample was dried at 60˚C - 80˚C and then weighed. The amount of encapsulated LA was determined by measuring the difference in weights before and after the hexane extraction.
2.7. HPLC Determination of Surface and Encapsulated LA
Hexane and petroleum ether containing surface and encapsulated LA were removed by evaporation using nitrogen gas and the content of LA was determined by HPLC using C18 column. The mobile phase of the chromatographic runs was acetonitrile (ACN)/water (50:50). About 2 mL of acetonitrile/water (50:50) was added to LA and filtered with 0.2 μm Nylon Acrodisc filter. The injection volume of the sample was 50 µL, and the flow rate of the mobile phase was maintained at 0.9 mL/min using a UV detector at a wavelength of 242 nm. Samples were analyzed with a run time of 80 min. The amount of surface oil and encapsulated oil were determined by subjecting the surface areas of chromatograms to a least square analysis using an external the standard procedure.
2.8. Evaluation of Encapsulation Efficiency
The encapsulation yield is defined as the ratio of core material in the final dried capsules to that in the emulsion. The values of encapsulated and surface LA were used to calculate the encapsulation efficiency according to the equation (1) below.
 (1)
(1)
where TotalLA is the amount of LA found in the samples upon hexane extraction, and SurfaceLA is the amount of LA determined upon petroleum ether extraction.
2.9. Examination of Release Profile of Encapsulated LA at Various Water Activity Conditions
In order to determine the moisture conditions pertaining to the release of encapsulated LA from the nanocapsules, triplicate samples of 500 mg dried nanocapsules were placed in desiccators over supersaturated salt solutions of potassium acetate, magnesium chloride, potassium carbonate, magnesium nitrate, sodium nitrate and sodium chloride. Under evacuated atmosphere at 25˚C, these salt solutions provide relative humidity (RH) of 23.9%, 33.3%, 44.4%, 53.8%, 66.2% and 76.4%, respectively. The corresponding water activity (aw) is obtainable from the RH according to  [1,2]. The samples were removed and weighed after 3 h of storage and the Guggenheim-Anderson-Deboer (GAB) sorption model was fitted to the water sorption data [13]. Following the weight measurement, the samples were replaced in desiccators, kept undisturbed for 16 h and then removed. The amount of LA released upon exposure to the water activity conditions was extracted with petroleum ether and then analyzed as described above in the HPLC determination of surface LA.
2.10. Stability against Heat-Induced Rancidity
The stability of LA encapsulated with or without quercetin, and non-encapsulated LA was assessed by measuring the resistance to oxidation. The extent of LA oxidation was measured by following the formation of conjugated diene hydroperoxides (HCD) and thiobarbituric acid reactive species (TBARS) upon heating. Freezedried encapsulated LA prepared with and without quercetin, were heated in an oven at 60˚C for 4 h and 100 mg amount were transferred into Eppendorf propylene tubes, mixed with 5 mL hexane, and then vortexed for 20 s. The supernatant was filtered with 0.2 μm Nylon Acrodisc filter and the hexane layer was evaporated by flushing the tube with nitrogen gas. Exactly 100 mg of LA was placed in a 20 mL glass vial and heated under the same condition as encapsulated samples, and 20 mg extracts of heated LA corresponding to the amount of LA in 100 mg of encapsulated LA (assuming LA distributed evenly into the mixture) were taken for analysis of HCD and TBARS contents as a result of oxidation. About 2 mL of isooctane was added to the test tube to reconstitute the oil. The absorbance of the extracts was then measured spectrophotometrically at 234 nm to determine the amount of HCD and TBARS in the sample. The hydroperoxide content was calculated from the amount of conjugated dienes using the Beer Lambert Law: A = εlcCD, where A is the absorbance of LA solution at 234 nm, ε is the molar extinction coefficient of LA, (2.525 × 10⁴ M−1·cm−1), cCD is the molar concentration of LA, and l the path length of the cuvette (1 cm) [15]. The amount of hydroperoxides conjugated dienes (HCD) was calculated from the following equation:
 (2)
(2)
where DF is the dilution factor (for diluted samples). The inhibition percentage was calculated from the following equation:
 (3)
(3)
For the determination of TBARS, the method by Tong et al. [16] and Schulz et al. [17] was used. Briefly, about 2 ml of 2-thiobarbituric acid (TBA) reagent (15% trichloroacetic acid and 2.0 mL of TBA and 2.0 ml of 0.38% w/v TBA in 0.25 M HCl) was added to Eppendorf propylene test tubes and placed in a boiling water bath for 15 min. The tubes were cooled to room temperature for 10 min and the absorbances were determined spectrophotometrically at 532 nm. A standard curve was prepared from 1, 1, 3, 3, Tetraethocypropane from Sigma and used to determine the concentration of TBARS using a least square method.
The inhibition percentage was calculated from the following equation:
 (4)
(4)
2.11. Long Term Stability of Encapsulated LA
Long-term resistance to LA oxidation was evaluated as a way to assess the stability of LA encapsulated with α-tocopherol, quercetin, without quercetin, and non-encapsulated LA. The oxidation was assessed by following the formation of HCD and TBARS. About 1 g of freezedried encapsulated LA with and without quercetin and 100 ml of LA were stored at room temperature (25˚C). At a time interval of 2 weeks, 100 mg of the freeze-dried samples were removed, mixed with 5 ml hexane and then vortexed for 20 s. After filtering the supernatant with Nylon Acrodisc filter, hexane was evaporated under nitrogen gas flushing. Oxidation products were determined using the same procedure described above for the thermally induced resistance to rancidity. Similarly, triplicate of 20 μg of LA were taken and the amount of HCD and TBARS were determined.
2.12. Statistical Analysis
Minitab Software (Minitab, State College, PA) was used to assess the means, standard deviations, and for the analysis of variances and the differences between treatments.
3. Results and Discussion
3.1. Atomic Force Microscopy (AFM)
The structure and size of encapsulated LA were elucidated with AFM. Figure 1 is a 2-D image of a typical capsule showing the core oil droplet, the protein layer and the κ-carrageenan layer surrounding the protein layer.
The 2-D image illustrates the structure of the nanocapsules and confirms the effective formation of two polymeric layers, one over the other, around the LA droplets. Figure 2 is a 3-dimensional AFM image of multi-particles of LA in the dual polymer of whey protein and κ-carrageenan. The size of the capsules can be determined according to the color scale in the right of the image. The average lateral size range of the capsules produced was between 0.2 - 4 μm. However, the height was between 50 and 800 nm.
This suggests that some of the capsules fall in the nanosize regime while a number of them are also microcapsules. Since the encapsulation was conducted at the same ultrasound frequency, it can be assumed that the capsules were first produced at a nanosize and possibly underwent aggregation or agglomeration during drying and storage resulting in an increased size.
3.2. Particles Size and Structure Analysis by FlowCam Technology
As indicated in the material and methods section, FlowCam imaging technology was used to gather further insights into the structure of the coating layer and the dispersity of the capsules. Since the technique can visualize particles of sizes > 2 μm, microsize capsules containing LA were prepared by reducing the frequency of the ultrasound to 5 MHz and the processing time to 5 min.
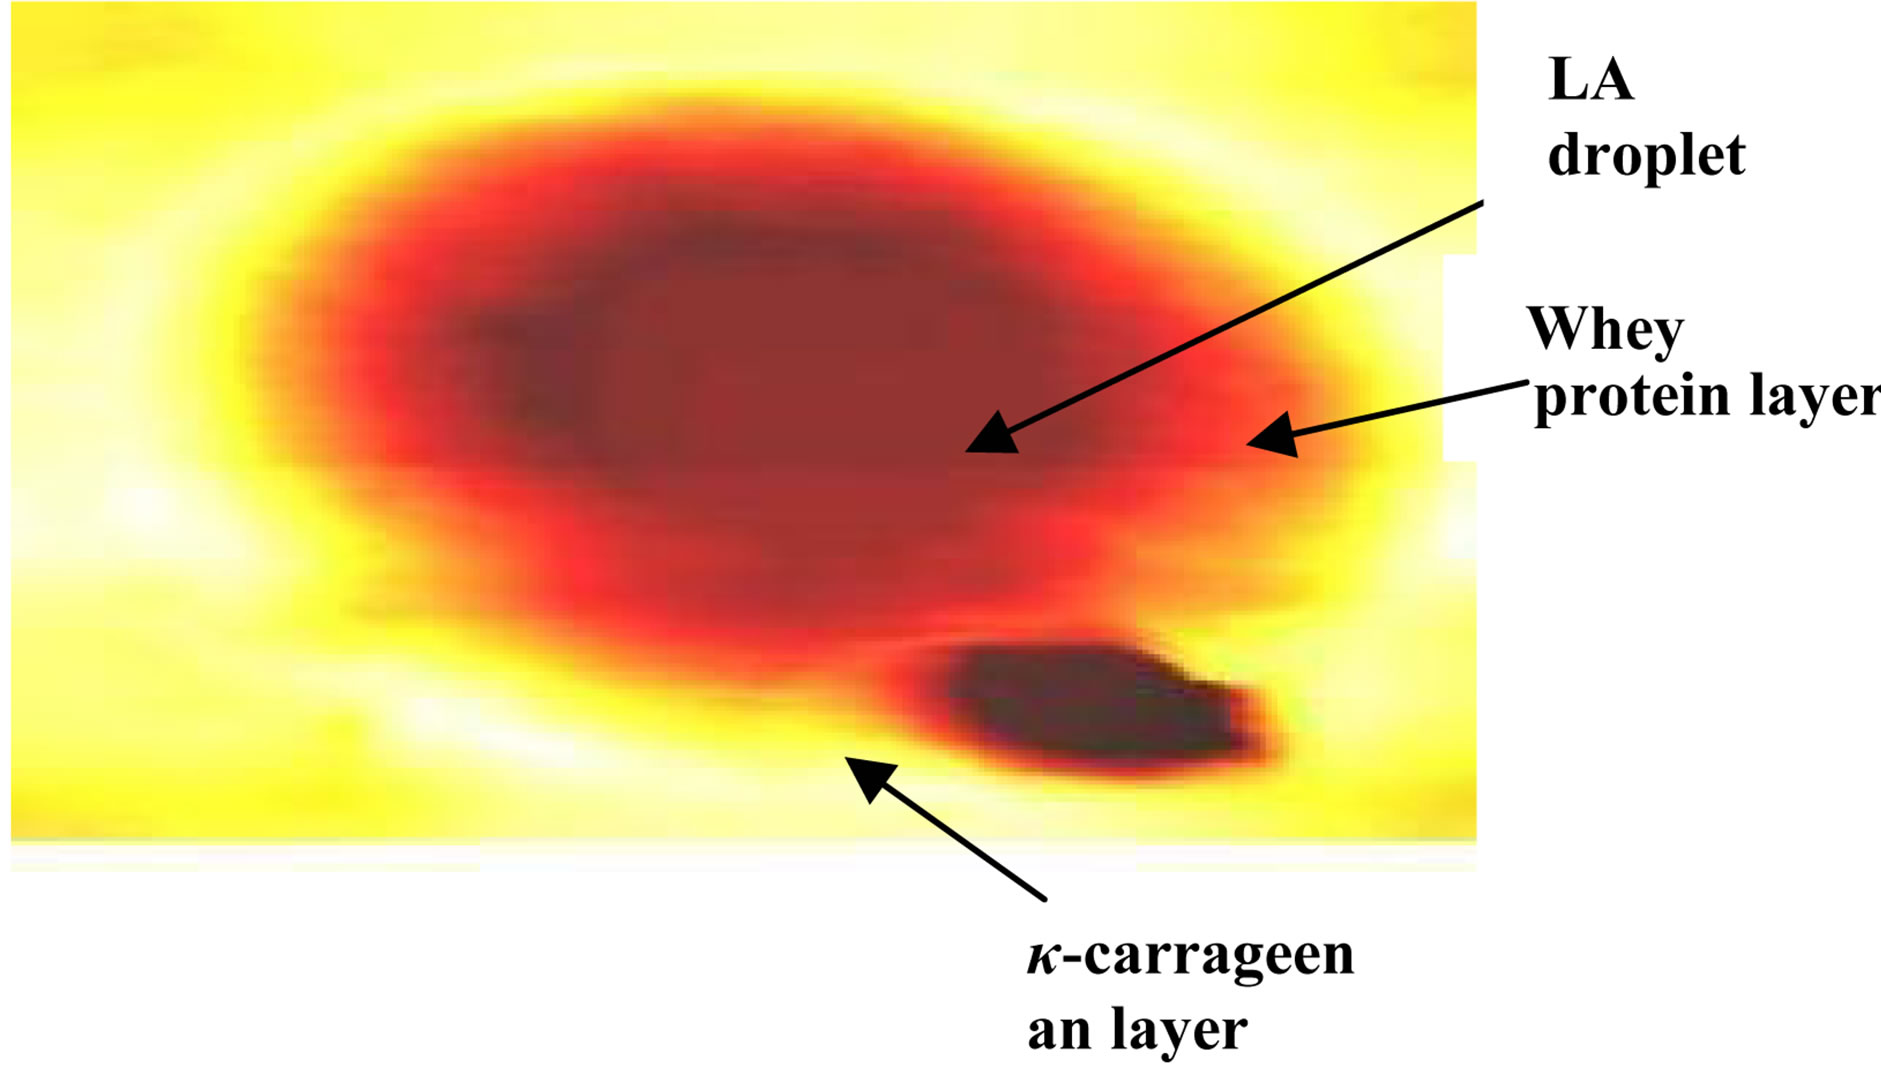
Figure 1. 2D AFM image of LA encapsulated into wheyprotein-κ-carrageenan matrix.
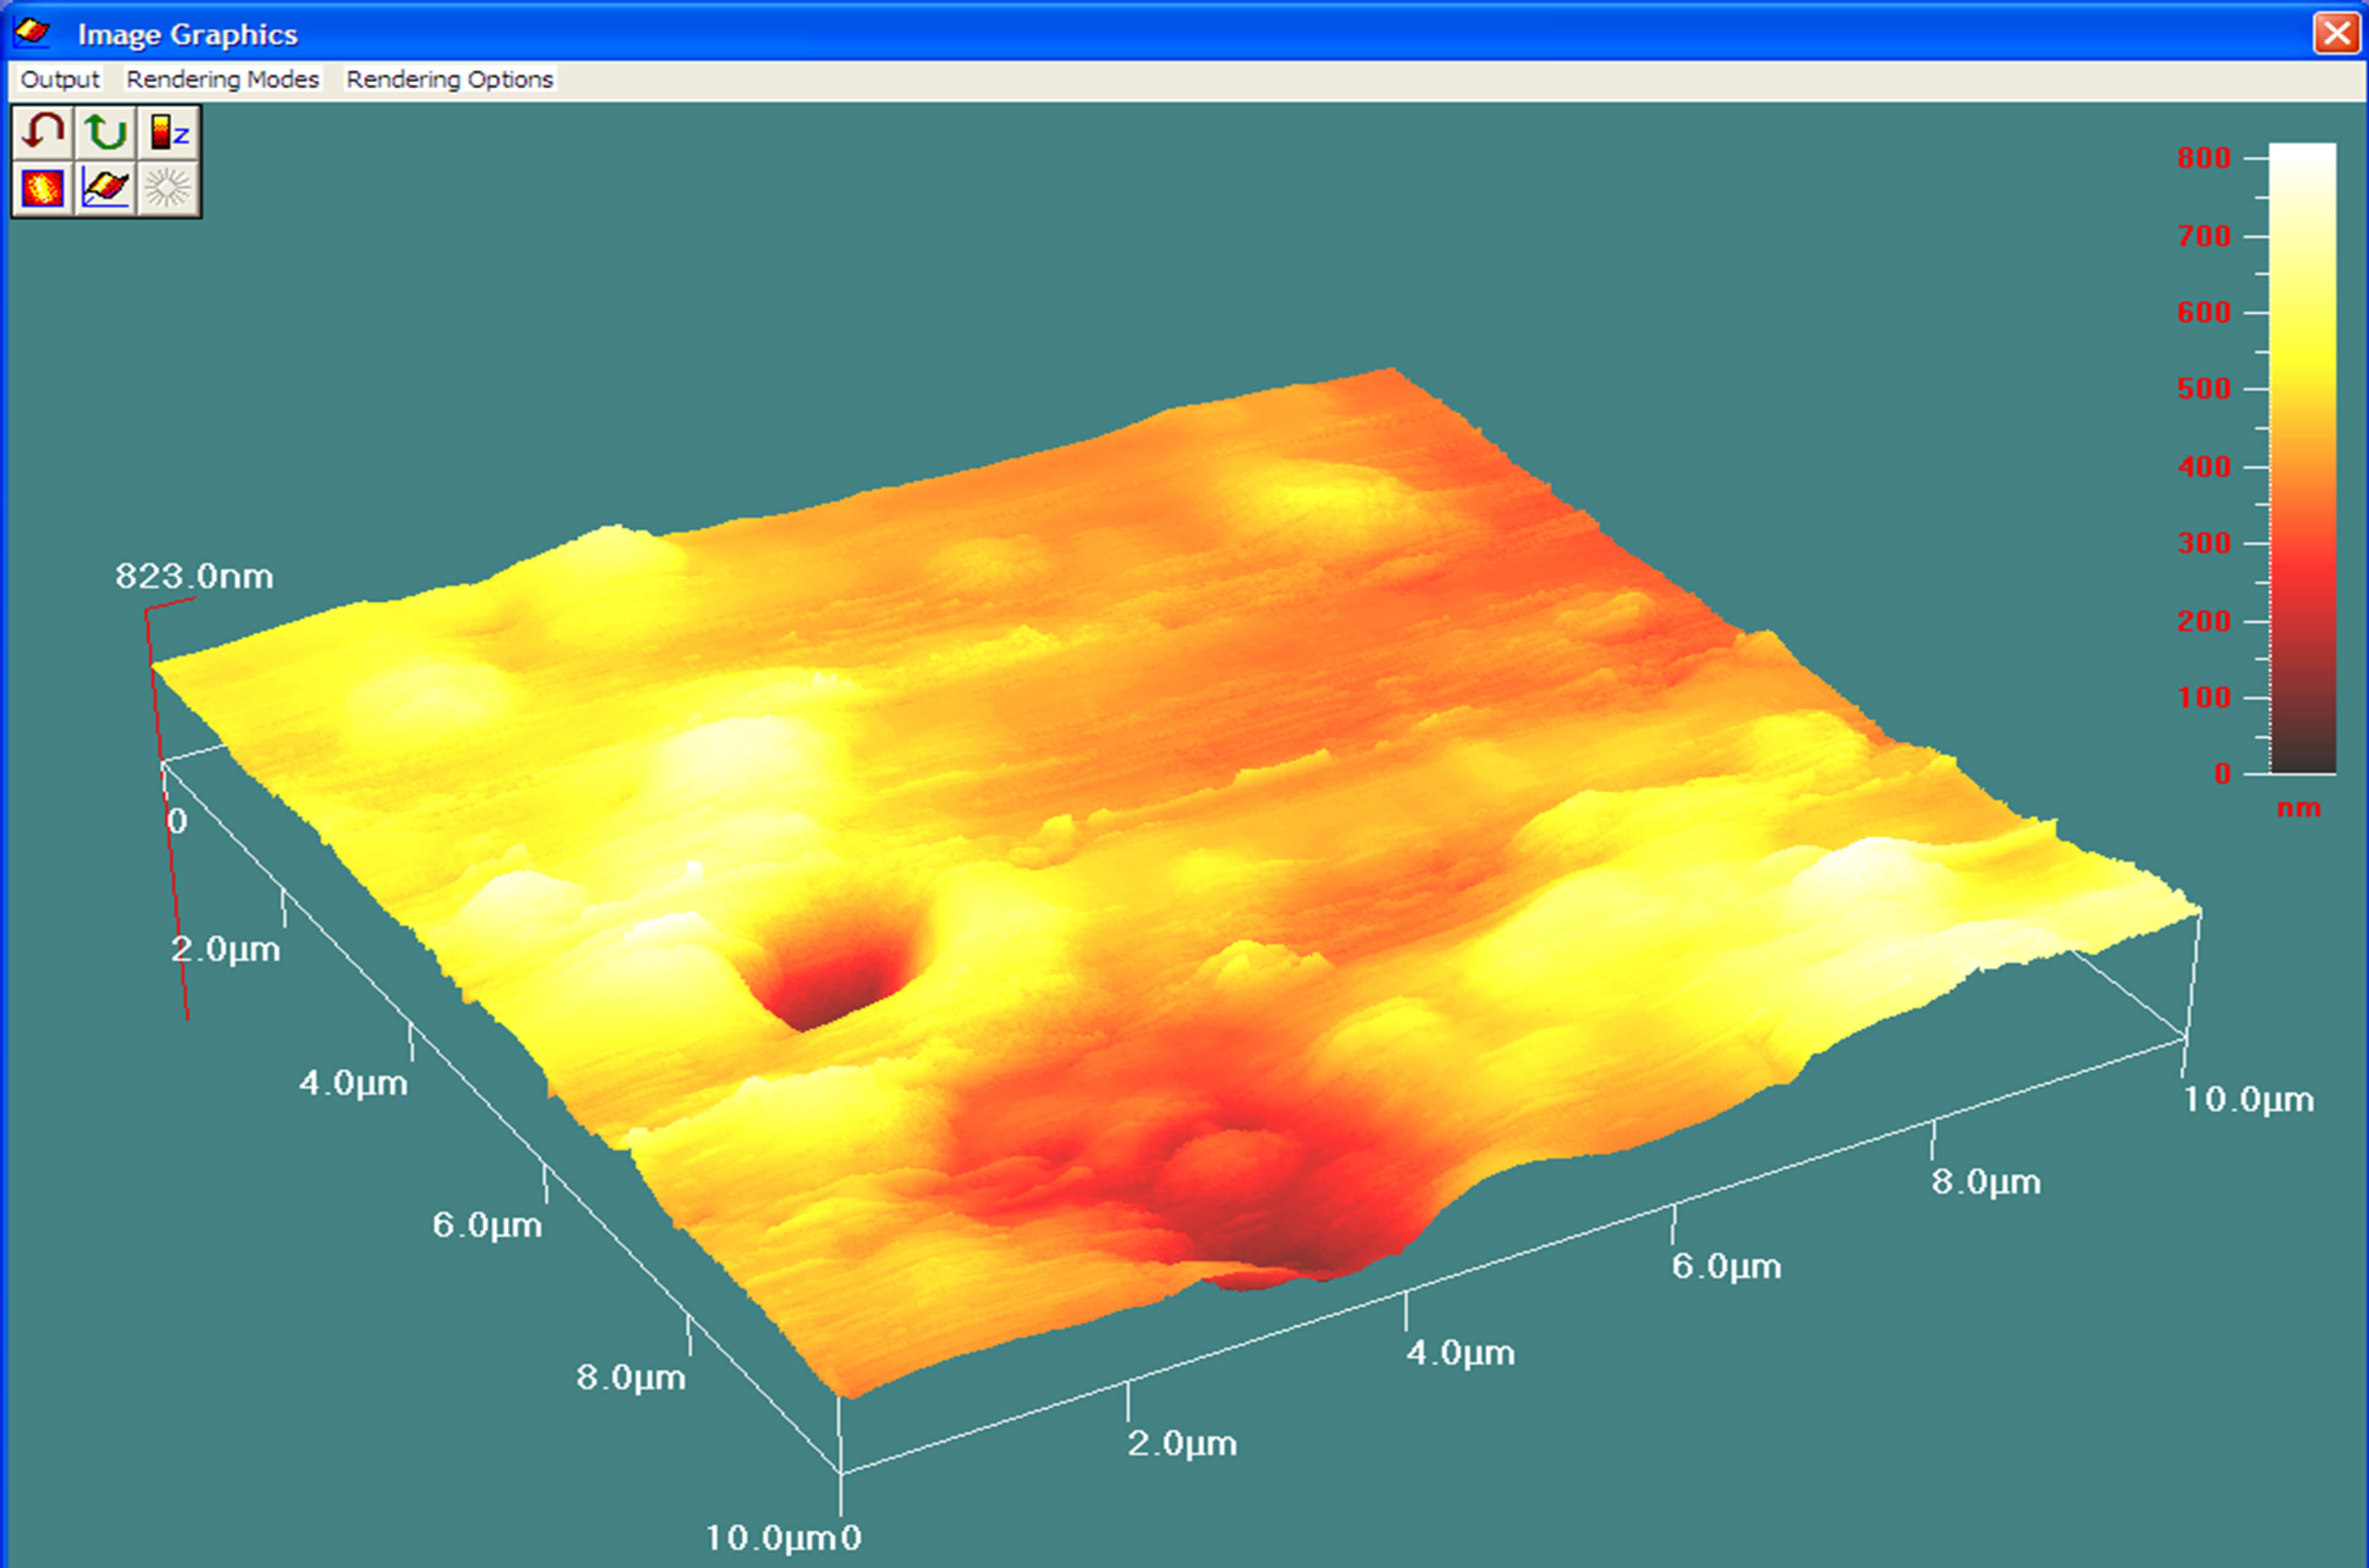
Figure 2. A 3-D AFM image of LA encapsulated into whey-protein-κ–carrageenan matrix. The diameter of the particles ranges from 50 to 800 nm.
Figure 3 shows screen shut images of two microcapsules. The microcapsules were very spherical with average size of 2.76 µm. The structure of each capsule revealed two distinct layers surrounding a core oil droplet. The layer surrounding the oil is designated as the protein layer, as it represents the first hydrophilic substance to which the oil was embedded, and the surface layer represents the κ-carrageenan layer. The density of particles was 5,351,302/ml of sample analyzed, which is an indication of a good dispersion of the microcapsules. The uniformity observed in the sizes of the microcapsules supports the idea of possible agglomeration during the freeze-drying of the nanocapsules, as also observed in the 3-D AFM image.
3.3. Examination of the Physical State of Amorphous Dried Nanocapsules by Differential Scanning Calorimetry (DSC)
Differential scanning calorimetry (DSC) was used to investigate the physical state of nanoencapsulated LA by scanning dry particles in the temperature range of 0˚C to 100˚C. Figure 4 shows a DSC thermogram of encapsulated LA. The thermogram indicates two consecutive glass transitions. The onset of the first transition occurs
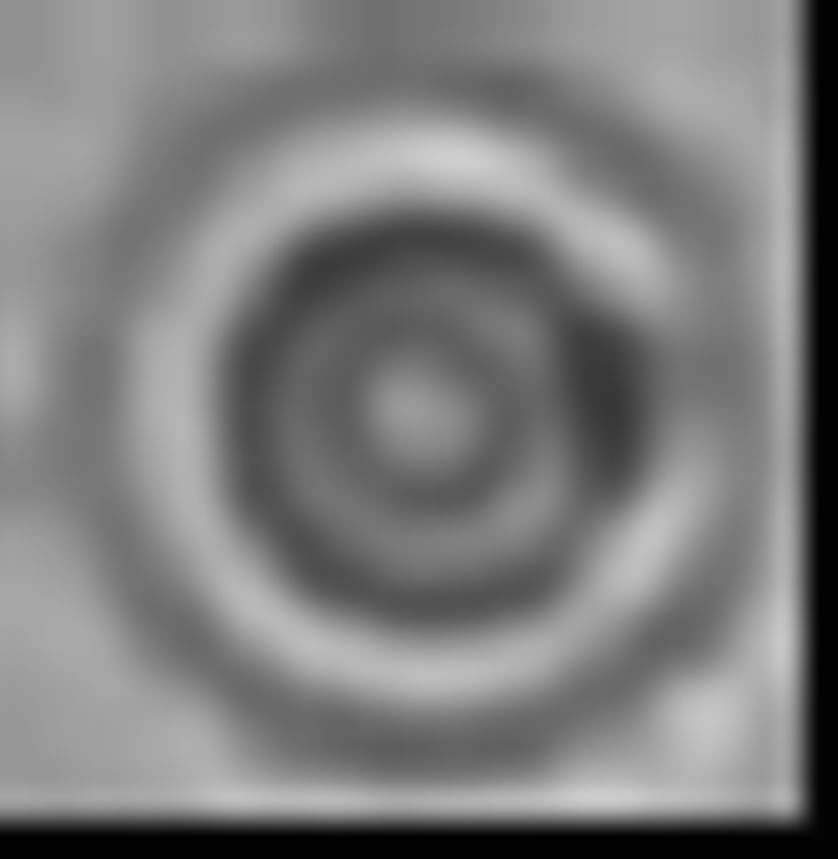

Figure 3. FlowCam imaging of microcapsules.
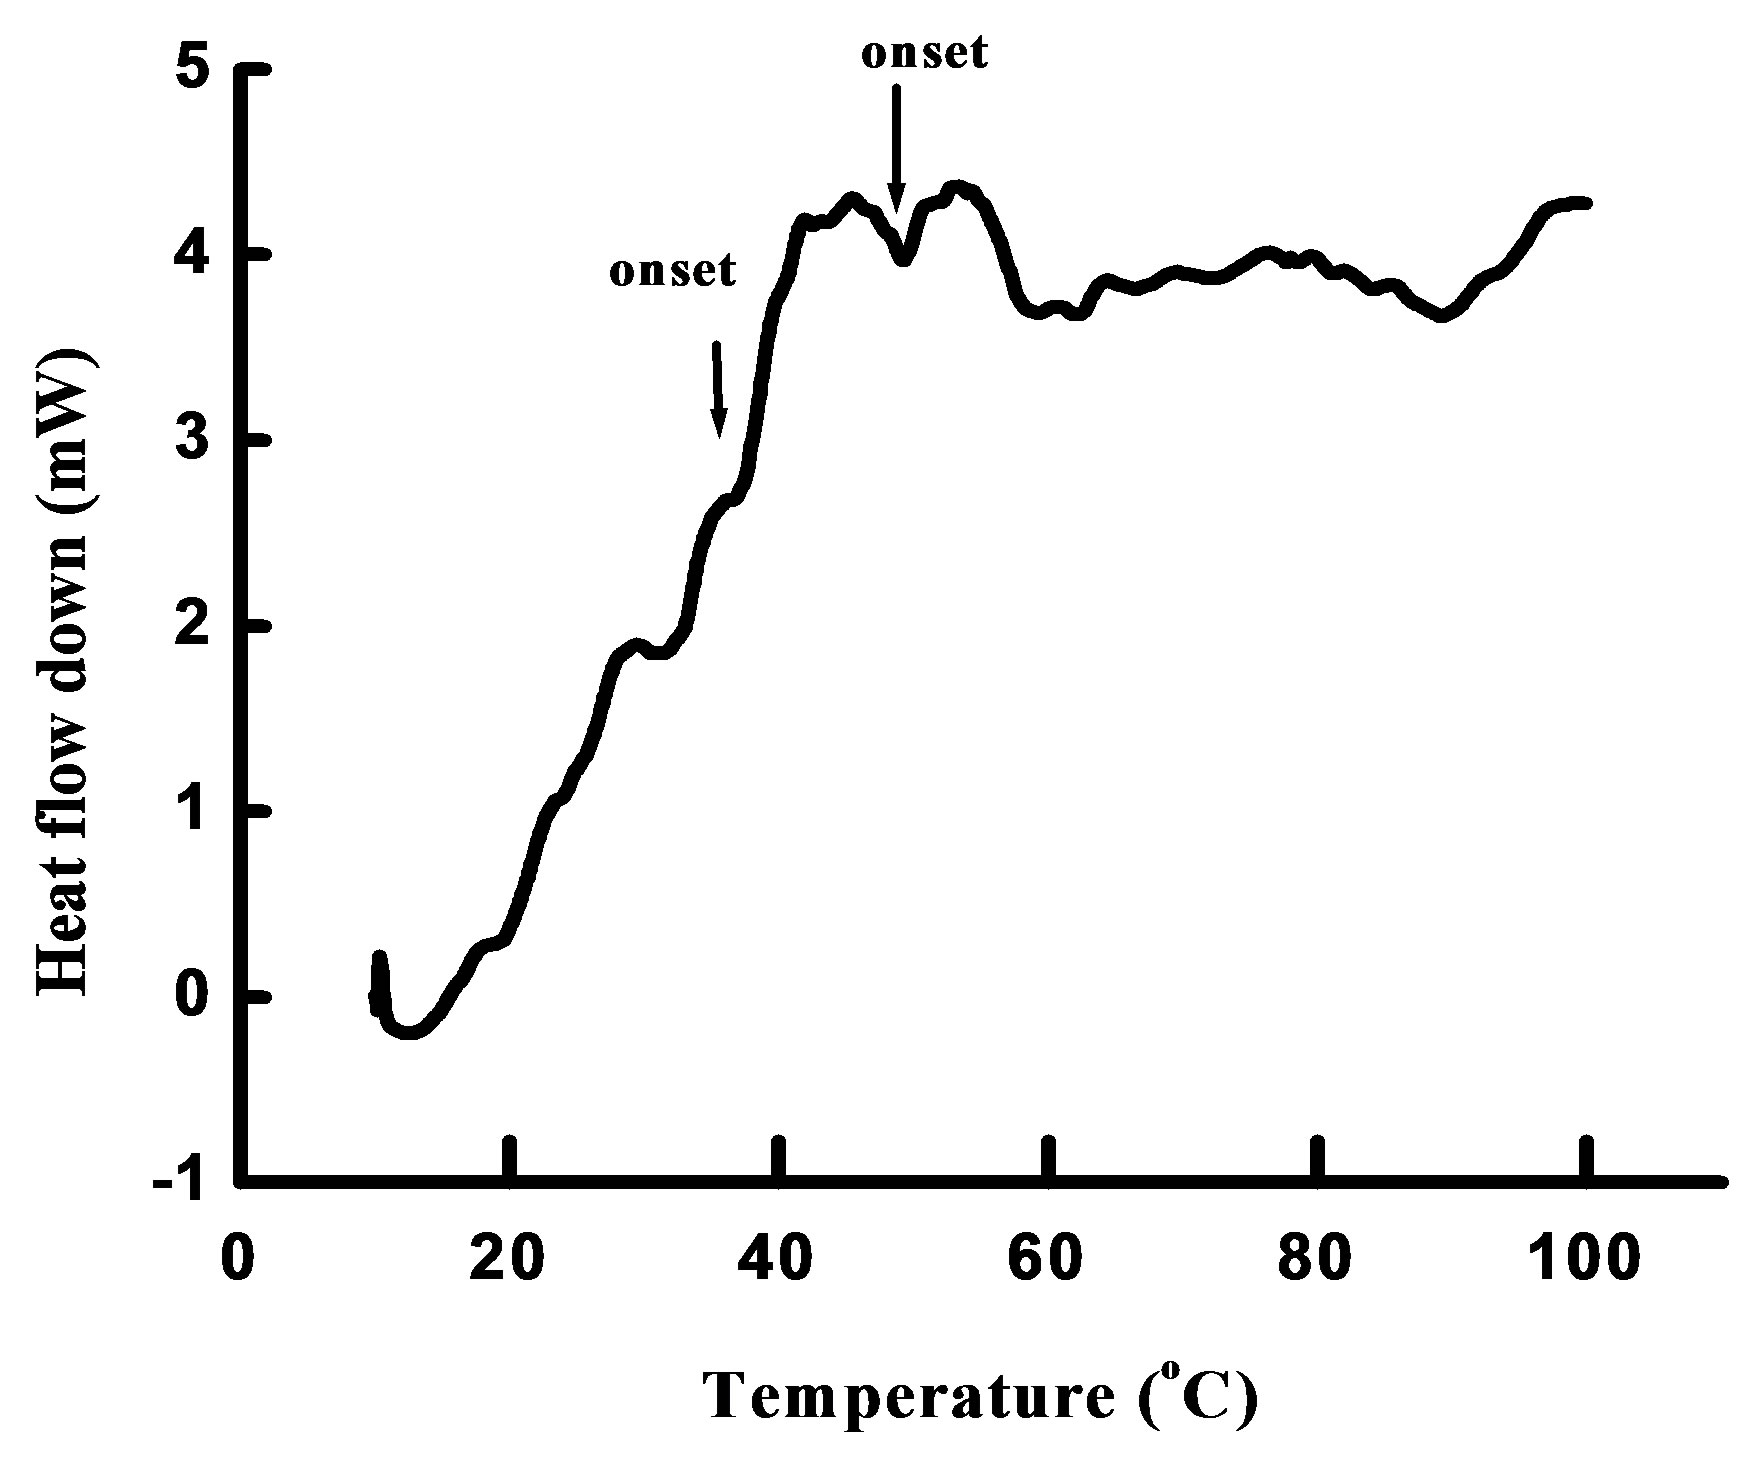
Figure 4. DSC thermogram of dried LA in whey-protein- κ-carrageenan matrix. The change in heat capacity indicates two consecutive glass transitions.
at 46.08˚C and the onset of the second transition occurs at 57.44˚C. The first onset is close to 49˚C, as reported by Schuck et al. [17] for whey protein powder at 11% relative humidity. The second glass transition temperature (Tg) is attributable to κ-carrageenan. The occurrence of a dual transition is in agreement with the AFM result, which indicated two polymeric layers around the oil droplet. Tg is related to the physical stability of amorphous formulations [18,19]. Above Tg, the stability of amorphous foods and pharmaceuticals is reduced because of an increase in molecular mobility of component molecules [20]. Thus, keeping the sample at a temperature above Tg may induce physical changes in the coating matrix, and subsequently, the lipophilic core material could be released. Therefore, temperature above Tg could be examined to explore the conditions pertinent for controlled release and stability of the encapsulated LA.
3.4. Evaluation of Encapsulation Efficiency by HPLC and Gravimetric Methods
The HPLC and gravimetrically data of surface and encapsulated LA are presented in table 1. The surface oil contents calculated by gravimetric and HPLC analysis were 3.31 ± 0.02 μg/100 mg and 3.42 ± 0.03 μg/100 mg, respectively. The resulting encapsulation efficiency was 83.5% for the gravimetry and 82.9% for the HPLC analysis. Encapsulation efficiency achieved in this study was higher than that reported by Calvo et al. [21] who encapsulated 53% of olive oil in gelatin, arabic gum, maltodextrin, and sodium caseinate by freeze-drying. However, are lower than the encapsulation efficiency of 89.6% realized in spray-dried microencapsulation of conjugated LA (CLA). The difference in encapsulation efficiency between our results and those of Calvo et al. [21] could be attributed to the drying technique used. Since spray-drying being a faster technique than freezedrying, it is likely that oil droplets enclosed inside the coating matrix would be more stable than those resulting from freeze-drying. Figure 5(a) shows a chromatogram of LA used as a standard while Figure 5(b) shows a chromatogram of LA after six hours exposure to aw 0.662. The chromatogram is typical of LA, and refers to the HPLC chromatograms of LA reported by Melis et al. [22] and Czauderna et al. [23]. Peaks 1, 2, 3, 4 and 5 correspond to the trans-trans, cis9t11, metabollltes CLA, cis8trans10 and cis-cis-CLA isomers, respectively. At aw values of 0.239 and 0.333, no LA was released. At the value of 0.444, LA released was perceptible and then increased with an increase in aw of up to 74% of encapsulated LA at aw value of 0.764. The sudden increase in the amount of LA at aw suggests a threshold aw value in the 0.444 - 0.538 region below which the

Table 1. Determination of surface and encapsulated oil (μg LA/100 mg) by gravimetric and HPLC measurements, n = 3.
 (a)
(a)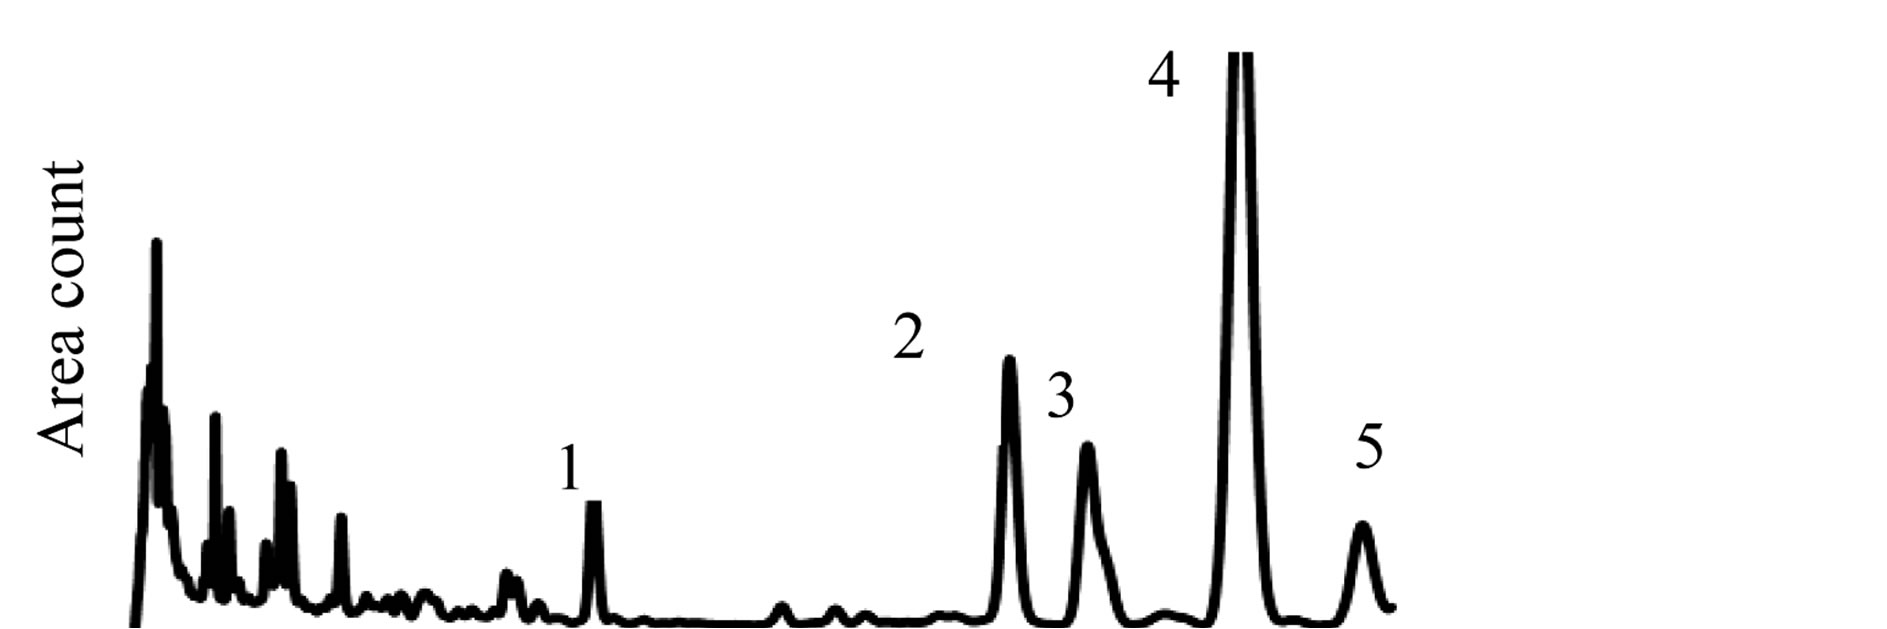 (b)
(b)
Figure 5. Chromatogram of LA released after exposure at aw value of 0.662 (a), and a chromatogram of LA used as standard (b).
biopolymeric coating matrix was stable. Release of LA might occur concomittantly with plasticization of the matrix at this aw threshold, allowing LA to escape from the coating shell. This water activity, below which no release was observed, is critical for the preservation of the stability of the coated LA, while aw values above 0.538 appeared to be favorable for the desired controlled release of LA. The relationship between aw values and the release profile of LA is depicted in Figure 6.
3.5. Effect of Water Activity on Controlled-Release of LA
The controlled release of nanoencapsulated LA was studied by measuring the amount of LA in nanocapsules after exposure of samples at aw 0.239, 0.333, 0.444, 0.538, 0.666 and 0.764. Figure 6 shows a plot of the amount of LA released at various water activities.
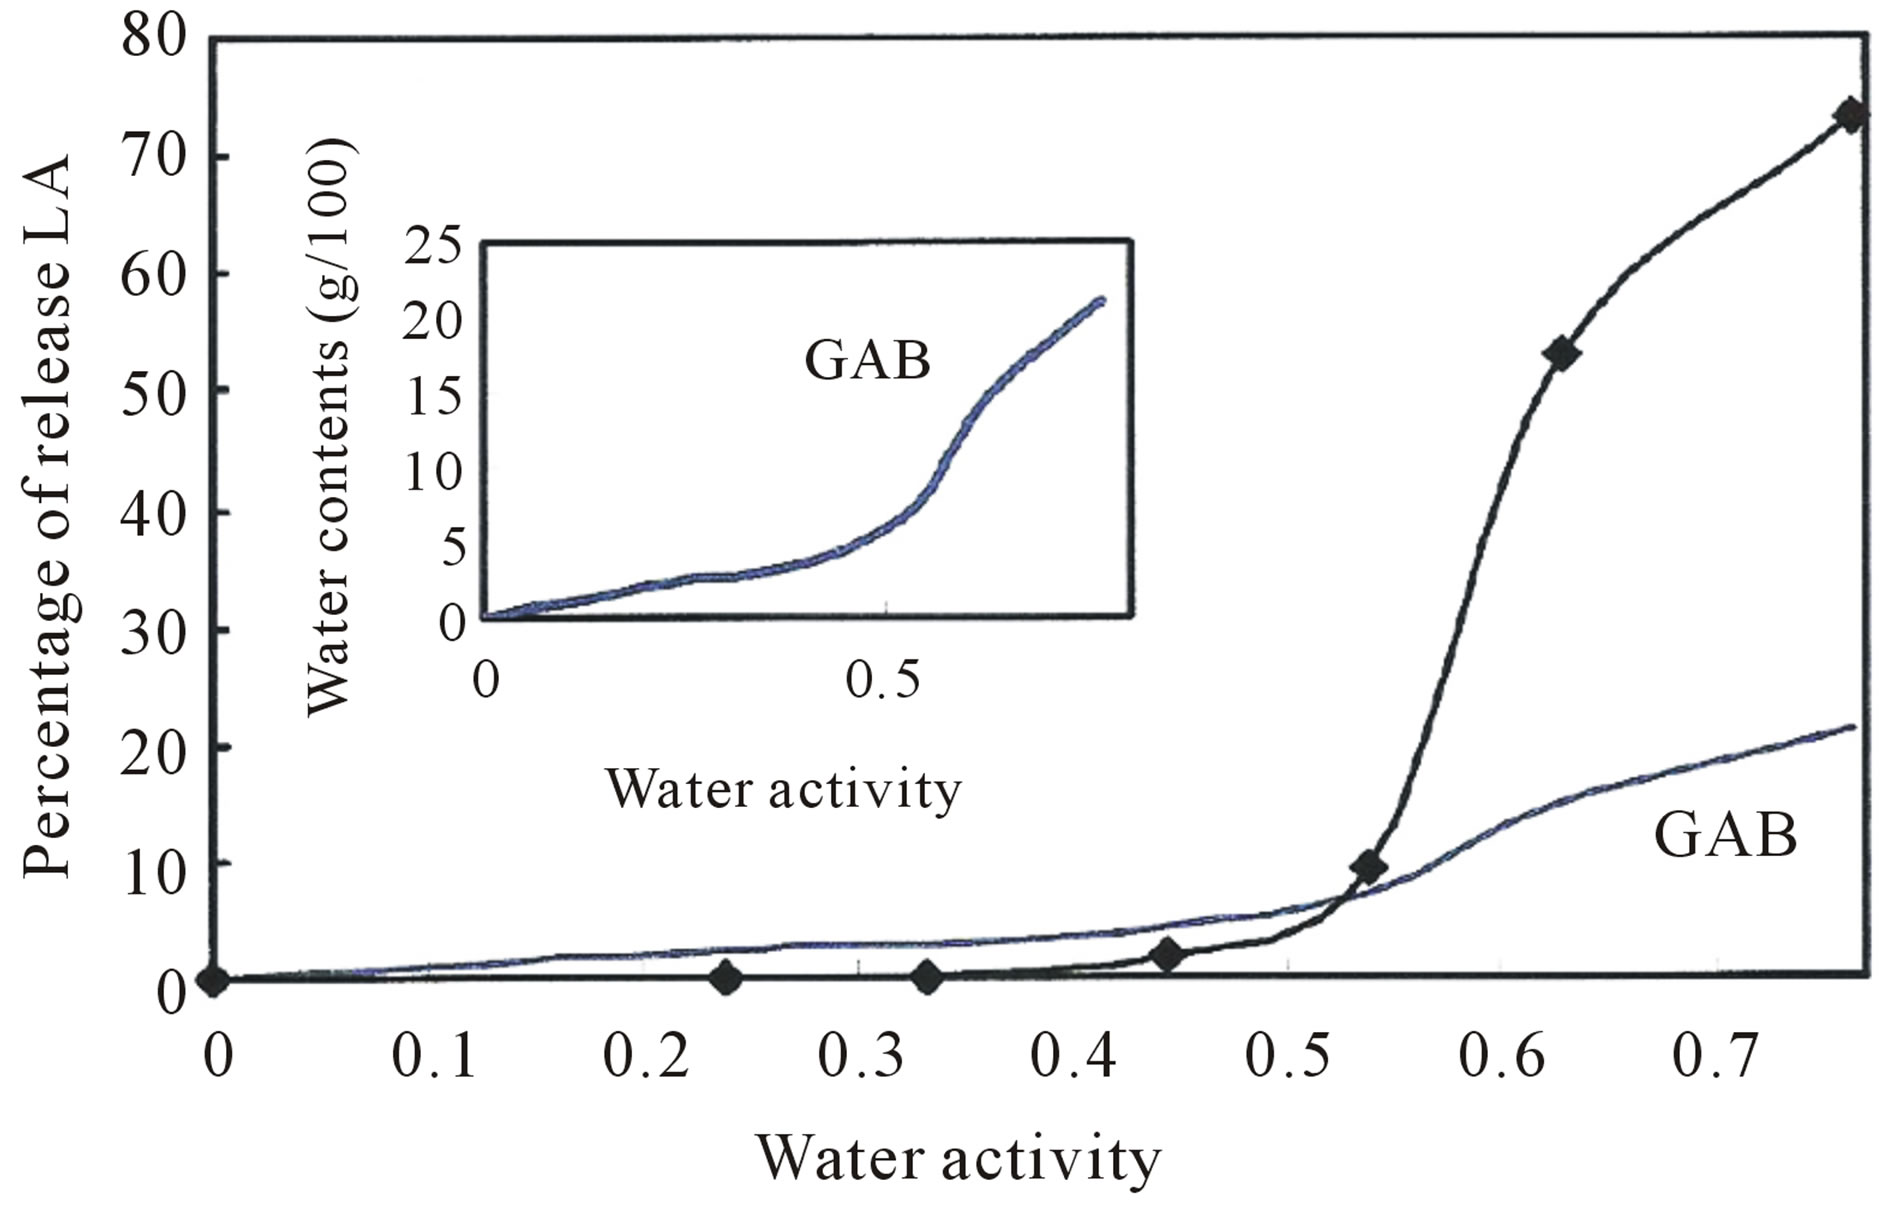
Figure 6. Plots of percentage of LA vs. water activity. The water sorption data are fitted to the GAB sorption isotherms model.
3.6. Effect of Quercetin on the Stability of Encapsulated LA
The thermal stability of LA was studied after exposure at 60˚C for several hours. The amounts of HCD was measured by the method of Frankel et al. [24], and the amount of TBARS was measured using the method reported by Viljanen et al. [15], taking the nonencapsulated LA as a sample control. The vitamin α-tocopherol is well known antioxidant that prevents the formation of oxidative species. Therefore, assessing the antioxidant activity of quercetin can be realized by comparing quercetin with α-tocopherol. Similarly, the effect of nanoencapsulation on the oxidative stability of LA could be assessed by measuring the amount of HCD and TBARS. Figure 7" target="_self"> Figure 7 shows a plot of the amount of HCD formed vs. time period. The amounts of HCD formed upon 80 h of heating at 60˚C were 14.9 μMHCD/100g in LA embedded with α-tocopherol, 18.2 μMHCD/ 100 g in LA embedded with quercetin, 34.4 μMHCD/100g in LA encapsulated without quercetin, and 69.1 μMHCD/ 100 g in non-encapsulated LA. With increasing amount of HCD, the samples follow the order: LA with α-tocopherol < LA with quercetin < LA without quercetin. The amounts of TBARS upon thermally induced rancidity presented in Figure 8 and follow a similar trend.
These results indicated that encapsulation of LA with quercetin provided protection against thermally induced rancidity. Morever, quercetin limited the extent of formation of HCD and TBARS to a degree close to the LA encapsulated with α-tocopherol.
3.7. Long Term Stability of LA
Long term stability of LA was studied by measuring the amounts of oxidative species in samples stored at room temperature for 12 weeks at time intervals of 2 weeks. The amounts of HCD and TBARS formed in the samples

Figure 7. Plots of HCD concentration vs. time in LA encapsulated in the presence of α-tocopherol (1), of quercetin (2), LA encapsulated without quercetin (3), and non-encapsulated LA (4) following a thermally induced rancidity.

Figure 8. Plots of TBARS concentration vs. time in LA encapsulated in the presence of α-tocopherol (1), quercetin (2), LA encapsulated without quercetin (3), and non-encapsulated LA (4) following a thermally induced rancidity.
were measured using the method employed in the thermally induced rancidity, described above. Figure 9 shows the formation of HCD in α-tocopherol-embeddedLA, in quercetin-embedded-LA, in LA encapsulated without quercetin, and in non-encapsulated LA.
The formation of TBARS in the samples presented in Figure 10 indicated that the amounts of TBARS follows a similar trend as in the formation of HCD.
A comparison of HCD and TBARS formed in the samples after 12 weeks gave the following results: 19.21 μM/100 g, 31.41 μM/100 g, 40.21 mM/100 g and 70.31 mM/100 g for HCD and 17.41 mM/100 g, 24.21 mM/100 g, 27.61 mM/100 g and 57.71 μM/100 g for TBARS, for α-tocopherol-LA, quercetin-embedded-LA, LA encapsulated without quercetin, and in non-encapsulated-LA, respectively. The inhibition percentages for HCD and
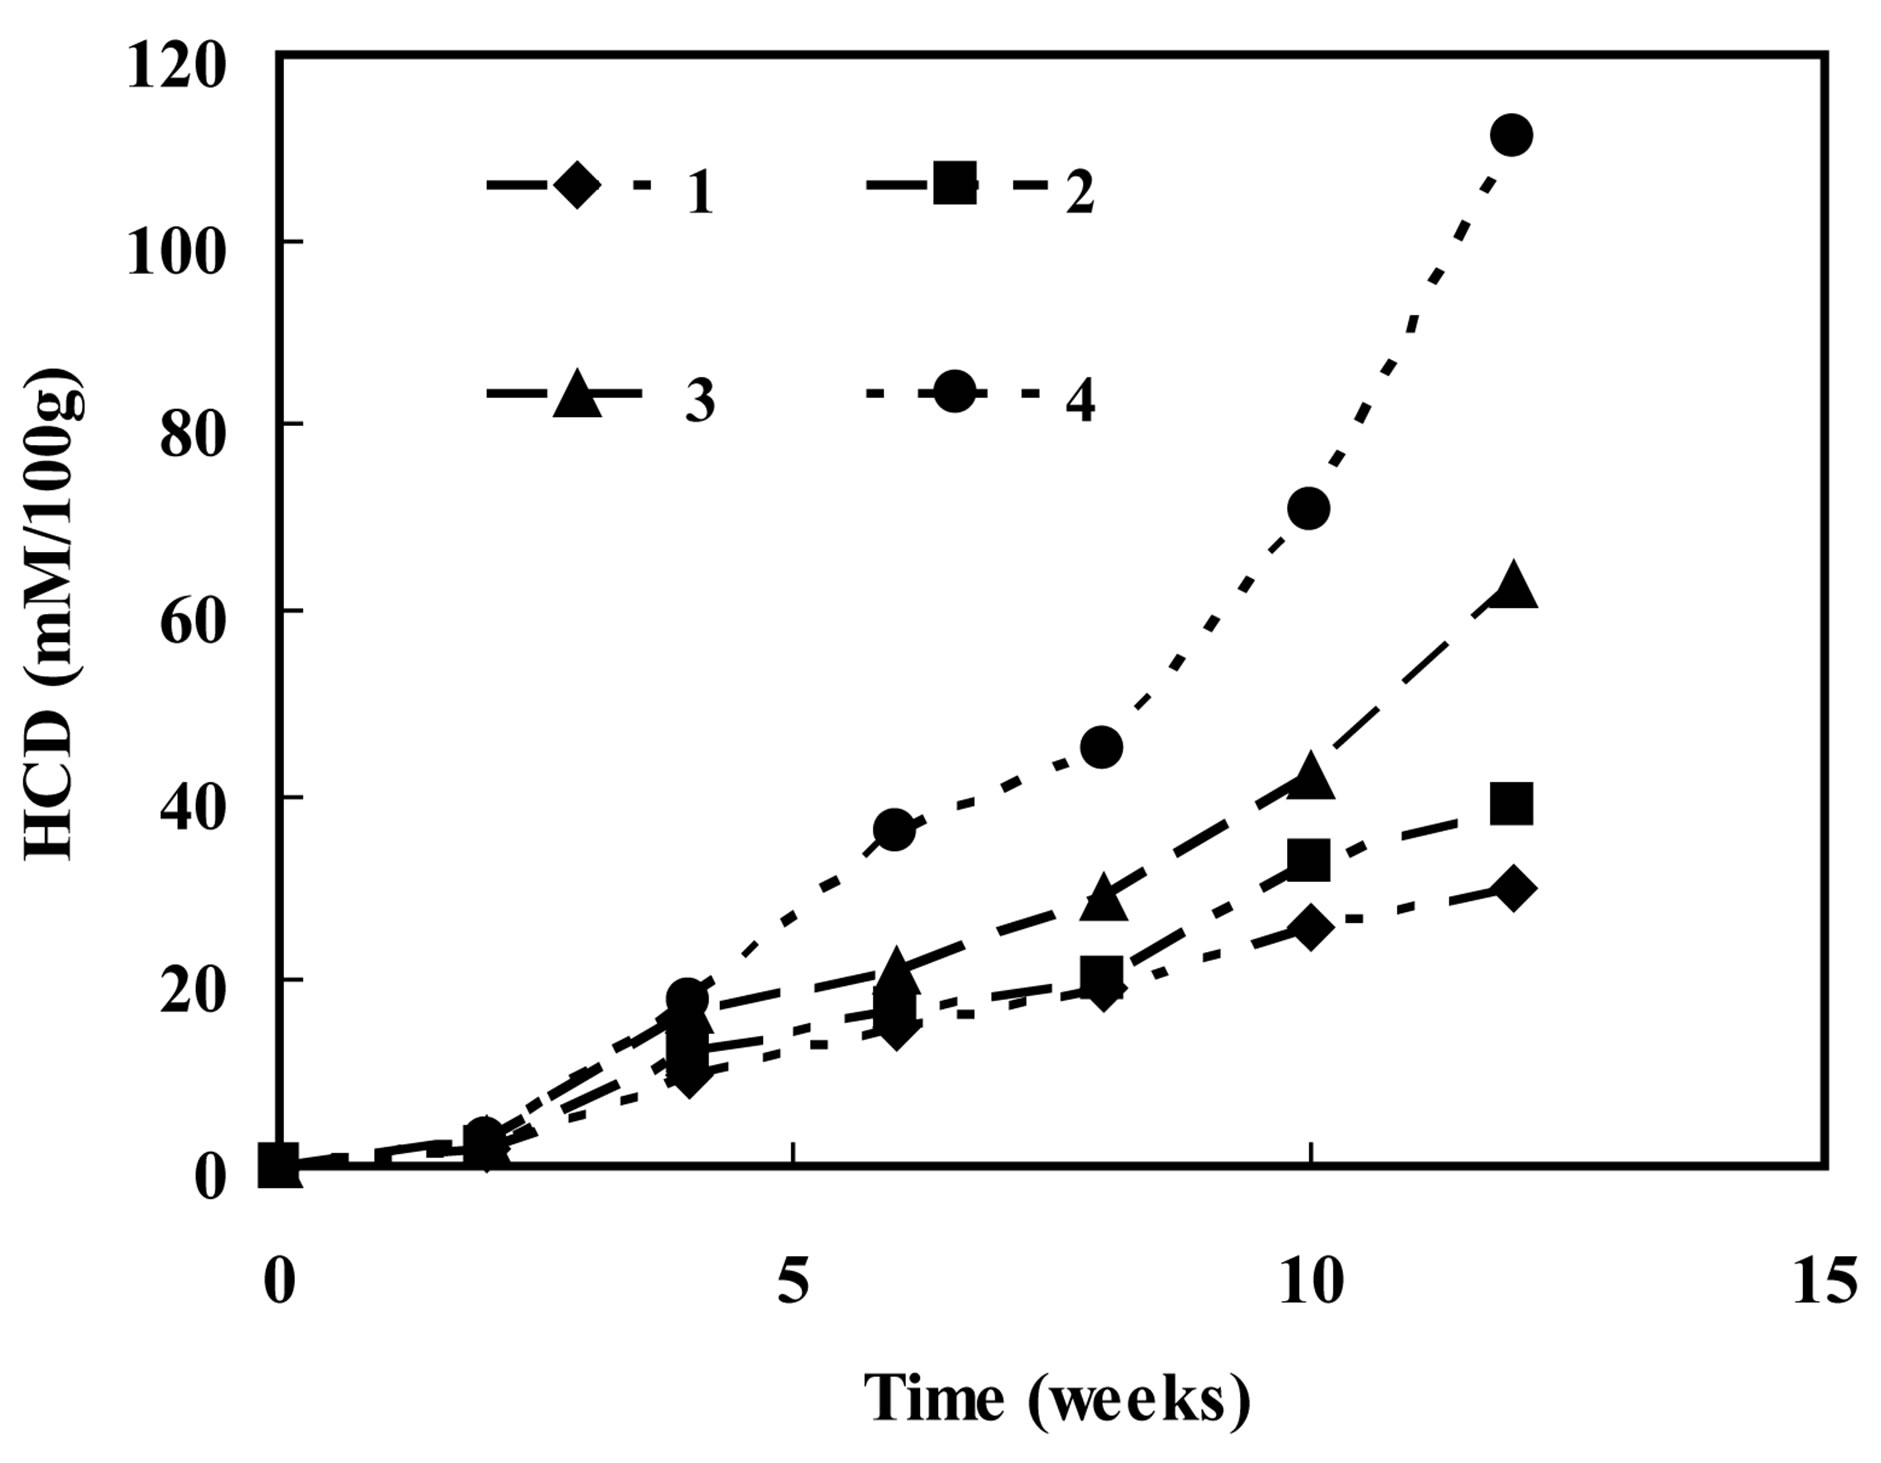
Figure 9. Plots of HCD vs. time in LA encapsulated in the presence of α-tocopherol (1), of quercetin (2), encapsulated without antioxidant (3), and non-encapsulated LA (4) following a storage of 12 weeks.

Figure 10. Plots of TBARS vs time in LA encapsulated in the presence of α-tocopherol (1), in the presence of quercetin (2), LA encapsulated without quercetin (3), and non-encapsulated LA (4) for a period of 12 weeks of storage.
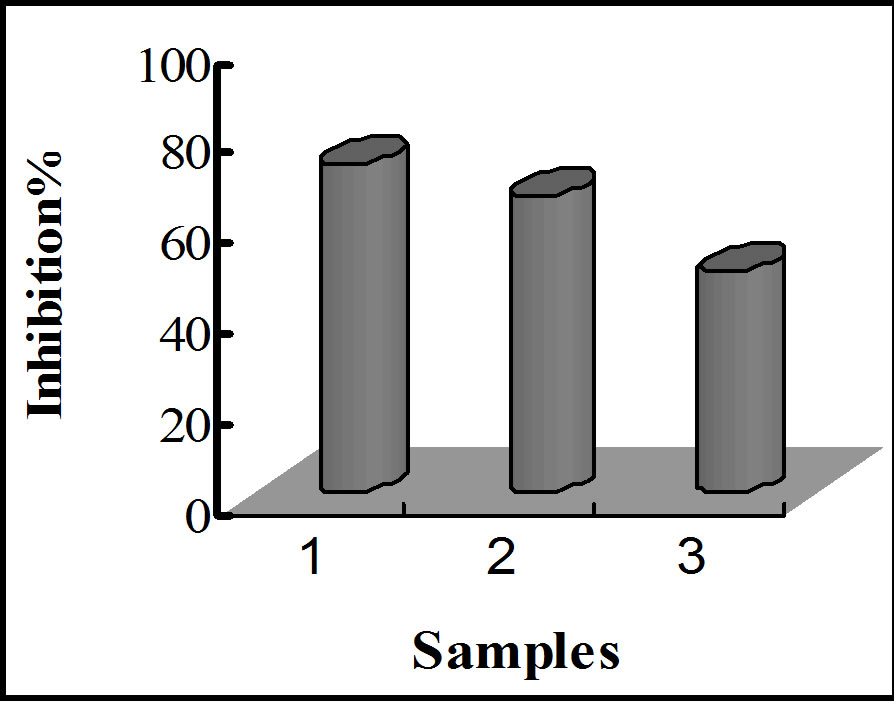
TBARS formation exhibited by LA with α-tocopherol, LA with quercetin, and LA without quercetin for each treatment are shown in figure 11. Table 2 shows a summary of inhibition percentages, with a trend similar to that observed for the amount of oxidative species. These results indicate that nanoencapsulation provides a minimum protection against oxidative attacks, and quercetin is a potential antioxidant for linoleic acid, exhibiting antioxidant activity relatively closed to that of α-tocopherol.
These results are consistent with those reported by Won et al. [25] on linoleic and gamma linolenic acid, but contradictory to the proactive properties of quercetin at low concentrations as reported by the Rolewski et al. [8].

Table 2. Summary of percentage inhibition in encapsulated samples.
 (a)
(a)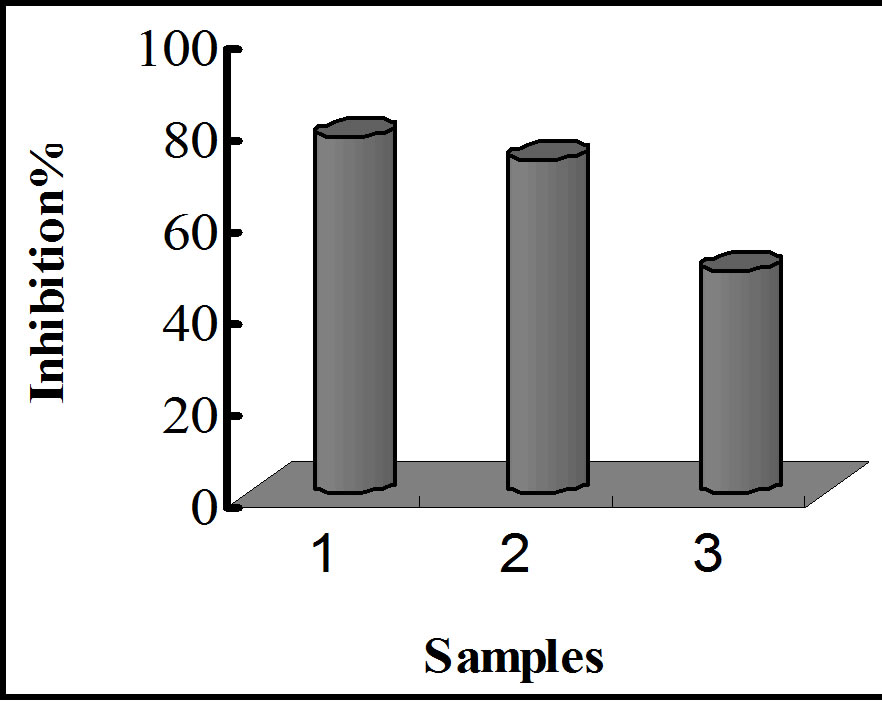 (b)
(b)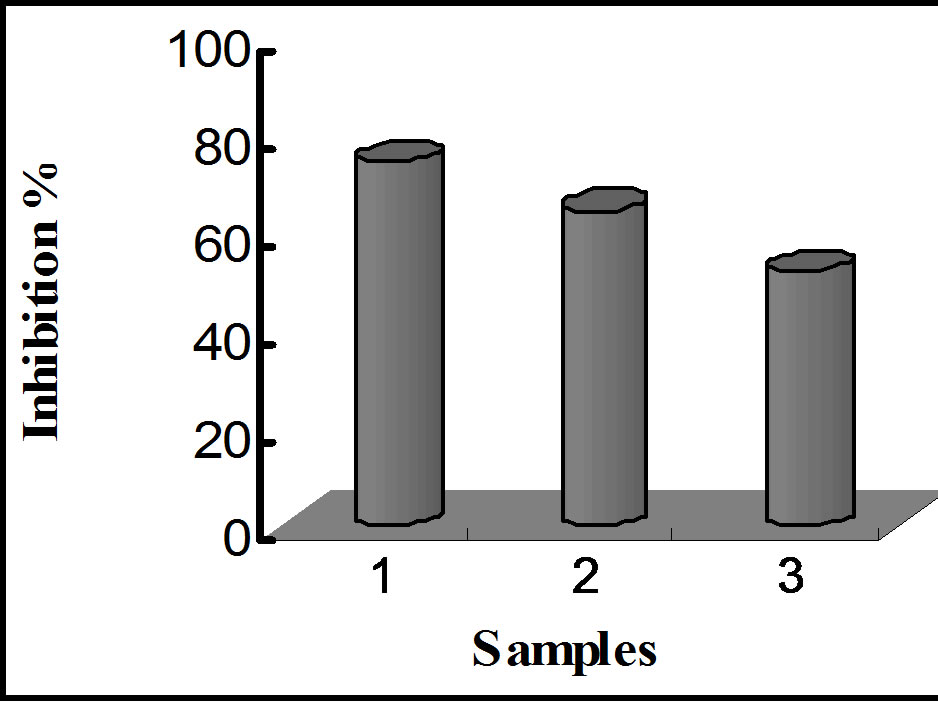 (c)
(c)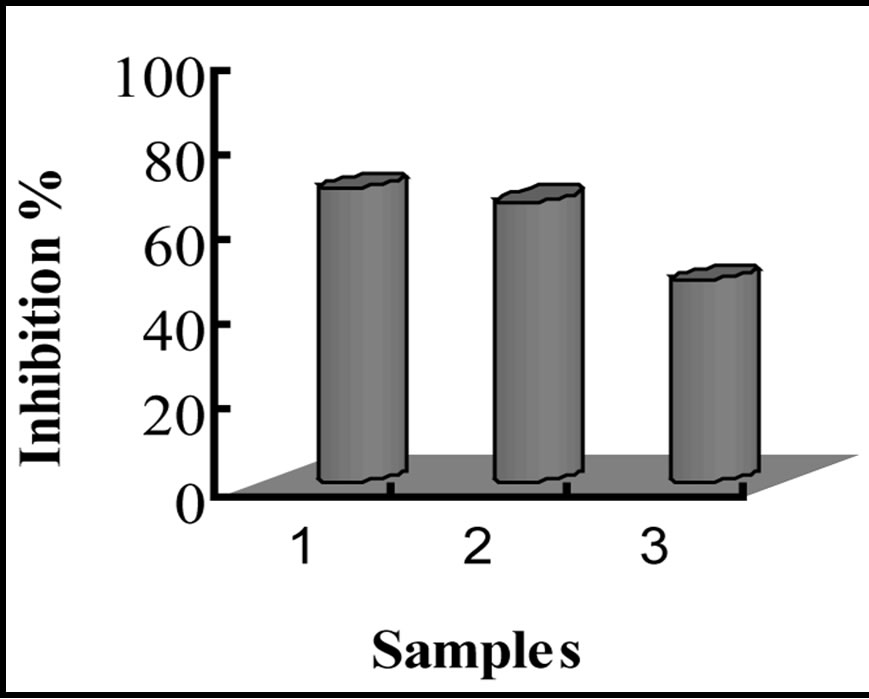 (d)
(d)
Figure 11. Bar graphs showing oxidative inhibition of LA upon storage at various conditions. (a) and (b) represent inhibition of HCD and TBARS against thermally induced oxidation; (c) and (d) represent inhibition of HCD and TBARS after 12 weeks of storage.
Just as α-tocopherol, our results indicate that quercetin improves the thermal and time-dependent stability of LA.
4. Conclusion
The present study shows that successful coating of LA with whey-protein and with κ-carrageenan results in the formation of protective layers around LA. The columbic nature of the interactions between these biopolymers may contribute to the stability of the matrix. Nanoencapsulation and antioxidants such as quercetin contribute to provide stability to the LA against time-dependent oxidation and thermally induced rancidity. Water activity has proven to play an important role in the release of LA in encapsulation, due to its plasticizing effect on the coating matrix. Further study is needed to examine the combined effect of temperature above the glass transition and the water activity in predicting the conditions that will pertain to the release of encapsulated substances. This information is critical for preparation, storage, and controlled-release of functional lipophilic compounds experiencing low stability.
5. Acknowledgements
This project was supported by the Office of Sponsored Projects at Western Illinois University (URC grant). The authors thank Mr. Andrew Gelinas at Fluidic Imaging Technology, Maine, for helping with The FlowCam Imaging.
REFERENCES
- Y. T. Chiu, C. P. Chiu, J. T. Chien, G. H. Ho, J. Yang and B. H. Chen, “Encapsulation of Lycopene Extract from Tomato Pulp Waste with Gelatin and Poly(γ-Glutamic Acid) as Carrier,” Journal of Agricultural and Food Chemistry, Vol. 55, No. 13, 2007, pp. 5123-5130. doi:10.1021/jf0700069
- A. Gharsallaoui, G. Roudaut, O. Chambin, A. Voilley and R. Sayrel, “Applications of Spray-Drying in Microencapsulation of Food Ingredients: An Overview,” Food Research International, Vol. 40, No. 9, 2007, pp. 1107-1121. doi:10.1016/j.foodres.2007.07.004
- X. Wang, Y.-W. Wang and Q. Huang, “Enhancing Stability and Oral Bioavailability of Polyphenols Using Nanoemulsions,” American Chemical Society Publications, Vol. 1007, 2009, pp. 198-212. doi:10.1021/bk-2009-1007.ch013
- M. A. M. Gijs, “Magnetic Beads Handling in Chips: New Opportunities for Analytical Application,” Microfluid and Nanofluid, Vol. 1, No. 22-40, 2004, pp. 22-40. doi:10.1007/s10404-004-0010-y
- H. Thembela and H. Mbhuti, “Nanotechnology and the Challenge of Clean Water,” Nature Nanotechnology, Vol. 2, 2007, pp. 663-664. doi:10.1038/nnano.2007.350
- P. Walter, E. Welcomme, P. Hallégot, N. J. Zaluzec, C. Deep, J. Castaing, P. Veyssière, R. Bréniaux, J.-L. Lévê- que and G. Tsoucaris, “Early Use of PbS Nanotechnology for an Ancient Hair Dyeing Formula,” American Chemical Society, Vol. 6, No. 10, 2006, pp. 2215-2219.
- S. C. Cunnane and M. J. Anderson, “Pure Linoleate Deficiency in the Rat: Influence on Growth, Accumulation of n-6 Polyunsaturated, and [1-14C]Linoleate Oxidation,” Journal of Lipid Research, Vol. 38, 1997, pp. 805-812.
- J. Won, M.-H. Oh, J. H. Kang, M. S Kang, J.-H. Choy and S. Oh, “Stability Analysis of Zinc Oxide-Nanoencapsulated Linoleic Acid and Gamma-Linolenic Acid Conjugated,” Journal Food Science, Vol. 73, No. 8, 2008, pp. N39-N43. doi:10.1111/j.1750-3841.2008.00924.x
- H. D. Sesso, J. M. Gaziano, S. Luis and J. E. Buring, “Flavonoid Intake in the Risk of Cardiovascular Disease in Women1,2,3,” American Journal Clinical Nutrition, Vol. 77, No. 6, 2003, pp. 1400-1408.
- J. A. Ross and C. M. Kasum, “Dietary Flavonoids: Bioavailability, Metabolic Effects and Safety,” Annual Review, Vol. 22, 2002, pp. 19-34. doi:10.1146/annurev.nutr.22.111401.144957
- R. Mikstarcka, A. M. Rinando and E. Ignatowick, “Antioxidant Effect of Trans-Sesveratrol, Pterostilbene, Quercetin and Their Combinations in Human Erithrocytes in Vitro,” Plant Foods for Human Nutrition, Vol. 65, No. 1, 2010, pp. 57-63. doi:10.1007/s11130-010-0154-8
- H. Nagata, S. Takekoshi, T. Honna and K. Watanabe, “Antioxidative Action of Flavonoids, Quercetin and Catechin, Mediated by Activation of Glutathione Peroxidase,” Journal of Experimental and Clinical Medicine, Vol. 24, No. 1, 1999, pp. 1-11.
- C. Van Den Berg and Bruin, “Water Activity and Its Estimation in Food Systems,” In: L. B. & G. F. Steward, Water Activity: Influences in Food Quality, Academic Press, New York. 1981, pp.1-61.
- C. Ameho, C.-Y. O. Chen, D. Smith, C. Sanchez-Moreno, P. E. Milbury and J. Blumberg, “Antioxidant Activity and Metabillites Profile of Quercetin in Vitamin-E-Depleted Rats,” Journal of Nutritional Biochemistry, Vol. 19, No. 7, 2008, pp. 467-474. doi:10.1016/j.jnutbio.2007.06.004
- K. Viljanen, A. L. Halmos, A. Sincliar and M. Heinonen, “Effect of Blackberry and Rasberry Juice on Whey Protein Emulsion Stability,” European Food Research and Technology, Vol. 221, No. 5, 2005, pp. 602-609. doi:10.1007/s00217-005-0033-y
- L. M. Tong, S. Sasaki, D. J. McClements and E. A. Decker, “Antioxidant Activity of Whey Protein in a Salmon Oil Emulsion,” Journal of Food Science, Vol. 65, No. 8, 2000, pp. 1325-1329. doi:10.1111/j.1365-2621.2000.tb10606.x
- S. D. Bhale, Z. Xu, W. Prannyawatkul, J. M. King and J. S. Godber, “ Oragano and Rosemary Extracts Inhibit Oxidation of Long Chain n-3 Fatty Acids in Menhaden Oil,” Journal of Food Science, Vol. 72, No. 9, 2007, pp. C504- C509. doi:10.1111/j.1750-3841.2007.00569.x
- P. Schuck, E. Blanchard, A. Dolivet, S. Méjean, E. Onillon, and R. Jeantet, “Water Activity and Glass Transition in Dairy Ingredients,” Dairy Science and Technology, Vol. 85, No. 4-5, 2005, pp. 295-304. doi:10.1051/lait:2005020
- Y. Roos, “Water Activity and Physical States Effects on Amorphous Food Stability,” Journal of Food Processing and Preservation, Vol. 16, No. 6, 1995, pp. 433-447. doi:10.1111/j.1745-4549.1993.tb00221.x
- L. Slade, H. Levine, J. Ievolella and M. Wang, “The Glassy State Phenomenon in Applications for the Food Industry. Approach to Structure-Function Relationships of Sucrose Cookie and Cracker Systems,” Journal of the Science of Food and Agriculture, Vol. 63, No. 2, 1993, pp. 133-176. doi:10.1002/jsfa.2740630202
- P. Calvo, T. Hernánedez, M. Lozano and D. Gonzán-DezGómez, “Microencapsulation of Extra-Virgin Olive Oil by Spray-Drying: Influence of Wall Material and Olive Quality,” European Journal of Lipid Science and Technology, Vol. 112, No. 8, 2010, pp. 852-858. doi:10.1002/ejlt.201000059
- M. P. Melis, E. Angioni, G. Carta, E. Murru, P. Scanu, S. Spada and S. Banni, “Characterization of Conjugated Linoleic Acid and Its Metabolites by RP-HPLC with Diode Array Detector,” European Journal of Lipid Science, Vol. 103, No. 9, 2001, pp. 594-632. doi:10.1002/1438-9312(200109)103:9<617::AID-EJLT6170>3.0.CO;2-C
- M. Czauderna, J. Kowalczy, M. Marounek, J. P. Michalski, A. J. Rozbicka-Wieczorek and K. A. Krajewska, “A New Internal Standard for HPLC Assay of Conjugated Linoleic Acid in Animal Tissue and Milk,” Czech Journal of Animal Science, Vol. 56, No. 1, 2009, pp. 23-29.
- E. N. Frankel, S.-W. Huang, R. Aeschbash and E. Prior, “Antioxidant Activity of a Rosemary Extract and Its Constituents, Carnosic Acid, Carnosol and Rosmarinic Acid, in Bulk Oil and Oil-In Water Emulsion,” Journal of Agricultural and Food Chemistry, Vol. 44, No. 1, 1996, pp. 131-135. doi:10.1021/jf950374p
- P. Rolewski, A. Siger, M. Nogala-Kalucka and K. Rolewski, “Evaluation of Antioxidant Activity of α-tocopherol and Quercetin of Phosphatidylcholine Using Chemiluminescent Detection of Lipid Hydroperoxides,” Polish Journal of Food and Nutritional Sciences, Vol. 59, No. 2, 2009, pp. 123-127.