American Journal of Operations Research
Vol. 2 No. 1 (2012) , Article ID: 17824 , 9 pages DOI:10.4236/ajor.2012.21001
Discriminating among Relatively Efficient Units in Data Envelopment Analysis: A Comparison of Alternative Methods and Some Extensions
1ALBA Graduate School of Business, Athens, Greece
2Warwick Business School, University of Warwick, Coventry, UK
Email: athanassopoulos.andreas@gmail.com
Received October 22, 2011; revised November 25, 2011; accepted December 10, 2011
Keywords: Data Envelopment Analysis; Cross-Efficiency; Super-Efficiency; Absolute Ranking; Linear Programming
ABSTRACT
This paper concentrates on methods for comparing activity units found relatively efficient by data envelopment analysis (DEA). The use of the basic DEA models does not provide direct information regarding the performance of such units. The paper provides a systematic framework of alternative ways for ranking DEA-efficient units. The framework contains criteria derived as by-products of the basic DEA models and also criteria derived from complementary DEA analysis that needs to be carried out. The proposed framework is applied to rank a set of relatively efficient restaurants on the basis of their market efficiency.
1. Introduction
The development of tools for assessing the performance of for-profit and not-for-profit activity units has seen considerable expansion in recent years. The assessment of the relative efficiency of activity units such as retail outlets, bank branches, hospital units, schools and local authorities is a major concern for the central and local management of the corresponding organisations. Farrell’s [1] ideas have been used as the basis for developing nonparametric methodologies for assessing the relative efficiency of activity units. This development was operationalised by [2,3] from the operational research point of view and [4] from the economic point of view. A phenomenal expansion followed the original development of the method see [5] while the recent developments of the method can be found in [6].
Data envelopment analysis and its evolution is based on the concept of relative efficiency which implies that in the absence of absolute standards of efficiency the best alternative is to use as basis of assessment the best observed decision making units (DMUs). These observed DMUs and their linear combinations are used to construct empirical efficient cost or production frontiers which can be used to assess relative efficiency. The efficient frontier is used to assess the efficiency of relatively inefficient units whilst no information is provided regarding the performance of relatively efficient DMUs.
The question of discriminating between relatively efficient units gained progressive popularity partly due to the lack of any direct information obtained by the typical DEA models and partly due to the increasing use of DEA as a benchmarking tool. A number of methods can be found in the literature that provide information regarding the performance of relatively efficient DMUs. However, there has been no systematic attempt to assess the effectiveness and pitfalls of these criteria. The main motivation of this paper, therefore, is the question of offering some insights on the performance of relatively efficient DMUs.
The rest of the paper is organised as follows. The next section reviews different types of criteria that have been proposed for investigating the performance of relatively efficient DMUs. The third section discusses the ranking of relatively efficient DMUs based on information obtained from the basic DEA model. The fourth section discusses complementary models for ranking efficient DMUs with their advantages and pitfalls. Results obtained from a set of restaurants are used in the fifth section in order to illustrate the criteria of ranking efficient DMUs. The sixth section concludes the paper.
2. Ranking DEA-Efficient Activity Units
The assessment of the efficiency of a set of DMUs gives no direct insights regarding the performance of relatively efficient DMUs. The graphical illustration in Figure 1 of a two dimension DEA analysis can be used to illustrate
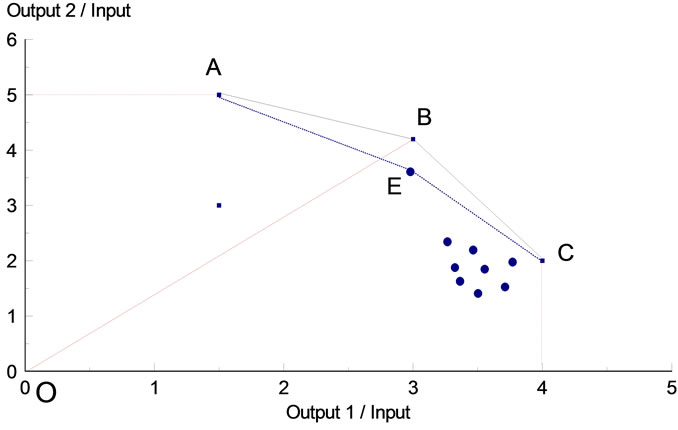
Figure 1. Revised frontier for ranking relatively efficient DMUs.
the discussion.
Figure 1 contains a set of DMUs that use two outputs per unit of input with DMUs A, B and C defining an empirical efficient frontier. The use of DEA does not provide any information, other than an efficiency index of one, for the three efficient DMUs A, B and C. However, simple observation shows that the three efficient units play a different role in the assessment of efficiency. For example, the very high concentration of inefficient units close to the efficient units B and C indicate that these two units will be used more frequently as efficient comparators. Moreover, the contribution of DMU C to the targets assessed for the inefficient units seems to be pre-dominated. This type of information can be obtained as a byproduct of the efficiency assessment of the inefficient units using the customary DEA models [2].
Efficient DMUs may be investigated further by focusing on their “position” relative to the efficient frontier in their absence. This is an issue that has been addressed in the literature by [7-10] that suggest ways for ranking relatively efficient units by removing them from the comparison set and then re-assess their efficiency. These absolute ranking indices are often referred in the literature as “super-efficiency” indices since efficient DMUs can get efficiency ratings that exceed 100%.
To find the “super-efficiency” of, say, DMU B one needs to compare its efficiency against a revised efficient frontier that does not include the particular DMU. This frontier is thus made of units AEC and the efficiency of DMU B is given by the ratio OB/OE which yields the proportionate excess in the performance of DMU B in comparison with the revised frontier AEC. It must be noticed that the development of the revised efficient frontier gives the opportunity to previously inefficient DMUs like E to become efficient. If such a development is not desirable then the revised frontier would by the segment AC.
The motivation for obtaining this modified measure of “efficiency” varies across the literature. For example in [8] these measures are used in order to be able to use the non-truncated efficiency scores in a regression analysis phase that sought to explain the assessed efficiencies. In [10] these indices are used as a measure of how “unusual” is the performance of efficient DMUs. Finally, the use of the revised efficiency index for ranking DMUs on a common scale is advocated in [9].
An alternative method has been proposed by [11-13], which calculates the cross-efficiency indices for obtaining absolute rankings of DMUs. These cross-efficiency measures are obtained by direct comparison of each DMU against all DMUs within the sample set and not only those that would be used by DEA as its comparator set. Therefore, a set of n × n efficiency indices are developed, where n is the number of DMUs included in the assessment. The technical details of these coefficients are discussed in more detail in the next section of the paper.
The methods capable of ranking relatively efficient DMUs can be classified into two broad categories as is shown in Table 1. This classification includes methods illustrated earlier using Figure 1 and also methods that require development of revised DEA models.
The three criteria of the post-DEA analysis are byproducts from the solution to the original DEA model [3]. The remaining three criteria require further modelling and analysis in order to rank relatively efficient DMUs.
The use of the criteria will be discussed in more detail next using the mathematical formulation of the basic DEA model. Let us consider a set of  DMUs which use quantities xij of inputs
  and produce quantities yrj of outputs
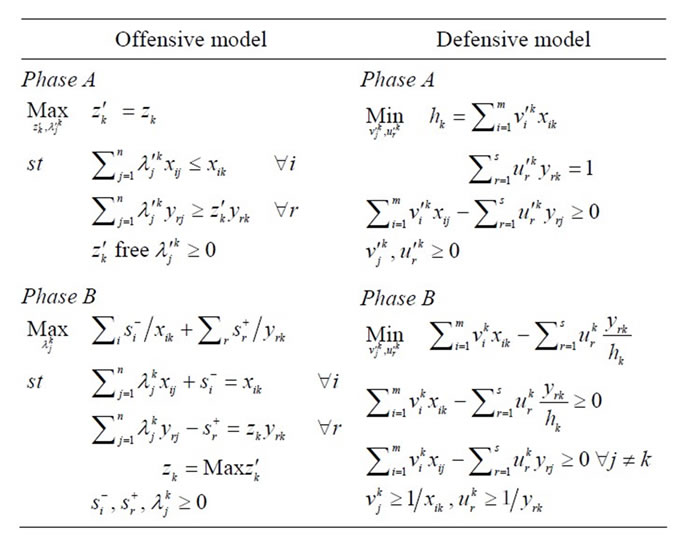
 . The relative efficiency of DMU k can be obtained using the linear programming models in (1).
Data Envelopment Analysis models(1)
The model in (1) represents an instance of the sequence of linear programmes that need to be solved for
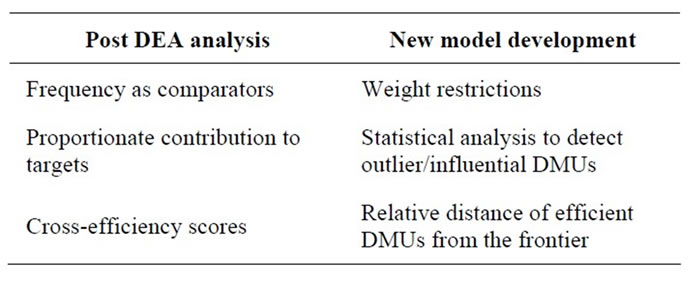
Table 1. Criteria for ranking efficient units.
assessing the efficiency of DMUs . The assessment of efficiency of individual DMUs is pursued in a two phase process. In the first phase we estimate a radial expansion factor
 . The second phase treats the objective function of the previous phase as a constraint and seeks to derive extra gains that can be realised for individual inputs and outputs. The two phase process is an alternative to the classic way of putting the radial component with the slack variables in the same objective function. The efficiency values become dependent on the magnitude of the scaling factor chosen to reduce the impact of the slack variables in the objective function that includes both components [14].
The efficiency of DMU k expressed in a percentage form can be obtained as . The names used for the two formulations are used to facilitate their managerial interpretation by focusing on the role of the relative efficient DMUs in DEA. The term “offensive” is used to indicate the primary objective of relative efficient DMUs to develop linear combinations of comparators with the corresponding assessed DMUs. On the other hand, the term “defensive” seeks to indicate the primary role of the efficient DMUs in this formulation which seek to defend their efficiency rating using the weights “selected” by the corresponding assessed DMU k.
2.1. Post-DEA Criteria for Relatively Efficient DMUs
The criteria of the post-DEA analysis can be applied utilising the solution of the DEA models for assessing the efficiency of individual DMUs. Efficient DMUs can be ranked as follows.
1) Frequency of use as comparator 
 = Frequency {
 }where
  is the optimal scale factor of DMU j when the efficiency of DMU k is assessed.
2) Proportionate contribution to targets An efficient DMU j contributes an amount of  to the target of output r of DMU k where
  is the optimal value of the intensity variable of the efficient DMU k when DMU j is assessed. The aggregate proportionate contribution
  of DMU j to the targets of output r of DMUs
  is given in (2).
 (2)
(2)
Similar formula can be used to obtain the proportionate contribution of the efficient DMU j to the input targets , assessed for DMUs
 .
.
3) Cross-efficiency scores The use of DEA to assess the performance of individual DMUs is based on the solution of a series of linear programming problems. The solution to these problems yields a set of weights for the inputs and outputs of each DMU. The utilisation of these weights, by developing payoff tables, which estimate the efficiency of individual DMUs derived from the optimal weights selected by other DMUs has been proposed [11-13]. The size of this payoff table is a n × n matrix and therefore the information can be summarised by averaging out the efficiencies across rows and columns of the payoff matrix. These efficiencies are listed in (3).
Summarising Cross-efficiency scores(3)

 represents the efficiency of DMU j when assessed using the weights (
 ) of all other DMUs
 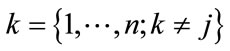 . The other efficiency,
  , represents the average efficiency that all DMUs
  get when the weights (
 ) of DMU j are applied. The two average statistics can be used to obtain a measure of strength for individual efficient DMUs. That is
  shows the effect of all DMUs on DMU j whilst
 , shows the effect of DMU j on all other DMUs.
The cross efficiency scores can be utilised even further by defining the extent to which there is variation between the peer-appraisal and the self-appraisal efficiency of DMUs. This measure of concordance between the two efficiencies is called “Maverick” index [13] and it is defined in (4).
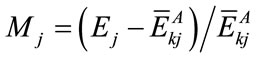 (4)
(4)
where Ej is the efficiency of DMU j obtained from the ordinary DEA model in (5) and  represents the average efficiency of DMU j when compared with all other units
 . The higher is the score of Mj the of a maverick is the assessed DMU j.
The use of cross-efficiency indices has two main shortcomings. First, the likely event that efficient DMUs have multiple optimal sets of weights imply that the cross efficiency scores will depend on the particular set of weights selected by the analyst. Methods for selecting sets of weights with particular properties are being suggested [13,14]. The second limitation, not reported in the literature before, is that the cross-efficiency scores cannot be obtained under the assumption of variable returns to scale as the cross-efficiency scores can even take negative efficiency values. This is due to the scale signfree variable that is necessary in the formulation of the variable returns to scale model.
2.2. New Model Development for Ranking Relatively Efficient DMUs
A number of models with specific purpose to rank relatively efficient DMUs can be found in the literature. For instance [15], suggested the use of value judgments as a means of ranking relatively efficient DMUs. In their research [15] a customised DEA model was proposed which yields an absolute ranking coefficient for each assessed DMU. The implementation of weights restrictions, however, requires knowledge of preferences over the relative importance of the inputs and outputs included in the assessment. The particular type of method is not pursued any further in this paper since it relies on the use of decision maker value judgments which were not obtainable in our empirical application.
Work inspired from the multivariate data analysis literature has also been suggested [16-18] for detecting the effect of outlier and influential observations on the efficiency results obtained by DEA. This research path, despite its importance, seeks to diagnose the reliability of the input-output information of individual efficient DMUs by means of assessing their impact on the technical efficiency of individual DMUs. This angle is not pursued any further since the present study concentrates on the estimation of absolute ranking coefficients.
The analysis focuses mainly on the so-called “superefficiency” models that have been proposed for ranking efficient DMUs on a scale without upper bounds of 100%, [19-22]. The modified efficiency indices for, say DMU k, can be obtained using the model in (5).
Super-efficiency models(5)
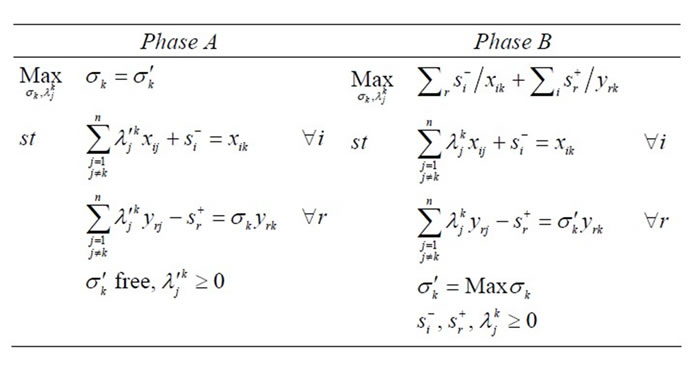
The notation of the model in (5) is similar to the one used in model (1). The two-phase process was employed to investigate the impact of the slack variables ( ) after the estimation of the radial component
 . The following comments can be made regarding the solution obtained by (5):
• The efficiency value  of DMU k can take values greater than unity in the case that DMU k was relatively efficient under the basic DEA model in (1).
• The efficiency value obtained in (5) for DEA efficient units have been proposed in the literature as a measure of “strength” of the corresponding units. It is argued, however, that the solution in (5) should be subject to more rigorous treatment, and in any case the use of the efficient figure Ek is not a representative measure of the “strength” of individual units. The criteria of dominance listed in (6) indicate the difficulty to use the coefficient  as a measure of “super-efficiency” of corresponding efficient DMUs.
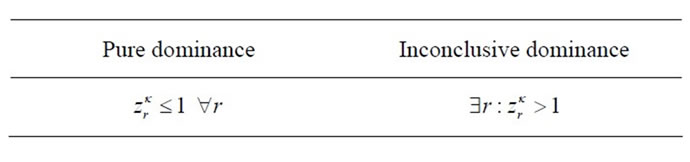
Criteria of dominance (output maximisation)(6)

The criteria in (6) show that the assessment of the efficiency of DMU k using the model in (5) show that a value of  is not a sufficient criterion of dominance. The criterion of pure dominance requires that the composite DMU
 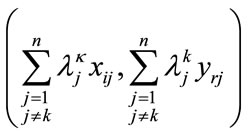 is dominated by the assessed DMU k in all input and output dimensions. If the composite DMU dominates any input or output of the assessed DMU k the solution of (5) cannot be used to deduce conclusive evidence regarding the optimal value sk since there is no clear-cut Pareto dominance of DMU k over the composite DMU and vice versa.
Consider a numerical example with three DMU that use quantities of three inputs to generate quantities of two outputs listed in Table 2.
Assessment of the relative efficiency of the three DMUs using DEA found all three DMUs as relatively efficient. The next step would be to obtain measures of absolute ranking for each DMU using model (5). For DMU 3, for example, the solution of model (5) gives , which implies that DMU 3 generates

Table 2. Input-output data used in the numerical example.
106% more output that the composite DMU of model (5). A closer investigation on the targets obtained from (5), however, gives the information listed in Table 3.
Interpretation of the information listed in Table 3 indicates that the objective function value in (5) does not convey full information of the true comparison between the assessed DMU 3 and its composite DMU ( ,
, ). Furthermore, using the criteria of dominance from (6) it can be seen that the comparison between DMU 3 and its peer is inconclusive since the peer DMU dominates DMU 3 in one input and one output dimension.
The simple numerical example that was used to illustrate the possible results obtained from model (5) casts doubts on the use of the objective function coefficient  unless it is complemented with the set of dominance criteria given in (6). The use of the complementary criteria in (6), on the other hand, will lead into cases of inconclusive dominance most of the relatively efficient DMUs.
The revised model in (7) is next proposed which seeks to alleviate some of the limitations of the earlier formulation of model (5). That is, for an output expansion case, the model satisfies the requirements of the dominance criteria regarding the input side and concentrates solely on the maximisation of outputs. The reverse argument holds for a case of input contraction.
A non-radial DEA model for assessing relative dominance(7)
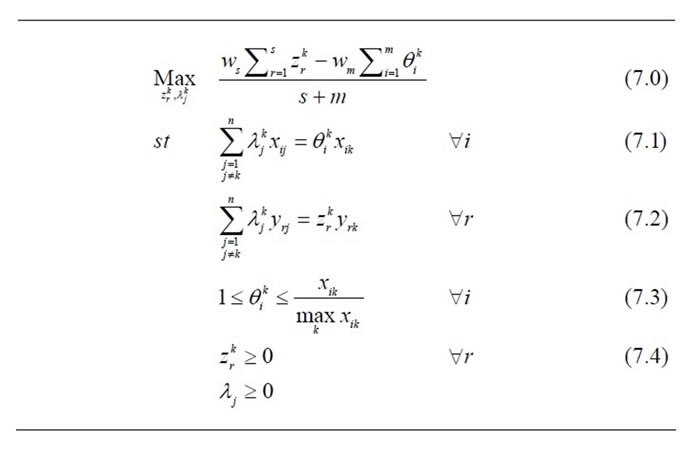
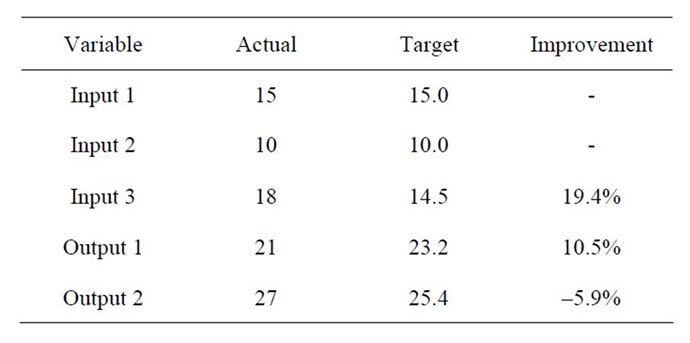
Table 3. Targets obtained from super efficiency model for DMU 3.
Where ws and wm are weights attached to all outputs (s) and all inputs (m) respectively with the relation  which indicates that the objective function in (7) gives pre-emptive priority to minimise the input requirements.
Model (7) belongs to the family of non-radial DEA models since it includes a separate improvement factor for each input ( ) and output (
 ). As distinct issues, however, one needs to mention the lack of predetermined direction for the rate of improvement of the outputs (
 ) since the optimal value of the corresponding variable (s) will determine the characterisation of dominance for the assessed DMU k. For the input side, on the other hand, the restriction (7.3) ensures that the rate of improvement (if any) will not reach levels beyond which will make the production of output infeasible. This constraint was necessary due to flexibility that has been given to the direction of improvement given to the outputs of the assessment (
 ).
).
The rationale of the proposed modification is based on the assumption that an assessed DMU k should dominate the “composite DMU” in (7) in all input and output dimensions if it were to be considered as super-efficient. Therefore, the formulation in (7) guarantees no reduction to the levels of the inputs and seeks to estimate output improvement (see 7.0). The obvious idea to fix the coefficient of improvement for individual inputs  is not proposed since it would not give feasible solution to the model in (7). Instead the objective function of (7) includes a two-phase optimisation where in the first phase the minimisation of inputs is pursued and then in the second phase it follows the maximisation of outputs. The proposed formulation is a combination of the constraints (7.3) which ensure that the composite DMU will use more or the same resource, and that this increase will not exceed the maximum observed value across all the DMUs for each input variable.
The outputs in (7) are sought to be maximised without, however, imposing any restrictions on whether the coefficients of improvement  will be less or greater than unity (see 7.4). The solution to (7) can be used to revise the earlier criteria of dominance to the ones listed below as follows.
The non-parametric model in (7) seeks to derive absolute ranking indices in an output expansion case. The indices are obtained after an assumption is made that the composite efficient DMU will be dominated by the assessed DMU k in all input dimensions (i.e. ). Having fixed the input dimensions the emphasis is then given on the expansion factors of the outputs (
 ). If these factors take optimal values
  for all outputs
  then the assessed DMU k dominates the composite DMU in all input and output dimensions. Potential values of
  greater than unity for some outputs indicates cases of inconclusive dominance between the assessed and the composite DMU. The results, however, can be used to estimate amounts of certain outputs that need to be sacrificed in order to increase amounts of some other outputs. Furthermore, a summary measure,
 ![]() , of this dominance can be obtained regarding the average rate of “super-efficiency” across all outputs.
, of this dominance can be obtained regarding the average rate of “super-efficiency” across all outputs.
3. Empirical Results from Retail Outlets
The post-DEA criteria were applied on a set of data used in a previous application [19]. Data from a set of 32 restaurants were used to disentangle different aspects of the market efficiency of the individual outlets. The inputoutput model used for assessing market efficiency comprised a set of six inputs and two outputs. As outputs were taken the revenue from sales of food (y1) and revenue from sales of alcohol (y2). The input set included the size of the bar area (x1) the number of covers used for food services (x2), the concentration of establishments offering similar services within 0.5 mile radius (x3), the number of competing establishments in 2 minus 0.5 miles radius (x4), the number of potential customers (social classes A and B of age category from 25 to 45 years old (x5)) and the average income per household in the surrounding area (x6).
In [19], DEA models are being used with alternative economic assumptions in order to assess the efficiency of retail outlets in accord with the different levels of management within the organisation. In the current study only the market efficiency model is employed which concentrates on the overall market efficiency of retail outlets. This assessment is based on the assumption of constant returns to scale and it is suitable for estimating the scores of efficient DMUs on the ranking criteria of the previous section.
The assessment of the efficiency of the 32 restaurants using the input-output set above characterised 19 of them as relatively efficient. The question of discriminating among the relatively efficient DMUs was eminent and thus the criteria for deriving absolute ranking coefficients were employed and their results are listed in Table 4.
 Is the average efficiency of DMU j assessed by DMUs
 ;
;
 Is the average efficiency of DMU j as comparator of DMUs
 ;
;
 Is the maverick index score of DMU j;
 Frequency as comparator;
 Contribution of DMU j to aggregate targets of food turnover (%);
 Contribution of DMU j to aggregate targets of drinking turnover (%);
 Super efficiency index of DMU j obtained from model (5);
 Is the average dominance index of DMU j;
F, D Efficient DMU dominated by composite in Food and Drink turnover respectively.
The eight ranking criteria listed in Table 4 are classified into three types, namely cross-efficiencies, target contributions and super efficiencies. The DMUs are listed according to the Maverick index score estimated in (4). In the cross-efficiency scores the DMUs with the smaller Maverick scores also have high efficiency scores ( ) when assessed by their peers. On the other hand, the same DMUs tend to give very low efficiency scores (
 ) to the remaining DMUs when used as their comparators.
DMUs with high scores on the cross-efficiency indices have also satisfactory performance on the target contribution criteria. It is noteworthy, however, that the criteria of this set yield a more variable ranking of the DMUs as, for example, Rest 18 which was given a very poor efficiency rating under the cross-efficiency criteria was used frequently as a comparator and also have contributed to the targets of inefficient DMUs. On the target contribution criteria there is some variation regarding the proportionate contribution of efficient DMU to the targets of individual outputs. For instance, Rest 4 has a 4.3% contribution to the overall targets of turnover from sales of food whilst on the other hand it has 9.8% contribution to the corresponding targets of turnover from the sales of drinks.
The super-efficiency scores are obtained from the solution to the modified DEA models in (5) and (7) respectively. The so-called super-efficiency (SEj) obtained from the solution to (5) gave scores in the range 111% to 282%. The scores attached with the D or F superscript represent cases where the composite DMU dominates the assessed DMU and thus there is no conclusive dominance on the output side. Furthermore, all assessed DMUs where dominated in at least one input dimension from the composite DMUs which does not let SEj to

Table 4. Criteria on the performance of relative efficient restaurants (denoted with j).
comply with the dominance criteria in (6). The results obtained from the revised model yield an index of average dominance  of each DMU. This index takes values in the range 51% to 129% which are systematically different from the corresponding values obtained from the super-efficiency scores SEj.
The performance of individual criteria regarding the ranking of efficient DMUs can be qualified further using the Spearman rank correlation coefficients in Table 5.
The three scores of the target contributions of individual DMUs are highly correlated which shows the degree of congruence between the three indices. The crossefficiency scores, on the other hand, do not seem to rank efficient DMUs on a similar scale. The correlation coefficients have the expected signs. For example, the Maverick indices convey information about the degree of dissimilarity of individual efficient DMUs from the rest of the DMUs. The negative association between  and Mj shows that the higher is the efficiency attached to DMU j using the weights chosen by all other DMUs
  the less dissimilar is DMU j from these DMUs.
The two super-efficiency indices have a weak positive association since the basis of their assessment is different. Looking at their rank correlation with the remaining criteria we can see that the average dominance score obtained from model (7) yields similar ranks to those obtained from the target contribution and the  crossefficiency indices. The corresponding association regarding the super-efficiency score obtained from (6) is much weaker. These results show that the revised average dominance measure conveys information which is more compatible with the information obtained from other benchmarking criteria. This in relation with the difficulties of the dominance criteria listed in (6) cast doubts about the usefulness of the super-efficiency scores obtained in (5).
Summarising, the eight criteria used in Table 4 provide complementary information regarding the performance of relatively efficient DMUs. It is argued that the
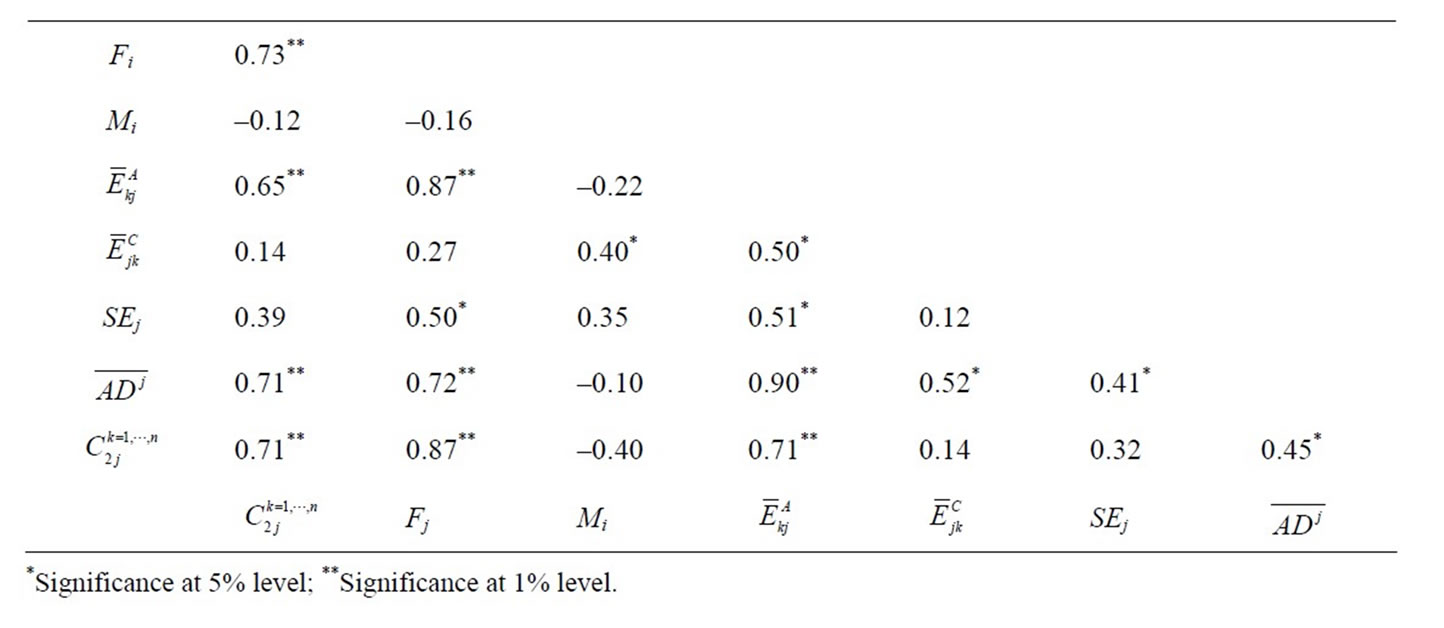
Table 5. Spearman rank correlation of ranking criteria.
use of the super-efficiency index scores in (5) do not provide ranks compatible with the ranking criteria of the target contributions and cross-efficiency indices.
4. Conclusions
The development of data envelopment analysis as a method for assessing the relative efficiency of decision making units is based on the estimation of empirical efficient frontiers. A variety of methods have flourished since the development of DEA [2] regarding the performance of relatively inefficient DMUs. Only limited progress can be reported regarding the performance of DMUs that define the efficient frontier and thus they are relatively efficient.
In this paper we compared methods for their suitability to provide information about the performance of DEA efficient DMUs. Two major families of these methods were considered, notably those that are based on the results obtained from the basic DEA model and those that require further modelling and analysis.
The paper has shown that the most prominent of these criteria, namely the super-efficiency scores yield inconclusive evidence regarding the dominant character of the performance of individual DMUs. A revised DEA model was proposed that alleviates the problems of the previous index by resolving the problems of dominance of the assessed DMUs. The ranking criteria were applied on a set of restaurants in the UK employing a DEA model with two output and six input variables. The results of the analysis confirm the claims of the paper regarding the problematic nature of the super-efficiency indices. Moreover, the results have shown the complementary character of the information obtained by the independent criteria for ranking efficient DMUs.
Despite the statistical similarities of the ranks obtained from some of these criteria the scale of ranking is independent among the various criteria and thus their results retain their autonomy. The empirical results conclude that there are no methods at present to yield a universally agreed rank among relatively efficient DMUs. On the other hand, the results have shown that a combined use of these criteria can be used to obtain a set of relatively efficient DMUs that excel in most criteria and thus can be selected as the exemplary performers of organisations. As the importance of benchmarking as a process of managing organisations is growing it is anticipated that the demand for methodologies that would aid management to identify exemplary operating practices will increase. Data envelopment analysis can be used to support the development of successful benchmarking strategies taking into account the need to improve continuously the criteria of selecting these benchmarks.
REFERENCES
- M. Farell, “The Measurement of Productive Efficiency,” Journal of Royal Statistical Society A, Vol. 120, Part III, 1957, pp. 253-281. doi:10.2307/2343100
- A. Charnes, W. Cooper and E. Rhodes, “Measuring the Efficiency of Decision Making Units,” European Journal of Operational Research, Vol. 2, No. 6, 1978, pp. 429- 444. doi:10.1016/0377-2217(78)90138-8
- R. Banker, Charnes and W. Cooper, “Some Models for Estimating Technical and Scale Inefficiencies in Data Envelopment Analysis,” Management Science, Vol. 30, No. 9, 1984, pp. 1078-1092. doi:10.1287/mnsc.30.9.1078
- R. Fare, S. Grosskopf and K. Lovell, “The Measurement of Efficiency of Production,” Kluwer-Nijhoff Publishing, Boston, 1985.
- L. Seiford, “A Bibliography of Data Envelopment Analysis (1978-1995). Technical Report,” In: A. Charnes, W. Cooper, A. Lewin and L. Seiford, Eds., Data Envelopment Analysis: Theory, Method and Process, IC2 Management and Management Science Series, Quorum Books, New York, 1995.
- H. Fried, K. Lovell and S. Schmidt, “The Measurement of Productive Efficiency: Techniques and Applications,” Oxford University Press, New York, 1993.
- D. Adolphson, G. Cornia and L. Walters, “A Unified Framework for Classifying DEA Models,” In: H. Bradley, Ed., Operational Research’90, Pergamon Press, New York, 1990.
- K. Lovell, L. Walters and L. Wood, “Stratified Models of Education Production Using DEA and Regression Analysis,” In: A. Charnes, W. Cooper, A. Lewin and L. Seiford, Eds., Data Envelopment Analysis: Theory, Method and Process, IC2 Management and Management Science Series, Quorum Books, New York, 1995.
- P. Andersen and N. Petersen, “A Procedure for Ranking Efficient Units in Data Envelopment Analysis,” Management Science, Vol. 39, No. 10, 1994, pp. 1261-1264. doi:10.1287/mnsc.39.10.1261
- A. Athanassopoulos and J. Ballantine, “Ratio and Frontier Analysis for Assessing Corporate Performance: Evidence from the Grocery Industry in the UK,” Journal of the Operational Research Society, Vol. 46, No. 4, 1995, pp. 427-440.
- T. Sexton, R. Silkman and A. Hogan, “Data Envelopment Analysis: Critique and Extensions,” New Directions for Program Evaluation, Vol. 1986, No. 32, 1986, pp. 73- 105.
- J. Doyle and R. Green, “Efficiency and Cross-Efficiency in DEA,” Journal of Operational Research Society, Vol. 45, No. 4, 1994, pp. 567-578. doi:10.1057/jors.1994.84
- J. Doyle and R. Green, “Cross-Evaluation in DEA: Improving Discrimination among DMUs,” Infor, Vol. 32, No. 2, 1994, pp. 1-18.
- A. Ali and L. Seiford, “Computational Accuracy and Infinitecimals in Data Envelopment Analysis,” Infor, Vol. 31, No. 4, 1993, pp. 290-297.
- W. Cook, M. Kress and L. Seiford, “Prioritisation Models for Frontier Decision Making Units in DEA,” European Journal of Operational Research, Vol. 59, No. 2, 1992, pp. 319-323. doi:10.1016/0377-2217(92)90148-3
- B. Seaver and K. Triantis, “The Implications of Using Messy Data to Estimate Production-Frontier-Based Technical Efficiency Measures,” Journal of Business and Economic Statistics, Vol. 7, No. 1, 1989, pp. 49-59. doi:10.2307/1391837
- B. Seaver and K. Triantis, “The Impact of Outlier and Leverage Points for Technical Efficiency Measurement Using High Breakdown Procedures,” Management Science, Vol. 41, No. 6, 1995, pp. 937-956. doi:10.1287/mnsc.41.6.937
- P. Wilson, “Detecting Outliers in Deterministic Nonparametric Frontier Models with Multiple Outputs,” Journal of Business and Economic Statistics, Vol. 11, No. 3, 1993, pp. 319-323. doi:10.2307/1391956
- Y. Chen, “Ranking Efficient Units in DEA,” Omega, Vol. 32, No. 3, pp. 213-219. doi:10.1016/j.omega.2003.11.001
- L. Shanling, G. Jahanshahloo and M. Khodabakhshi, “A Super-Efficiency Model for Ranking Efficient Units in Data Envelopment Analysis,” European Journal of Operational Research, Vol. 184, No. 2, 2007, pp. 638-648.
- J. Zhu, “Robustness of the Efficient DMUs in Data Envelopment Analysis,” European Journal of Operational Research, Vol. 90, No. 3, 1996, pp. 451-460. doi:10.1016/0377-2217(95)00054-2
- P. Bogetoft and J. L. Hougaard, “Super Efficiency Evaluations Based on Potential Slack,” European Journal of Operational Research, Vol. 152, No. 1, 2004, pp. 14- 21. doi:10.1016/S0377-2217(02)00642-2