New Journal of Glass and Ceramics
Vol.07 No.03(2017), Article ID:77368,9 pages
10.4236/njgc.2017.73005
DC Electrical Conductivity Studies of GeO2 Doped Lead Vanadate Glass System
P. Tejeswararao1*, D. L. Sastry2
1Department of Physics, GITAM Institute of Science and Technology, GITAM University, Visakhapatnam, India
2Department of Physics, Andhra University, Visakhapatnam, India

Copyright © 2017 by authors and Scientific Research Publishing Inc.
This work is licensed under the Creative Commons Attribution International License (CC BY 4.0).
http://creativecommons.org/licenses/by/4.0/


Received: May 5, 2017; Accepted: June 30, 2017; Published: July 3, 2017
ABSTRACT
Temperature dependent DC electrical conductivity studies of GeO2 substituted lead vanadate glass systems xGeO2(50−x)PbO:50V2O5 (x = 5, 10, 15 mole%) were carried out and the results are reported. X-ray diffraction results reveal that all samples are perfect amorphous in nature. DSC results indicate that the substituent GeO2 is replacing PbO in the glass network in such a way that the eutectic composition is maintained. DC electrical conductivity studies of the glass samples indicate that the systems are characterized by different activation energies in different temperature ranges which in turn depend on the annealing temperature. These results are interpreted in terms of temperature dependent microstructural changes in these glass systems.
Keywords:
XRD, DSC, DC Conductivity, Semiconducting Glasses

1. Introduction
In view of their potential applications, research on amorphous semi-conductors in thin film or bulk form has been receiving increased attention [1] [2] . Semi- conducting oxide glasses like lead vanadate form an important class of the amorphous semiconductors and are being studied in great detail [3] [4] . In addition to their applications, basic understanding of the physical properties of these materials is of a great fundamental importance [5] [6] in research on these materials. Considering the enormous variation in their composition, the scope for research on these materials is also very wide. Recent studies in this laboratory have indicated that lead metavanadate glass systems exhibit interesting changes in their physical properties depending on the substitution of different metal oxides in the place of lead oxide [7] [8] . In the conventional silicate based glasses, electrical conduction takes place due to ionic transport. In semi-conducting glasses the electrical conduction is due to the transport of electrons. These vanadate glasses are known to contain V4+ and V5+ ions and conduction is attributed to hopping of a 3d1 electron from V4+ to V5+ site. Among vanadate glasses, PbO:V2O5 has received greater attention because of its wider glass-forming region in the phase diagram. The present paper, the results obtained in the dc electrical conductivity and differential scanning calorimetry (DSC) measurements carried out on lead vanadate glass system in which PbO was systematically substituted by GeO2 are discussed. Although vanadium based glasses have been studied extensively, most of the reports in literature are found on the binary glass systems like GeO2-V2O5 [9] and GeO2-PbO [10] but so far no investigation has been reported on the GeO2-PbO-V2O5 glass system. The results are expected to be interesting since GeO2 is also a glass former.
2. Experimental
A series of glass samples with the molar formula xGeO2(50−x)PbO:50V2O5 (x = 5, 10, 15 in molar ratio) were prepared. Appropriate amounts of reagent grade GeO2, PbO and V2O5 were well mixed and melted in silica crucibles using an electrical furnace at a temperature ranging between 950˚C - 1000˚C range, depending on the glass composition. The melt was stirred frequently to ensure the homogeneity molten compound. The melts were quenched on a large stainless steel block maintained at room temperature (≈30˚C) and constituting of 9 mm cylindrical cavities to get circular disc shaped samples of 2 to 3 mm width. The glass samples were annealed at 150˚C below the glass transition temperature for nearly 2 hours. The samples were washed with an acetone and dried. The glasses were stored in desiccators until required.
In the present studies, XRD recordings of the powdered glass samples were recorded with the help of a PAN Alytic X’Pert-PRO diffractrometer using Cu Kα radiation at 1.5418 Ǻ and diffractrometer settings in the 2θ range from 10˚C - 70˚C by changing the 2θ with a step size of 0.02˚. The density (D) was determined at room temperature using Archimedes principle. The samples were weighed using an electrical balance (Dhona Model 200D) of 0.0001 gm accuracy. The weight loss was measured in an acetone (Aldrich) of 99.5% Purity and density 0.789 gm/cm3. The molar volume (Vm) was calculated using the formula given below
 (1)
(1)
Here Mi is the molecular mass for component i and ni is molar ratio and D is density of the sample.
In the present studies, DuPont, USA make model 2000 thermal analyzer was used to determine the glass transformation temperature (Tg), crystallization temperature (Tc) and melting temperature (Tm). DSC scans were conducted using 5 - 10 mg ground as-cast glass specimens which are heated with heating rate of 10˚C/min between 0˚C and 600˚C in a platinum crucible. Alumina powder was used as the reference material. The DC electrical conductivity studies were carried out by using a two probe technique. A homemade muffle furnace using a super kanthal wire as a heating element was used for temperature variation studies in the range 300 K - 500 K. Temperatures of the furnace as well as the sample are monitored by using a Cr-Al thermocouples. The resistance of the samples was measured using a Keithaly (Model 614) digital electrometer. The conductivity was calculated from knowledge of the geometry of the sample using the expression.
 (2)
(2)
where RX is the resistance, t is the thickness and A is the area of the sample.
3. Results and Discussion
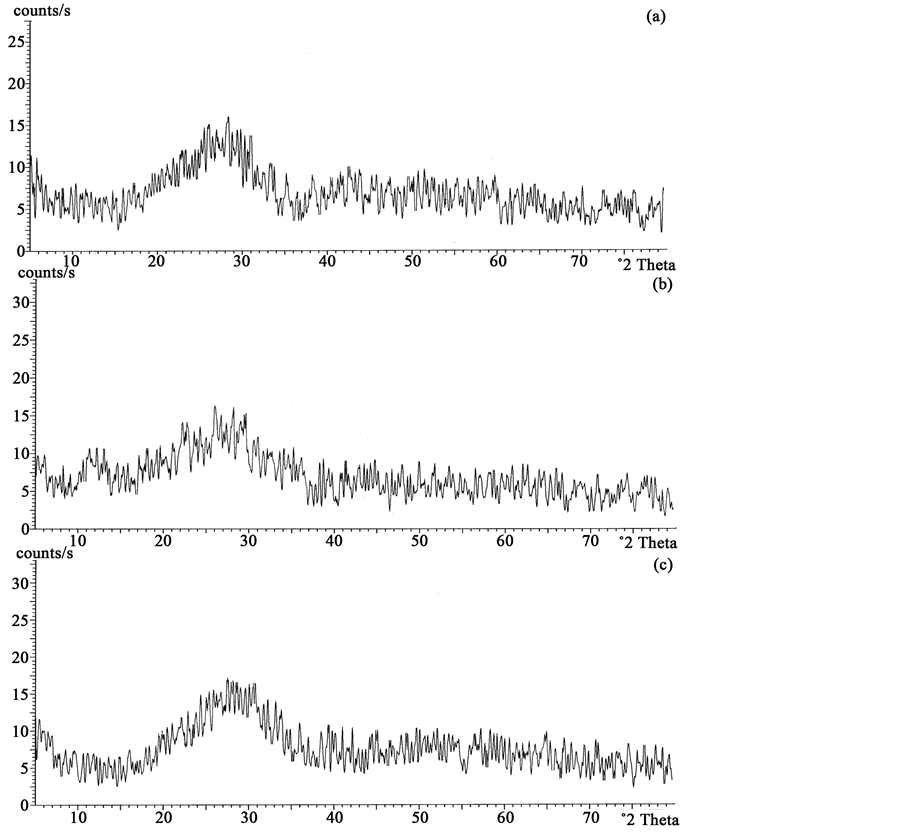
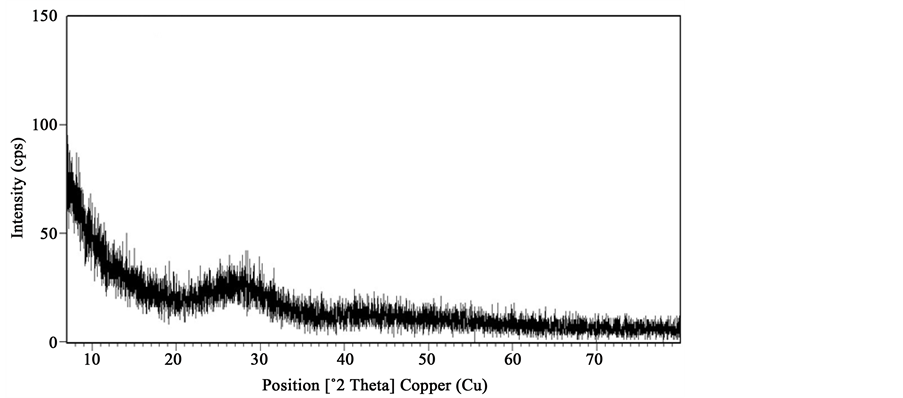
The X-ray diffractograms of samples annealed at 150˚C show no trace of crystallinity and are given in Figure 1(A). The annealing of the samples up to 225˚C did not induce any change in the diffractograms showing that the samples remained amorphous as shown in Figure 1(B) for the case of the sample containing x = 15 mole% of GeO2. Baiochi et al. [11] and Calestani et al. [12] identified metastable phases in the 1:1 molar system. These metastable phases are a modification of the lead metavanadate (PbV2O6) or lead pyrometavanadte (PbV2O7). All the metastable phases convert to stable lead metavanadate before eutectic melting. DSC recordings of the GeO2-PbO-V2O5 glass systems are shown in Figure 2. These are different when compared to those of the unsubstituted system [13] . Values of glass transition temperature Tg, crystallization temperature Tc, melting temperature Tm, and glass forming tendency Kg obtained from the DSC recordings are given in Table 1. There is a slight change in the Tg along with an increase in the number of crystallization peaks, the Tg values decrease with increasing GeO2 contents, these results suggest that GeO2 acts as a network modifier where as PbO acts as a network former. Crystallization temperature Tc is the maximum of the crystallization peak and onset of crystallization temperature, Tx is the temperature at the beginning of the first exothermic reaction where the crystallization starts.
As seen in Figure 2, up to x = 15 mole% there is only one endothermic peak corresponding to the melting point. This indicates that the substituted samples behave like the eutectic composition up to x = 15 mole%, the endothermic peak corresponding to melting exhibits a small shoulder when the amount of GeO2 substitution exceeds 15 mole%. DSC patterns showed a splitting of the melting point peak (not included in the present studies) which indicates the probability of new phases being formed when the samples contain GeO2 higher than 15 mole%. It can be seen from Figure 2 that there is an increase in the number of peaks corresponding to Tc which is an indication of an increase in the number of metastable phases being formed which finally transforms to a single stable phase. In order to understand the devitrification tendency and thermal stability of the glasses, glass forming tendency values Kg are calculated using the equation given below [14] .
 (A)
(A)
 (B)
(B)
Figure 1. (A) X-ray diffractograms of xGeO2(50−x)PbO:50V2O5 glass system annealed at 150˚C. (a) x = 5 mole% (b) x = 10 mole% (c) x = 15 mole%; (B) X-ray diffractograms of 15GeO235PbO:50V2O5 glass system annealed at 225˚C.
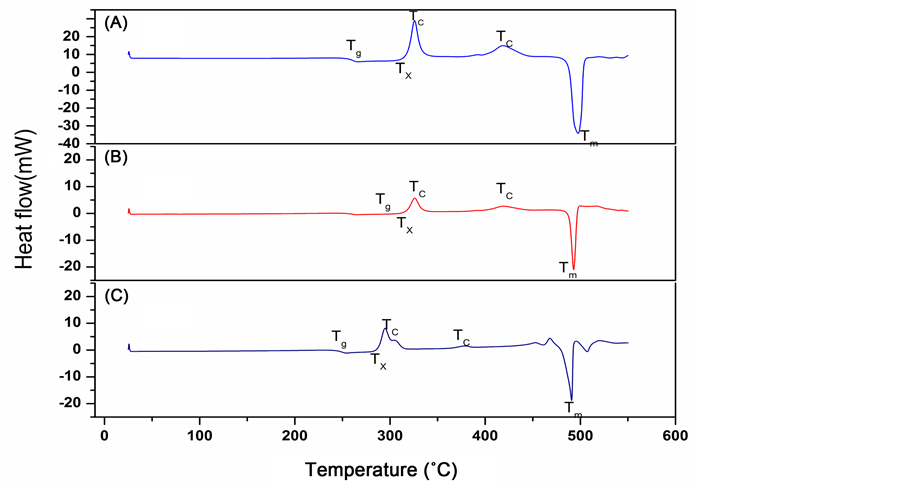
Figure 2. Differential scanning calorimetry curves of xGeO2(50−x)PbO:50V2O5 glass system. (A) x = 5 mole% (B) x = 10 mole% (C) x = 15 mole%.
 (3)
(3)
These values are tabulated in Table 1. Lower Kg value suggests higher tendency of crystallization and lower thermal stability. Kg represents the temperature interval during nucleation [15] . From Table 1, it can be seen that that the 15GeO235PbO:50V2O5 glasses, with a Kg value of 0.123, have the lowest thermal stability among all the four compositions. The densities and molar volumes of xGeO2(50−x)PbO:50V2O5 (x = 5, 10 and 15 mole %) samples determined in the present studies are given in Table 1. The densities seem to decrease with an increase in GeO2 substitution.
The temperature dependence of logarithmic conductivity of the samples annealed at 150˚C is shown in Figure 3. It can be seen that the temperature dependent conductivity of the 50PbO:50V2O5 sample shows Arrhenius variation, where as GeO2 doped samples indicate slight departure from Arrhenius type of variation. The log10𝜎 vs 1/T plot approaches straight line behaviour as GeO2 concentration is increased from 5 mole% to 15 mole%. The activation energies were calculated for two temperature ranges, for which the log10𝜎 Vs 1/T variation is almost a straight line being characterized by single activation energy. The two temperature ranges chosen were (i) 300 K - 350 K (ii) 350 K - 500 K. The activation energies calculated in the respective temperature ranges are given in Table 2. In the higher temperature region i.e., temperature range 350 K - 500 K, the activation energies for GeO2 doped samples are less than the activation energy of undoped 50PbO:50V2O5 glass sample.
In the lower temperature region i.e., in the temperature range 300 K - 350 K the activation energies of 5 mole% and 10 mole% GeO2 substituted samples are
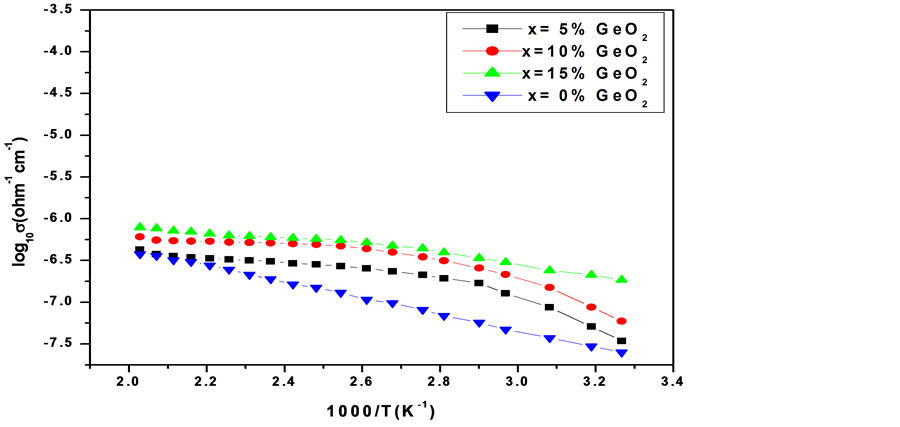
Figure 3. Temperature dependence of logarithmic conductivity of xGeO2(50−x)PbO: 50V2O5 glass system annealed at 150˚C.

Table 1. Values of glass transition temperature (Tg), crystallization temperature (Tc), melting temperature (Tm), glass forming tendency (Kg), Density (D) and molar volume (Vm) for the xGeO2(1−x)PbO:50V2O5.
Table 2. Activation energies obtained at different temperature regions by fitting Mott’s model for GeO2 substituted lead Vanadate glasses.
more than that of the unsubstituted 50PbO:50V2O5 glass sample. As the concentration of GeO2 substitution is increased to 15 mole% the activation energy decreases becoming less than that of the unsubstituted sample. Even though there is no marked increase in conductivity when compared to that of the unsubstituted sample, the decrease in the activation energy for the GeO2 substituted samples in the temperature range 350 K - 500 K indicates that the participation of GeO2 in the glass network assists polaron hopping by decreasing the energy barrier between polaron hopping sites. To understand if the conductivity of the samples is influenced by the annealing temperature, the samples were annealed at 225˚C, a temperature which was below the glass transition temperature and conductivity measurements were carried out. The log10𝜎 vs 1/T plots in this case are shown in Figure 4. It can be seen from Figure 4 the conductivities of all the samples increased in the temperature range of study.
The undoped 50PbO:50V2O5 sample still indicated Arrhenius behavior in its conductivity plot, being characterized by activation energy of 0.143 eV which is slightly smaller than the 0.175 eV of the sample annealed at 150˚C. However GeO2 substituted samples indicated a temperature dependence of conductivity which can be divided into three regions with temperature ranges (i) 300 K - 340 K (ii) 350 K - 420 K (iii) 420 - 500 K. The activation energies obtained in the ranges (i) and (iii) are closer to the activation energy of the undoped samples whereas in the region characterized by temperature range (ii), the activation energies of GeO2 substituted samples are higher. All the GeO2 doped samples are characterized by higher conductivities and lower activation energies when compared to those of the undoped 50PbO:50V2O5 sample. The present results also indicate that GeO2 substitution for PbO in the amorphous xGeO2(50−x)PbO: 50V2O5 samples affects the glass network differently at different annealing temperatures. At a given annealing temperature the GeO2 substituted samples exhibit different activation energies in different temperature ranges indicating that GeO2 participation in the glass network affects the Polaron hopping energy differently in different temperature ranges. As the annealing temperature is increased there may be a change in the value of C i.e. Concentration of V4+ ions (C = No. of V4+ ions/total no. of vanadium ions).
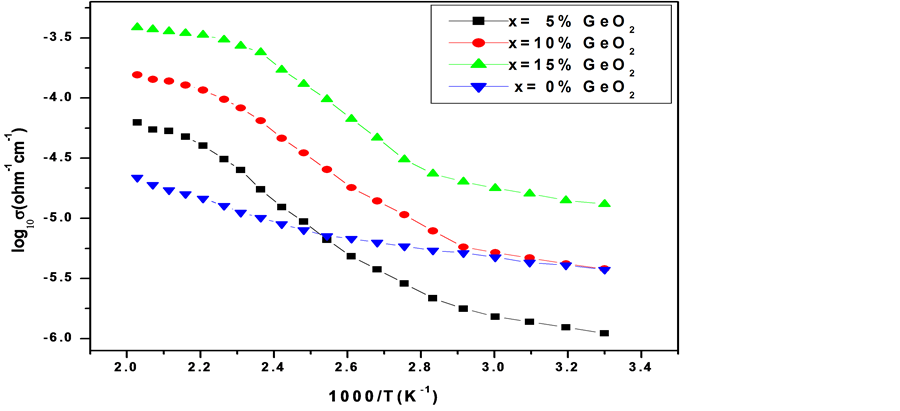
Figure 4. Temperature dependence of logarithmic conductivity of xGeO2(50−x)PbO: 50V2O5 glass system annealed at 225˚C.
4. Conclusion
Perfect vitrification has been achieved for all the glass samples as can be seen from the X-ray diffractograms of the as prepared samples after annealing at 150˚C or 225˚C for two hours. DSC recordings show that eutectic composition of the lead meta vanadate has been maintained for all the glass systems upto 15 mole% of substitution. Only in the case of 15 mole% GeO2 substituted samples there is a tendency for deviation from eutectic melting as is evidenced by the appearance of a small shoulder above the peak corresponding to eutectic melting in its DSC thermogram. The DSC data also indicate that all the GeO2 substituted glass systems are characterized by more than one crystallization peak. This can be thought that of as an evidence for the existence of more than one meta stable phase in the glass systems. The dopant GeO2 is not divalent oxides like PbO. Besides GeO2 is known to be glass former unlike PbO which is considered to be a glass modifier. In spite of these differences, the present observations indicate that the substituent is replacing PbO in the glass network in such way that the eutectic composition is maintained and the final devitrified system has a crystal structure that is similar to that of lead meta vanadate. The temperature dependent DC electrical conductivity studies of the glass samples annealed at 150˚C indicate that the GeO2 substituted glass samples are characterized by slightly different activation energies in different temperature regions. When these systems were annealed at a higher temperature of 225˚C the temperature dependent DC electrical conductivity studies revealed the existence of three different temperature regions characterized by different activation energies. These differences are attributed to not only a change in the value of C (Concentration of V4+) but also a change in the microstructure of the glass system.
Cite this paper
Tejeswararao, P. and Sastry, D.L. (2017) DC Electrical Conductivity Studies of GeO2 Doped Lead Van- adate Glass System. New Journal of Glass and Ceramics, 7, 49-57. https://doi.org/10.4236/njgc.2017.73005
References
- 1. Ghosh, A. (1988) Memory Switching in Bismuth-Vanadate Glasses. Journal of Applied Physics, 64, 2652-2655.
https://doi.org/10.1063/1.341605 - 2. Hirashima, H., Ide, M. and Yoshida, Ts. (1986) Memory switching of V2O5-TeO2 Glasses. Journal of Non-Crystalline Solids, 86, 327-335.
https://doi.org/10.1016/0022-3093(86)90021-9 - 3. Mustafa, Y.M., Mansour, E., El-Damrawi, G.M., Abd El-Maksoud, S. and Doweidar, H. (2001) Memory Switching of Fe2O3-BaO-V2O5 Glasses. Physica B, 305, 242-249
https://doi.org/10.1016/S0921-4526(01)00622-6 - 4. Sujatha, B. and Reddy, C.N. (2006) Electrical Switching Behaviour in Lead Phosphovanadate Glasses. Turkish Journal of Physics, 30, 189-195.
- 5. Szu, S. and Lu, S.G. (2007) AC Impedance Studies of Image Containing Glasses. Physica B, 391, 231-237.
https://doi.org/10.1016/j.physb.2006.09.025 - 6. Ghosh, A. and Sen, S. (1999) Structure and Other Physical Properties of Magnesium Vanadate Glasses. Journal of Non-Crystalline Solids, 258, 29-33.
https://doi.org/10.1016/S0022-3093(99)00562-1 - 7. Tejeswararao, P., Ramesh, K.V. and Sastry, D.L. (2012) Electrical and Spectroscopic Studies of the CdO Substituted Lead Vanadate Glass System vs Crystalline Form. New Journal of Glass and Ceramics, 2, 34-40.
- 8. Tejeswararao, P., Ramesh, K.V. and Sastry, D.L. (2016) ESR and DC Electrical Properties of Bi2O3-PbO-V2O5 Glass System. Physics and Chemistry of Glasses— European Journal of Glass Science and Technology Part B, 57, 279-284.
- 9. Khan, M.N., Khawaja, E.E., Save, D., Kutub, A.A. and Hogarth, C.A. (2007) Electrical Conductivity of Semiconducting V2O5-GeO2 Glasses. International Journal of Electronics, 56, 395-401.
- 10. Topping, J.A. (1974) Elastic Properties of Glasses in the System PbO-GeO2. Journal of the American Ceramic Society, 57, 455.
- 11. Baiocchi, E., Bettinelli, M., Motenero, A. and Disipio, A. (1982) New Phases in Equimolar PbO-V2O5 System. Journal of Solid State Chemistry, 43, 63.
https://doi.org/10.1016/0022-4596(82)90215-8 - 12. Calestani, G., Andreeti, G.D., Montenero, A. and Bettinelli, M. (1985) Structures of Metastable Lead Metavanadates: The Orthorhombic PbV2O6 (III) Modification. Acta Crystallographica Section C, C41, 179-182.
https://doi.org/10.1107/S0108270185003237 - 13. Ramesh, K.V. (2000) Thermal, Electrical and Spectroscopic Studies of CuO, ZnO and TiO2 Substituted for PbO in Eutectic Lead Vanadate Glass System. Ph.D. Thesis, Andhra University, Visakhapatnam.
- 14. Kozmidis-Petrovic, A.F. (2010) Theoretical Analysis of Relative Changes of the Hruby, Weinberg, and Lu-Liu Glass Stability Parameters with Application on Some Oxide and Chalcogenide Glasses. Themochimica Acta, 499, 54-60.
https://doi.org/10.1016/j.tca.2009.10.023 - 15. Murugan, G.S. and Ohishi, Y. (2004) TeO2-BaO-SrO-Nb2O5 Glasses: A New Glass System for Waveguide Devices Applications. Journal of Non-Crystalline Solids, 341, 86-92.
https://doi.org/10.1016/j.jnoncrysol.2004.04.006