Journal of Crystallization Process and Technology
Vol. 2 No. 2 (2012) , Article ID: 18639 , 13 pages DOI:10.4236/jcpt.2012.22006
Kinetics Estimation and Polymorphic Transformation Modeling of Buspirone Hydrochloride
![]()
Chemical and Biochemical Engineering Department, Faculty of Engineering, The University of Western Ontario, London, Canada.
Email: *rohani@eng.uwo.ca
Received August 30th, 2011; revised December 2nd, 2011; accepted February 1st, 2012
Keywords: Buspirone Hydrochloride; Polymorph Transformation; Raman Spectroscopy; Kinetics of Transformation
ABSTRACT
In this work, solvent-mediated polymorphic transformation of metastable Form II to stable Form I of Buspirone Hydrochloride (BUS-HCl) was studied. The polymorphic transformation was monitored using in-situ Raman spectroscopy. The solvent-mediated transformation process is governed by the dissolution of Form II and the nucleation and subsequent growth of Form I. The model parameters for each of these sub-processes were determined with the aid of experimental data including polymorphic fraction in solid phase, solute concentration, and the crystal size distribution. In order to estimate the kinetic parameters, independent seeded batch sets of experiments were conducted, first to estimate the growth rate of Form I, and consequently to estimate the secondary nucleation of Form I and dissolution rate of Form II. The experimental data showed that the secondary nucleation of Form I occurred slightly after the dissolution of Form II was initiated. The estimated parameters for growth, nucleation and dissolution rates were successfully implemented in the population model and validated with the experiments.
1. Introduction
Polymorphism is a common phenomenon in organic compounds and is of key importance in the pharmaceutical and fine-chemical industry as different polymorphs have different physical and chemical properties, such as solubility and bioavailability. Many crystalline compounds exhibit polymorphism, in which at a given temperature and pressure the material may exist in one of several metastable forms as well as a stable one [1,2]. The solid properties of polymorphs depend on the ability of molecules to arrange themselves in different states of order, ranging from closely packed molecular crystals with a minimum free energy to metastable crystal phases and, finally, to the glassy state with the highest Gibbs free energy. Polymorphs can either be monotropic where one form has a lower Gibbs free energy than the other form at all temperatures below the melting point or enantiotropic, whereby at a certain temperature, called the transition temperature, the Gibbs free energy of the two solids is equal. The transition temperature is the temperature at which the two forms have the same solubility and it is below polymorphs melting points. For enantiotropic polymorphs, the transition temperature is of great importance since it defines the temperature at which the stability relationship between the two forms becomes inverted. There are several methods currently available to experimentally determine or estimate this value.
To avoid production of undesired polymorphs and to obtain a robust crystallization process, knowing thermodynamic and kinetic relationships among the polymorphs and their physicochemical properties is of particular importance [3,4]. The kinetics of nucleation and growth of each polymorph determines which appears first and how long the transformation from the one, the metastable form, to the other, the stable form, takes. The overall kinetics involves simultaneous occurrence of complex phenomena, i.e., nucleation, growth, and dissolution of the involved solid-state forms. Although the kinetic estimation can be a nontrivial task, accurate kinetic information is very important for obtaining a reliable process model for polymorphic crystallization. Such model can accelerate process design, finding optimal operating conditions as well as development of suitable control strategy [5-7].
Monitoring the crystallization of polymorphs is very essential for getting insights into the kinetic relationships associated with the polymorphic transformation. Combination of using ATR FTIR and Raman spectroscopy proved to be the most powerful technique as they provide information about the solute concentration in liquid phase, and polymorphic composition of the precipitated solid phase throughout the crystallization process. ATRFTIR demonstrated to be a very useful tool in monitoring the solute concentration in liquid phase, and enabled many researchers to incorporate this information into both, open-loop optimization and closed-loop control purpose [8-11]. The solid composition of the crystals as a function of time can be obtained from the in-line Raman spectra, which provide valuable kinetic information on the phase transformation between different solid forms. For this reason, Raman spectroscopy has been widely applied within the pharmaceutical industry to provide information about the chemistry and solid-state composition of various systems, as well as for monitoring crystallization and solvent-mediated phase transformations [12- 17].
Buspirone hydrochloride is an anxiolytic drug. The buspirone effectiveness mechanism is not fully understood. It appears to act by modifying the release of a mixture of neurotransmitters in the brain. Neurotransmitters are chemicals that are stored in nerve cells and are involved in transmitting messages between the nerve cells. Buspirone hydrochloride is a white crystalline water-soluble compound with a chemical name of N-[4-[4-(2-Pyrimidinyl)-1-piperazinyl]butyl]-1,1-cyclopentan ediacetamide monohydrochloride. The polymorph screening on BUS-HCl showed that close to 90 percent was resulted in Form 1 with a melting point at 188˚C and Form 2 with a melting point at 203˚C. Studies showed that these two crystal structure are enantiotropes and the transformation temperature from Form 1 to Form 2 is 95˚C [18].
This article deals with estimation of kinetic parameters in a model for polymorphic crystallization, which will be used for the development of real-time model based control strategies in future studies. The population balance based crystallization model was developed to estimate the kinetics of solution mediated polymorphic transformation from metastable Form II to stable Form I of Buspirone Hydrochloride. A kinetic model of Buspirone Hydrocloride is developed from batch experiments with insitu measurements including ATR-FTIR spectroscopy to infer the solute concentration, and Raman spectroscopy to provide the composition of the solid phase. FBRM was used for monitoring the occurrence of the secondary nucleation events throughout the seeded batch experiments.
2. Materials and Methods
Buspirone freebase (BUS-base) was supplied by ApotexPharmaChem Inc. (Brantford, ON). Isopropanol (IPA) was purchased from Caledon (Georgetown, ON). Both polymorphs of Buspirone Hydrochloride were prepared following the method reported by Sheikhzadeh et al. 2007 [18].
2.1. Experimental Setup
All crystallization experiments were performed in a 250 mL jacketed glass vessel. A Neslab RTE digital plus 740 bath circulator (Portmouth, NH) was used for temperature control. A Teflon-coated thermocouple was used for reading the temperature in the flask. For mixing, a topmounted, two-bladed, flat electromagnetically driven stirrer was employed.
A Raman RXN Analyzer spectroscopy (Kaiser Optical Systems, Inc., Ann Arbor, MI, USA) was used to monitor the polymorphic fraction change of Buspirone Hydrochloride. An immersive Raman probe was inserted into the crystallizer from the top of the vessel. To avoid any influence of the outer light on the Raman spectrum, the crystallizer was optically isolated during the measurements. To measure the polymorphic fraction of Buspirone Hydrochloride polymorph quantitatively, a calibration curve was constructed using binary mixtures of the Form I and Form II and adding them to the saturated solution. It is important to note that Form I is stable below 95˚C. The polymorph mixtures were prepared by mixing nearly pure Form I and Form II samples, which were isolated by the method described below. An in-situ ATR-FTIR (Hamilton Sundstrand and DMD-270 diamond ATR immersion probe, San Diego, CA) was used for on-line measurement of the solute concentration in the solution. In order to estimate the solute concentration in liquid state, a calibration curve was developed prior to proceeding with the experiments for estimation of kinetic parameters. In this work, a Focused Beam Reflectance Measurement (FBRM) 400 D probe from Lasentec (Redmond, USA) was used to measure chord length distribution (CLD). The chord lengths acquired every 5 s were organized in 90 channels over the entire range between 1 and 1000 mm.
2.2. Characterization
X-ray Powder Diffraction (XRPD) measurements were used to validate the calibration curve for Raman spectroscopy in the first phase of experimental work, and later to confirm the polymorphic identity of the final product. The XRPD spectra were collected on a Rigaku-MiniFlex powder diffractometer, using CuKα (λ for Kα = 1.54059Å) radiation obtained at 30 kV and 15 mA. The scans were run from 3.0 to 90 2θ, increasing at a step size of 0.05 with a counting time of 1 s for each step.
A scanning electron microscopy (SEM) was used for morphological analysis (Hitachi S-4500, Tokyo, Japan). The samples were gold-sputtered.
3. Experimental Section
3.1. Preparation of Buspirone Hydrochloride Form I and Form II Polymorphs
Form II was produced by the reaction between Buspirone Base (BUS-Base) and HCl [19] After complete dissolution of BUS-Base in isopropanol at 45˚C - 50˚C, the pH of the solution was adjusted to the range of 3.4 - 3.6 by slow addition of (38%) aqueous hydrochloric acid. During the pH adjustment, temperature was kept at 45˚C - 50˚C. The solution was cooled to 20˚C - 25˚C at a cooling rate of 0.5˚C/min under nitrogen and kept at that temperature for 3 h. The product was filtered, washed with isopropanol, and dried at 30˚C - 35˚C under vacuum at 30˚C. The diffraction patterns of the final product were verified by XRPD analysis.
Form I was made by polymorphic transformation of Form 2. A suspension of Form II in isopropanol was heated to 40˚C - 42˚C and kept for 20 h. The suspension was cooled at a cooling rate of 0.5˚C/min to 24˚C and the solids collected on a filter, washed with isopropanol, and dried under vacuum at 30˚C. The polymorphic identity of the final product was confirmed by XRPD.
3.2. Raman Calibration Curve
At first, a clear solution with a saturation temperature of 42˚C for the Form II was prepared at 50˚C using 3.993 g of BUS-HCl and 100 g of IPA. Then the solution was cooled to 42˚C within 20 min and maintained at this temperature until the end of the experiment. At this temperature the solubility difference between the two forms was significantly large, and thus suitable for monitoring the polymorphic transformation. The solubility data as a function of temperature of two BUS-HCl polymorphic forms were determined previously [18]. The solubilities at 42˚C were measured and found to be 2.914 g/100g of IPA and 3.993 g/100g of solvent for Form I and Form II, respectively. A total of ten binary mixtures with a different polymorphic composition were prepared by mixing the nearly pure dry samples of two polymorphic forms. Samples of two forms were grinded and sieved to have the same crystal size distribution and a medium size of 325 mm. The dry mixtures of two polymorphic forms with total mass of 3 g were then added to 100 mL of saturated iso-propanol solution while mixing at 100 rpm. The Raman spectra were recorded and the height of two characteristic peaks, at 723 cm–1 for the Form I and at 1152 cm–1 for the Form II, was used for the construction of the calibration curve. After the Raman spectra were taken, a 10 mL sample was pipette out, dried under vacuum oven and used for X-ray analysis. A previously developed X-ray quantification method by Sheikhzadeh et al. (2006) was employed for determining the polymorphic content of the samples taken during the experiments. The X-ray analysis was used to ensure that the polymorphic transformation did not occur at the time of taking the spectra, and to validate the constructed calibration curve. The Raman calibration curve showed the linearity between peak intensity and polymorph concentration.
3.3. Dissolution Experiments
This set of experiments was performed at 42˚C with the 200g of solution saturated with respect to Form I. Then, 5 g of Form II sieved with the narrow particle size distribution (median 50 μm), was added to the solution. Concentration of solute was continuously measured by ATR FTIR in order to estimate the kinetic of dissolution of Form II.
3.4. Seeded Desupersaturation Experiments
Several batch crystallization experiments seeded with Form I were carried out to estimate the growth kinetics of Form I. Similarly as for the construction of Raman calibration curve, a clear solution with a saturation temperature of 42˚C for the Form II was prepared using 3.993 g of BUS-HCl and 100 g of IPA. This solution was supersaturated with respect to Form I, and at the saturation point with respect to Form II. Therefore, the addition of Form I seeds would result in the growth of Form I seeds. The solution was stirred and the seeds were added only after FBRM data showed nil value. The temperature was maintained at 42˚C for several hours. In each experiment the seeds of Form I polymorph were added to a saturated solution of BUS-HCl in 100 g of IPA. The desupersaturation of the solution was monitored using ATR-FTIR spectroscopy. FBRM was employed only to verify that no significant nucleation occurred during desupersaturation experiments. This would in fact be evident by a sudden increase in the number of small chord lengths, i.e., 1 - 10 μm, which was never observed in the experiments performed in this study.
3.5. Seeded Transformation Experiments
This set of experiments was performed in order to estimate the polymorphic transformation rate of Form II to Form I. The saturated solution at BUS-HCl in IPA at 42˚C was prepared in the same way as in the previous experiments. The changes in polymorphic fraction of Form I was measured using Raman spectroscopy. Typical cycle time of the measurement was 5 min. The exposure time for both the background and the spectrum was 1 min. The cycle was repeated continuously until the completion of the transformation.
4. Mathematical Description of the Polymorphic Transformation
4.1. Dynamics of Seeded Batch Crystallizer
The crystallization driving force is supersaturation, Si, and it can be defined as follows with respect to the ith polymorph.
 (i = I & II)(1)
with C is the solute concentration and C* is the solubility of polymorph i. A mathematical framework for modeling crystallization processes is the population balance, which describes the state of the crystal size distribution (CSD). Major equations describing isothermal batch crystallization dynamics include population, energy, solute, and solvent balances. The population balance for a seeded batch crystallizer in which crystals are born at size zero, particle growth is size independent, crystal agglomeration and breakage are neglected, and crystal shape is uniform can be represented [20]:
 (i = I & II)(2)
where t is the time, r is the crystal size, ni is the number density of particles and Gi is the growth rate of the corresponding polymorph. Agglomeration and attrition effects can be neglected since the supersaturation is relatively low. Mixing effects are assumed to be negligible.
The other important equation is mass balance. The concentration of the solute can be estimated through the material balance and is given by following equation:
 (3)
(3)
 (4)
(4)
where r is the solid density, kv is the shape factor and m2 is the second moment of the CSD. The densities of both polymorphs were assumed to be the same and equal to 1100 kg/m3. Volume shapes factors of 0.1 and 0.2 were assumed for the Form I and Form II polymorph, respecttively.
The following initial and boundary conditions are used for the population balance. It is important to mention that initial condition is based on seeded experimentation.
 (i = I & II)(5)
 (i = I & II)(6)
where Bi is the nucleation rate of the corresponding polymorphic form, and ni,0(r) represents the initial particle size distribution (PSD) of polymorph i.
The initial condition for the material balance is as follows:
 (7)
(7)
where C0 is the initial concentration of the solute in IPA.
The crystal size distribution of the seeds was assumed to have a parabolic shape given [21]:
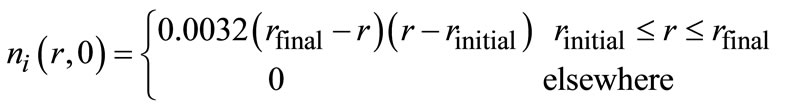 (8)
(8)
The above model equations were solved using the finite difference method in Matlab programming language.
4.2. Crystallization Kinetics
The ability to measure in-situ solid-state polymorph concentration, solute concentration in solution and crystal chord length distribution has improved the crystallization kinetic estimation techniques. The combination of crystallization modeling with optimization routines enables prediction of process parameters characterizing the involved phenomena. In this study, the in-situ experimental data combined with parameter estimation algorithms were used to calculate the nucleation and growth kinetics of stable polymorph of Buspirone Hydrochloride as well as transformation rate of meta-stable to stable polymorph.
1) Growth Parameter estimation of Form I The growth of Form I particles was studied through Form I seeded experimentation in the absence of Form II seeds. The created supersaturation can be used either to grow the existing Form I seeds or nucleate new Form I and II nuclei. The following equation was applied for growth of Form I [22]:
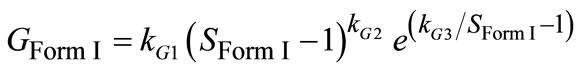 (9)
(9)
where G is the growth rate and kG1-3 are growth kinetic parameters which have to be estimated. In Equation (9), supersaturation is the key parameter for growth of particles that can be measured from FTIR data. Also, the solution of material balance (which is coupled with the population balance) gives the solute concentration which can be easily converted to the supersaturation with respect to the stable polymorph. The difference between the experimental and the calculated supersaturation values can be utilized as an objective function for the nonlinear optimization problem in following form:
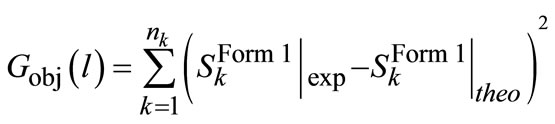 (10)
(10)
where nk is the data points throughout experiment, l and S are the Form I supersaturation value from experiments and theoretical modeling.
This optimization formulation is categorized under unconstrained nonlinear optimization. The Matlab® optimization toolbox and lsqnonlin algorithms was applied on Equation (10) to vary the nucleation kinetics until it satisfies the objective function. lsqnonlin appeared to be less sensitive to noise, fast and effective for the narrow parameter intervals. The estimated kinetic parameters, experimental and theoretical data and the Jacobian matrix were used to calculate the standard error, variance and covariance for each parameter. The parameters were estimated based on the 95% confidence interval.
2) Nucleation parameter estimation for Form I The magnitude of supersaturation affects the tendency of the crystallization process for either nucleation or growth. When supersaturation level is low, the Form I nucleates only in the presence of the Form II seeds. This has been confirmed by several experiments during which no nucleation occurred after long time in a clear solution that was slightly supersaturated with respect to Form I. The Form I supersaturation limit was observed to be below 1.4. Primary nucleation of Form I was not observed and therefore secondary nucleation (in presence of Form II seed) was the controlling factor. There are various types of secondary nucleation expression, however Mersmann (2001) proposed following lump correlation for it [22]:
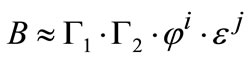 (11)
(11)
which G1 is a number of attrition parts formed by collisions, G2 is the survived particle numbers, and they are both functions of supersaturation, j is the volumetric crystal holdup, and e is the stirrer power number which can be correlated as follows:
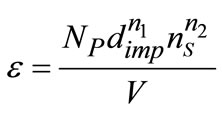 (12)
(12)
which NP is the characteristic number of stirrer, dimp is the impeller diameter, ns is the stirring rate, V is the crystallizer volume, n1 and n2 are the exponents which in literature was found to be 5 and 3, respectively.
During the polymorphic transformation, concentration remains constant corresponding to the solubility of Form II and therefore,
 (13)
(13)
Consequently, the study of the supersaturation effect on nucleation phenomena during polymorphic transformation is not possible. Therefore, secondary nucleation of Form I in the presence of Form II seeds is a function of crystallizer process characteristics (e) and the amount of Form II seeds. This can be expressed according to Equation (11) as follows:
 (14)
(14)
where, mForm II is the mass per volume of metastable polymorph (Form II) and kB1-3 are the parameters that should be estimated [23].
One approach to estimate the nucleation parameters is suggested by authors [11] by using FBRM data to measure the nucleation rate indirectly and find the parameters by minimization of the difference of experimental and theoretical nucleation. The second approach is based on Raman spectroscopy data. The optimization objective function was defined in terms of the minimization of difference in polymorph compositions in the solid phase between the experimental and theoretical data. The experimental solid composition was measured by Raman and simulation result was based on crystallization model solution. The objective function was expressed as follows:
 (15)
(15)
where, w is the solid composition values in terms of weight percentage for both experimental and theoretical (simulated) values. The experiments seeded with Form II were performed by monitoring the concentration in solution through ATR-FTIR and polymorphic change with Raman spectroscopy. The Matlab optimization toolbox and nonlinear least squares optimization algorithm built in lsqnonlin function was used for parameter estimation of the nucleation kinetics as well.
3) Dissolution rate of Form II In solution-mediated polymorphic transformation, throughout the transformation time, the dissolving of metastable polymorph (Form II) is the dominant phenomenon. As mentioned previously, the initial solute concentration was equal to metastable polymorph solubility. Therefore, the dissolution rate was the controlling factor for Form II seeded transformation crystallization. The measured solute concentration and known solubility of Form II were used to estimate the dissolution rate according to following Sherwood based equation [7]:
![]() (16)
(16)
where D is the dissolution rate and kD1,2 are the dissolution parameter which were obtained by applying least squares curve fitting in Matlab®. When the supersaturation of Form II polymorph was above that of Form I (solute concentration was more than Form II solubility), the growth rate was substituted by dissolution rate.
5. Results and Discussion
In this section, the results are divided into three sections in which we discuss the quantitative analysis of two polymorphs, and experimental and simulation results that lead to the estimation of parameters of dissolution rate of Form II, nucleation and growth rates of Form I, respecttively. As mentioned in the previous sections, all of the experiments were seeded with either Form I or Form II crystals of BUS-HCl, depending on the final objective with respect to the parameter estimation of specific crystallization phenomena. The seeds for each polymorph were sieved so that the initial crystal size distribution was approximately the same for all performed experiments.
5.1. Polymorphic Quantitative Analysis
As previously mentioned, the Raman peak at 723 cm–1 for the Form I and at 1152 cm–1 for Form II were found to be suitable for monitoring the polymorphic transformation of BUS-HCl. A typical trend in two characteristic peaks changes during the polymorphic transformation experiment is shown in Figure 1. As seen from Figure 1, the intensity of Form II characteristic peak starts decreasing approximately one hour after the seeds are added to the saturated solution, and Form I characteristic peak starts increasing approximately two hours after. Although this experiment was ran for 18 hours, it is notable that the polymorphic transformation is completed after approximately seven hours. This was also confirmed by the XRPD analysis. Figure 2 shows the XRPD spectra for two pure BUS-HCl forms, and the two characteristic peaks used for the quantification of polymorphic forms in the offline manner. In addition to the Raman and XRPD analysis, the morphology of two BUS-HCl polymorphic forms differs as well. Figure 3 depicts the SEM micrographs of Form I and II, and as seen from the pictures, the Form II crystals are rode shaped in comparison to plate shaped Form I crystals.
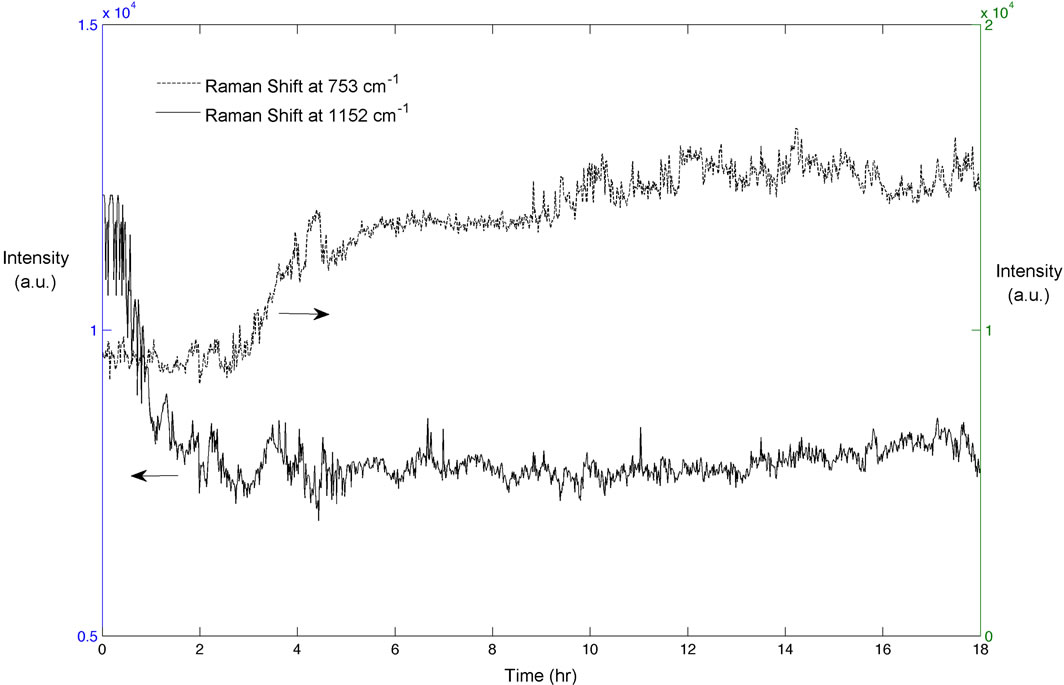
Figure 1. Trend in the height of two polymorph characteristic Raman peaks throughout the typical polymorphic transformation experiment.
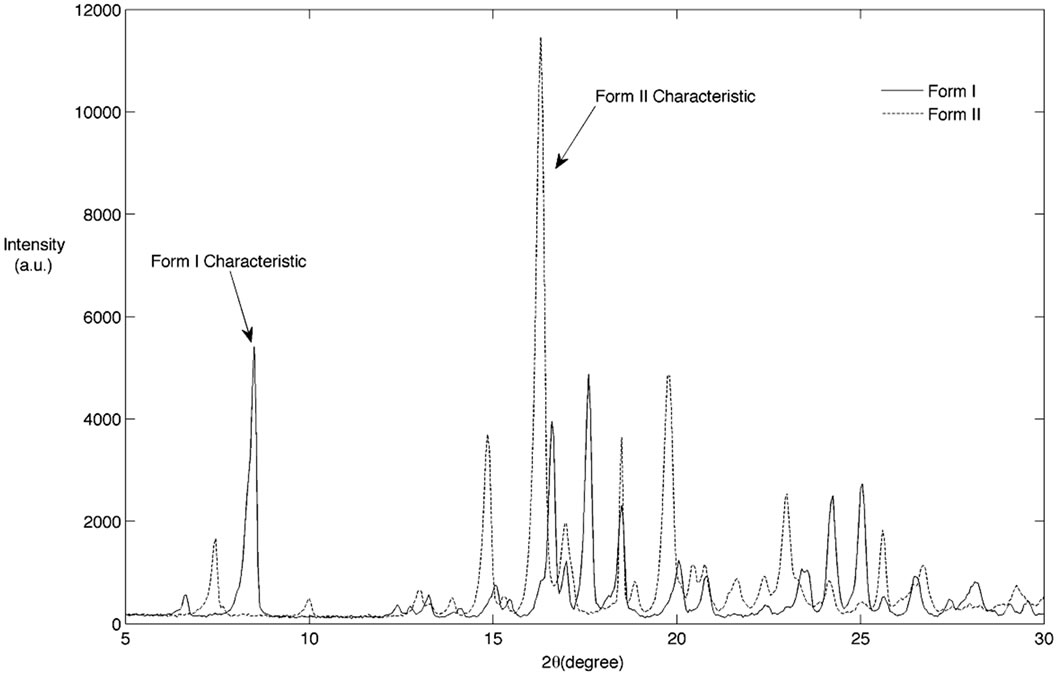
Figure 2. XRPD spectra for two polymorphic forms of BUS-HCl.
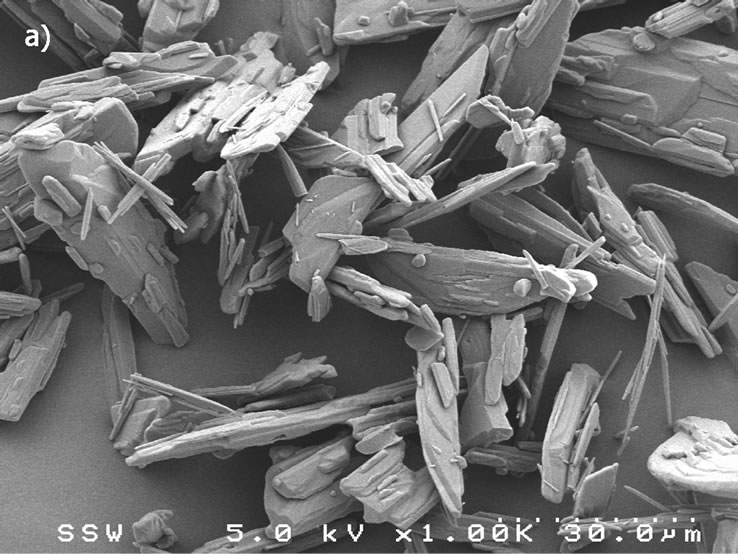
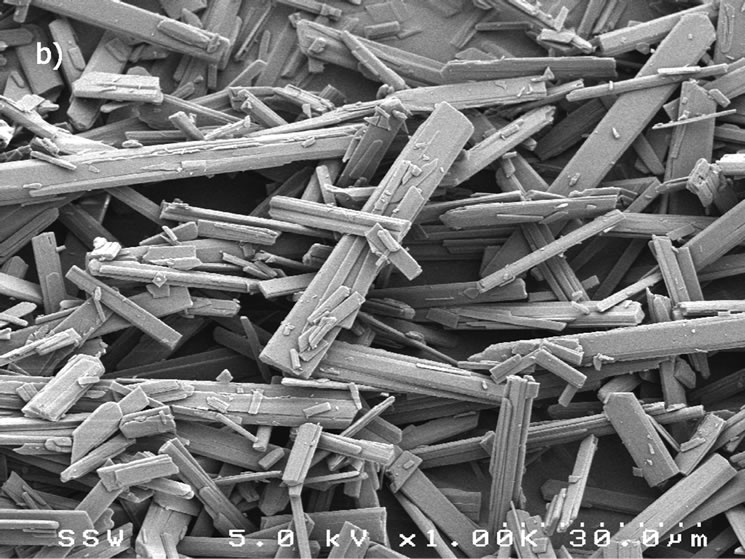
Figure 3. SEM pictures of polymorphic forms of Buspirone Hydrochloride (a) Form I (b) Form II.
5.2. Seeded Desupersaturation Experiments—Estimation of Growth Parameters for Form I
As explained in the previous section, this set of experiments were directed in such a way that after the addition of Form I seeds, the growth of these crystals was thermodynamically favorable. The event of nucleation would be detected by the sudden increase of particles in the small particle range channels in FBRM, as it detects the particle size and particle density. However, this was not observed for any of the performed experiments. The typical desupersaturation profile for this set of experiments in shown in Figure 4. For this set of experiments, we used the same mass of seed which was 2 g/100g of solution. As seen from Figure 4, the supersaturation is used for growth of Form I crystals relatively fast after the addition of seeds. This was expected considering that the solution was supersaturated with respect to Form I, and was favorable for the growth of seeded crystals. The corresponding growth rate of Form I for the desupersaturation profile shown in Figure 4 is depicted in Figure 5. As expected, the growth rate decreases with the decrease in the supersaturation level with respect to Form I in the solution. The modeled evolution of crystal size distribution for Form I is shown in Figure 6. The parameter estimation technique presented in Section 4.2 along with the population balance model and the experimental results of the seeded desupersaturation experiments was used in order to determine the growth rate of the Form I polymorph. The estimated kinetic parameters for the growth of Form I crystals are shown in Table 1.
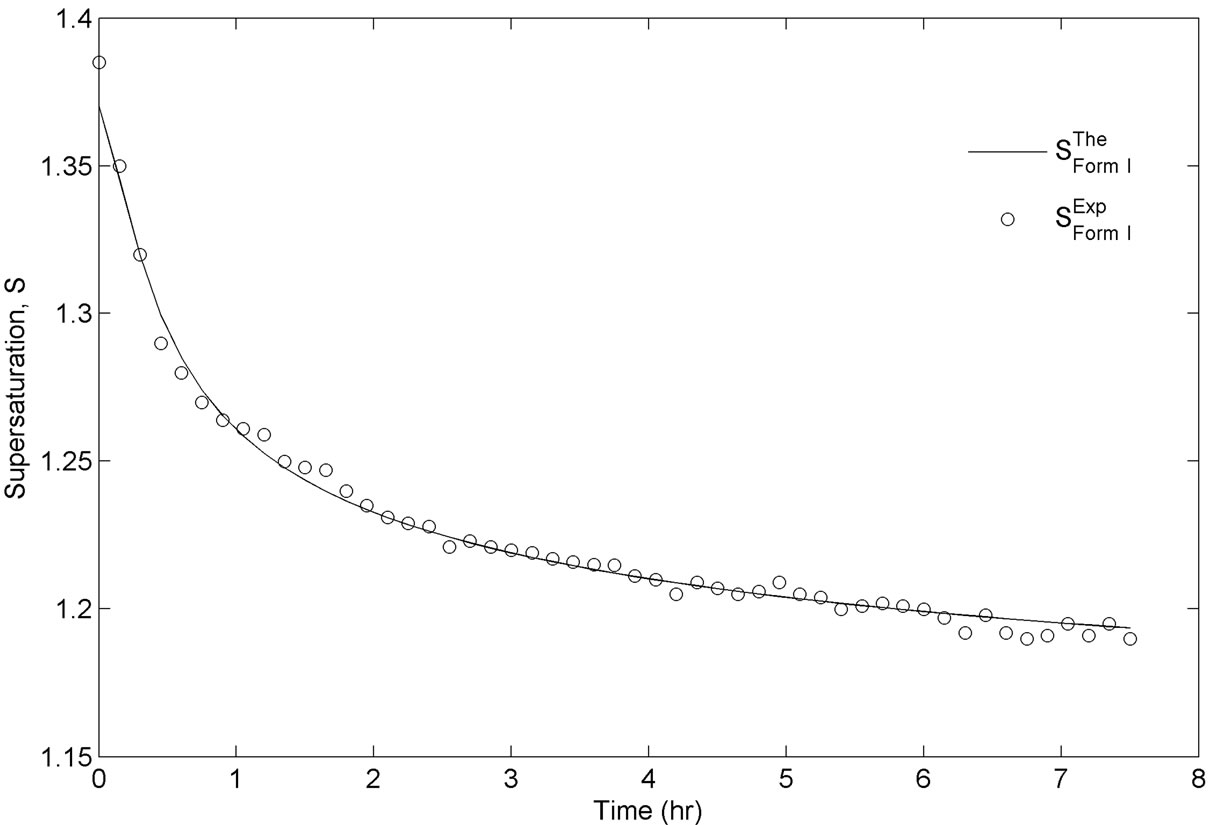
Figure 4. Experimental and simulated supersaturation profiles during the experimentation with Form I seed.
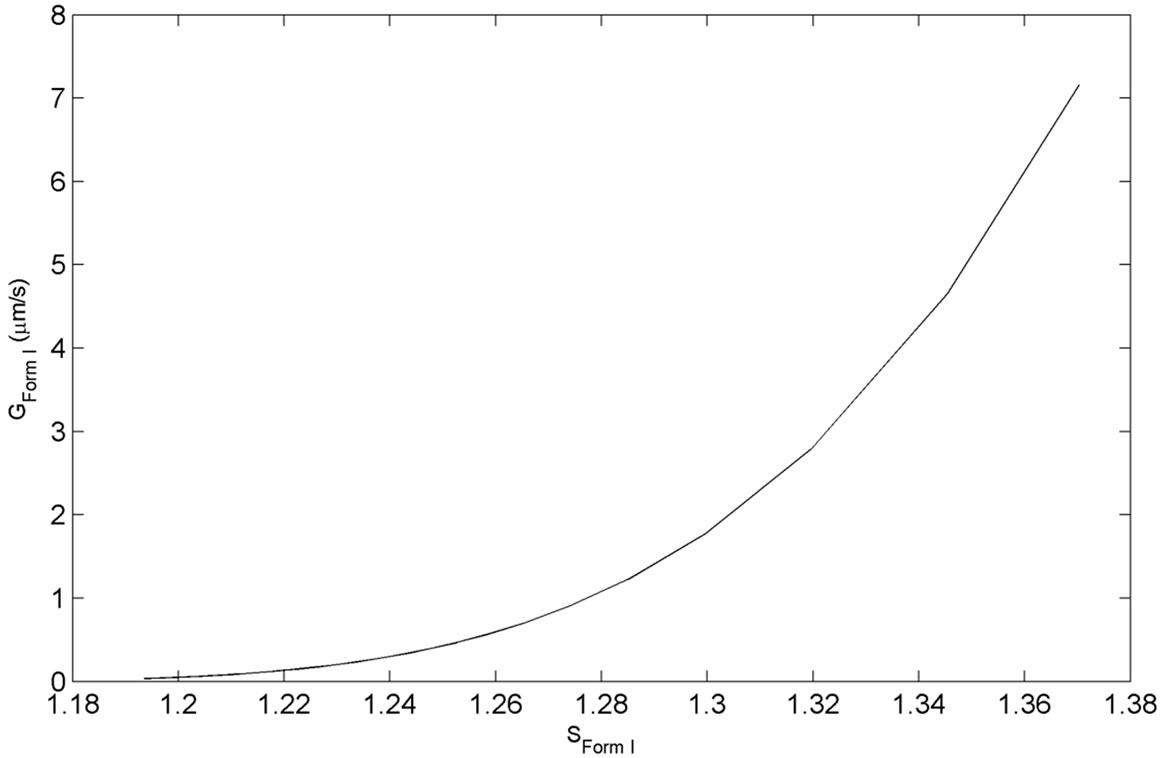
Figure 5. Experimental growth profile during the experimentation with Form I seed.
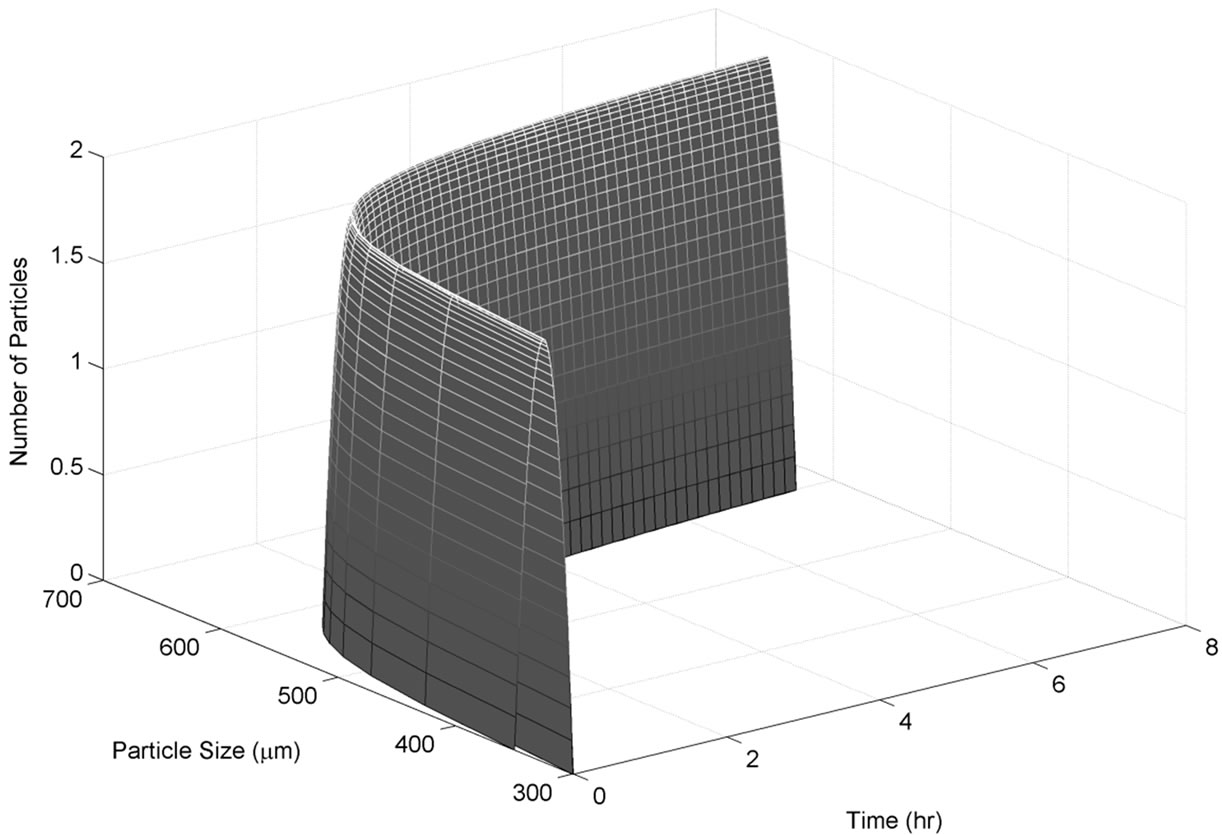
Figure 6. Simulated size distribution for the experimentation with Form I seed.
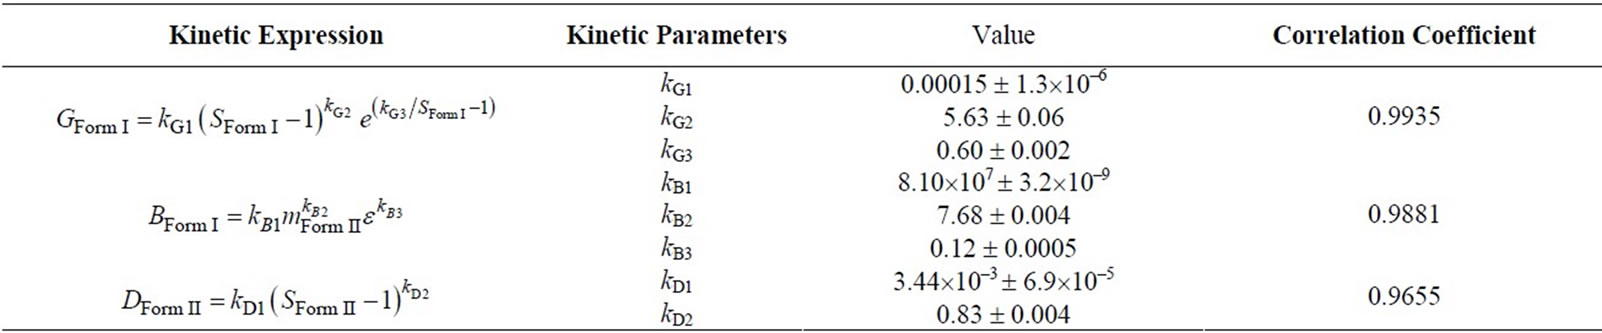
Table 1. Kinetic parameters for growth, nucleation and dissolution rate.
5.3. Polymorphic Transformation Experiments—Estimation of Dissolution Rate for Form II and Nucleation Rate for Form I
For this set of experiments we investigated the effect of seed mass on the polymorphic transformation. The experiments were conducted by very controlled seeding the saturated solution with Form II. Since the initial solute concentration was at the saturation point with respect to Form II, there was no driving force for growing seeded Form II crystals. However, Form II is the metastable polymorphic structure of BUS-HCl at the experimental temperature, and thus has a tendency to transform to stable polymorphic structure. The in-situ Raman spectroscopy monitoring and quantification of polymorphic forms confirmed this phenomenon. The solute concentration profile in liquid state for three different masses of Form II seeds is shown in Figure 7. It can be observed that the higher mass of seeds results in a faster dissolution of Form II. Figures 8 and 9 show the solid-state concentration profiles of Form II and Form I, respectively. These figures are based on moving average sampling time for every 6 minutes. As seen from these graphs, the nucleation of Form I started approximately an hour after the dissolution of Form II was initiated. This phenomenon is evident in Figure 7 as well, and explains the increase in the solute concentration profile after the dissolution of Form II occurred. Dissolution of Form II happens due to small subsaturation which can be seen in Figure 7. However, subsaturation was not detected for all points and that could be due to FTIR sensitivity. The higher mass of seeds resulted in faster dissolution, and consequently produced faster increase in supersaturation. It can be also noticed that the polymorphic transformation was faster for the higher mass of seeds, and that nucleation rate of Form I was positively related to the increase in mass of seeds. This can be explained by the fact that the dissolution rate of Form II was faster, and consequently the supersaturation with respect to Form I was larger as well. The parameter estimation technique presented in Section 4.3 for nucleation of Form I and dissolution rate of Form II along with the experimental data obtained from ATRFTIR and Raman spectroscopy was used to calculate the kinetic parameters of these two sub-processes. The estimated parameters for dissolution rate of Form II and nucleation rate of Form I are shown in Table 1. The modeled change in particle size distribution for Form II seeds and nucleated Form I particles are shown in Figures 10 and 11. As evident from these two Figures, the model correctly predicts the observed phenomena of dissolving the Form II seeds and delayed secondary nucleation of Form I particles. Note that these simulation results assumed the initial Form II seeds with the mass of 3 g/100g. Figure 12 shows the experimental and simulated solid composition for three different masses of Form II seeds. The solid composition profiles show that the polymerphic transformation for each of the studied cases was complete, i.e. Form II was completely transformed to Form I polymorphic structure. The product of each conducted experiment was characterized by XRPD to confirm the polymorphic identity, and the validity of the model. The average mass of material crystallizing per amount of seed was estimated to be between 70% to 80%.
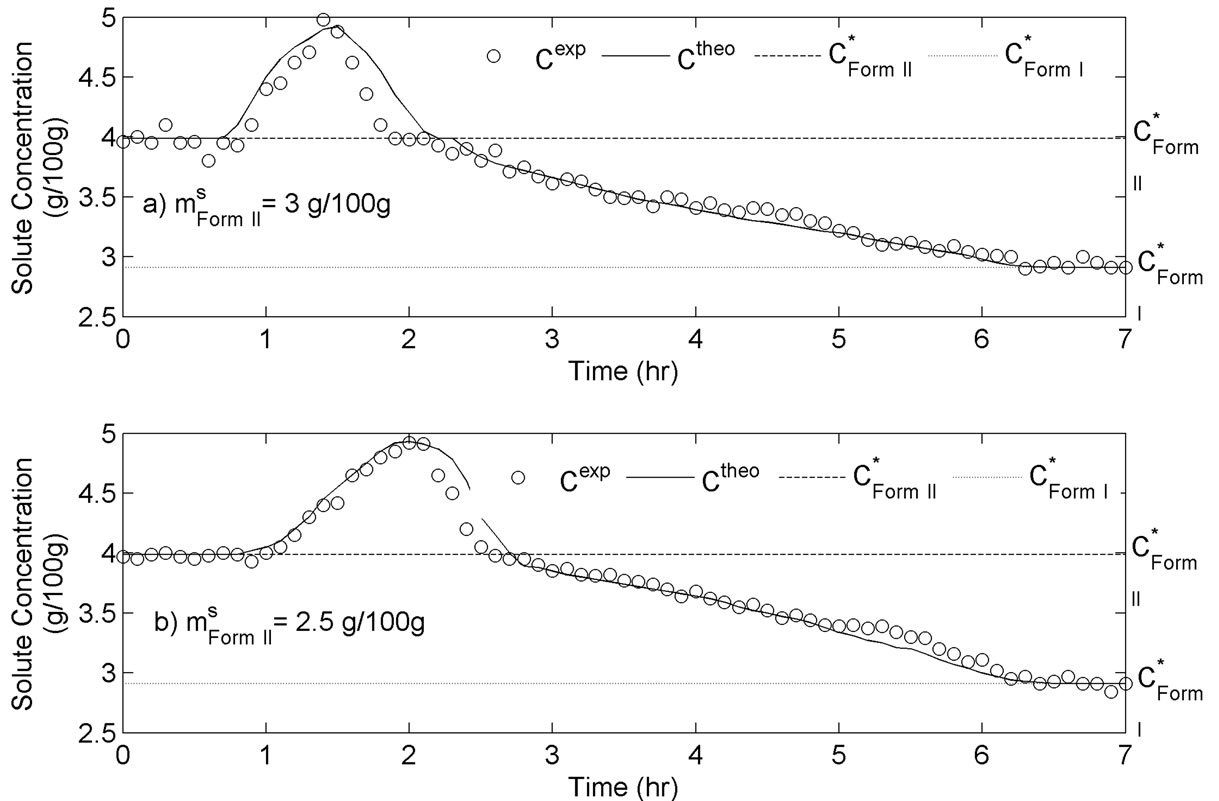
Figure 7. Experimental and simulated solute concentration during transformation of Form II to Form I experimentation.
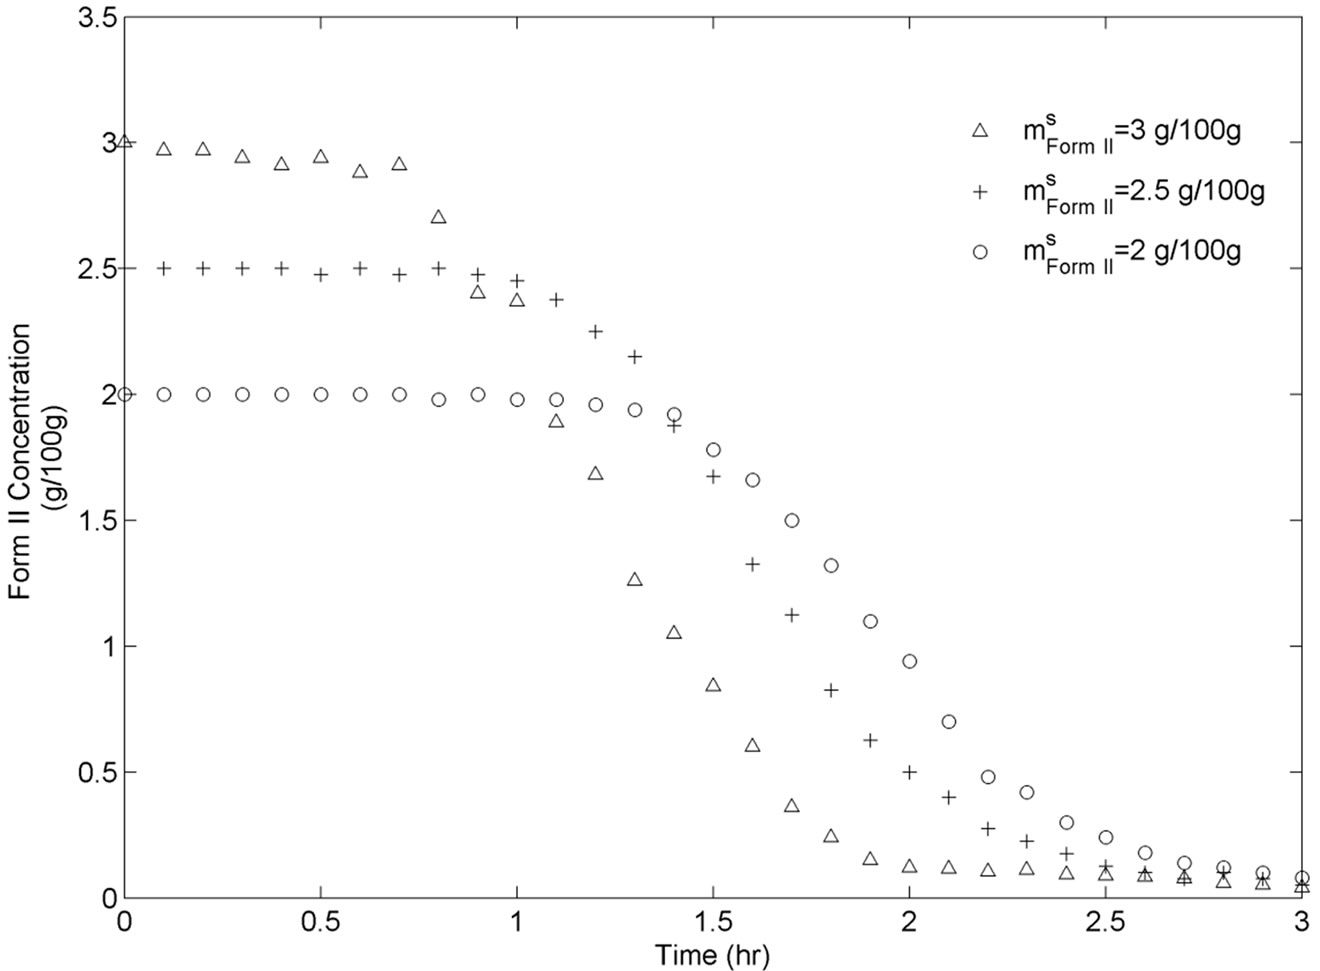
Figure 8. BUS-HCl Form II solid state concentration throughout transformation experiments for three different seeds.
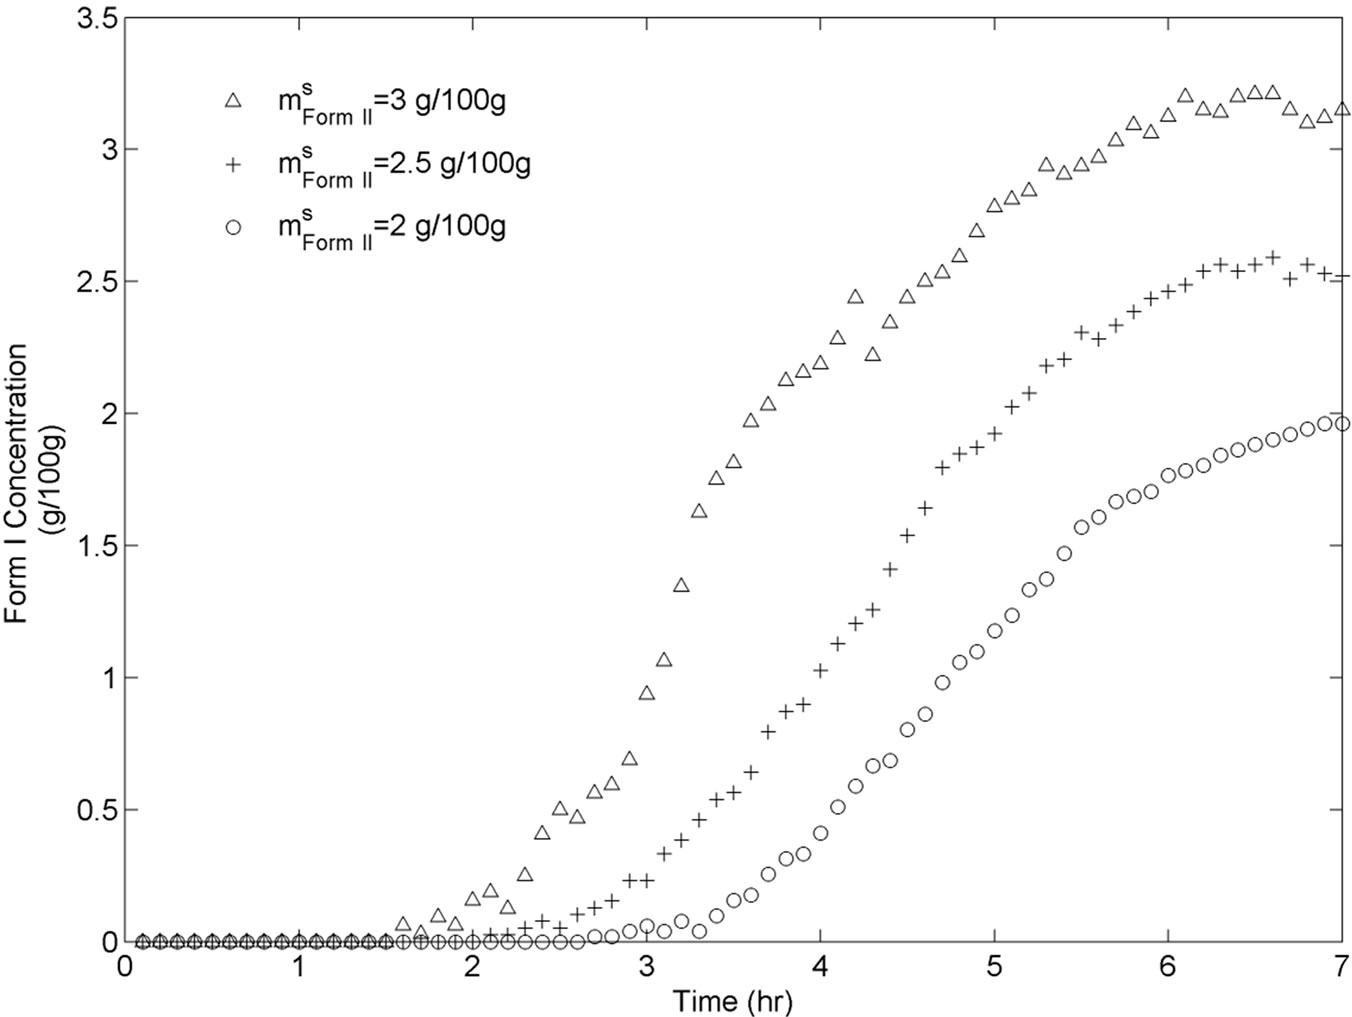
Figure 9. BUS-HCl Form I solid state concentration throughout transformation experiments for three different seeds.
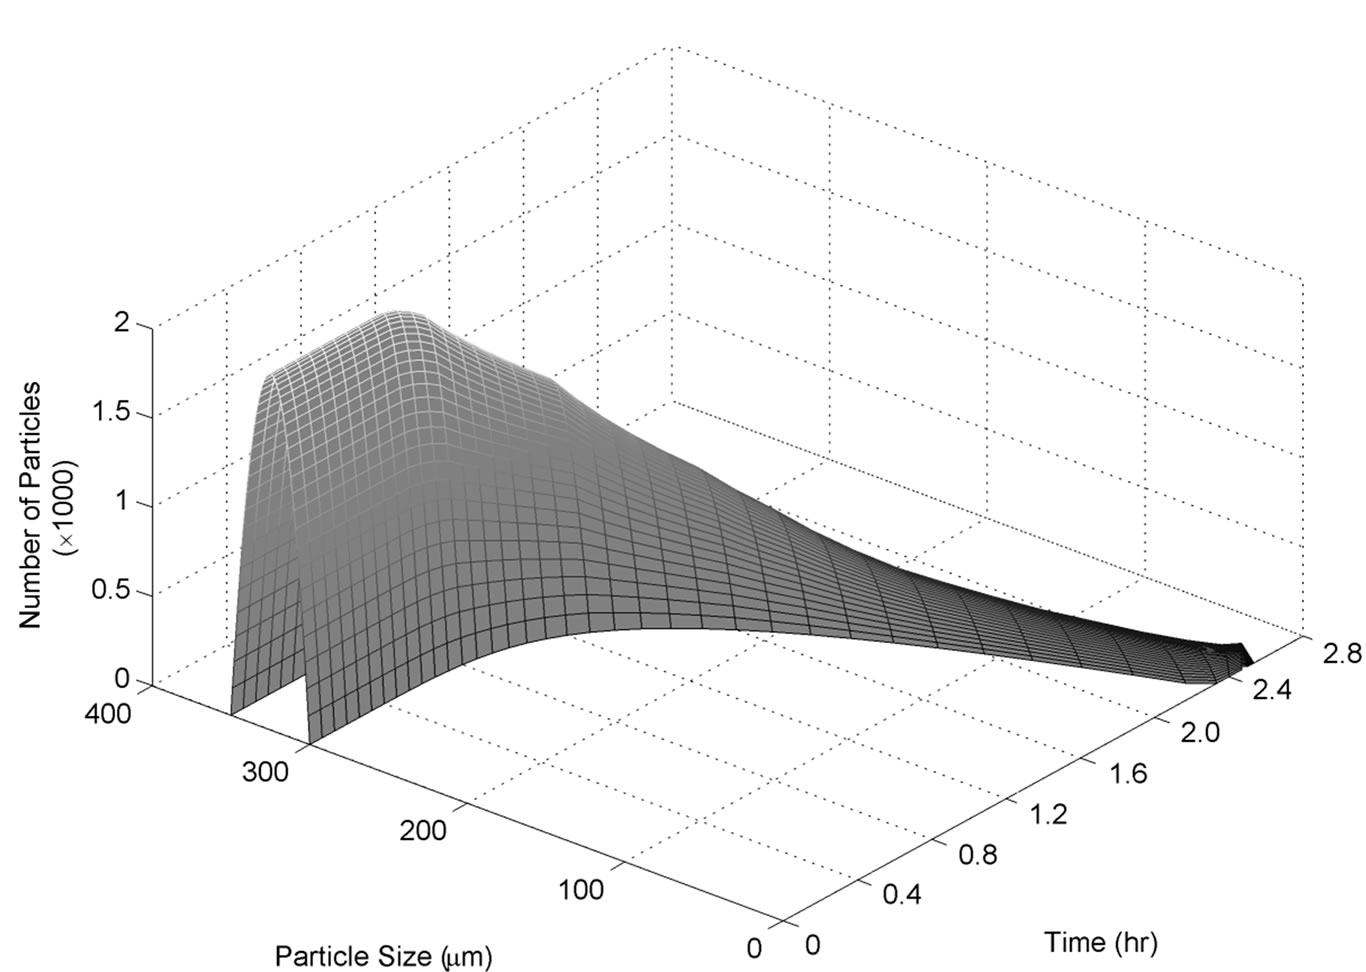
Figure 10. Simulated Form II size distribution during transformation of Form II to Form I experimentation.
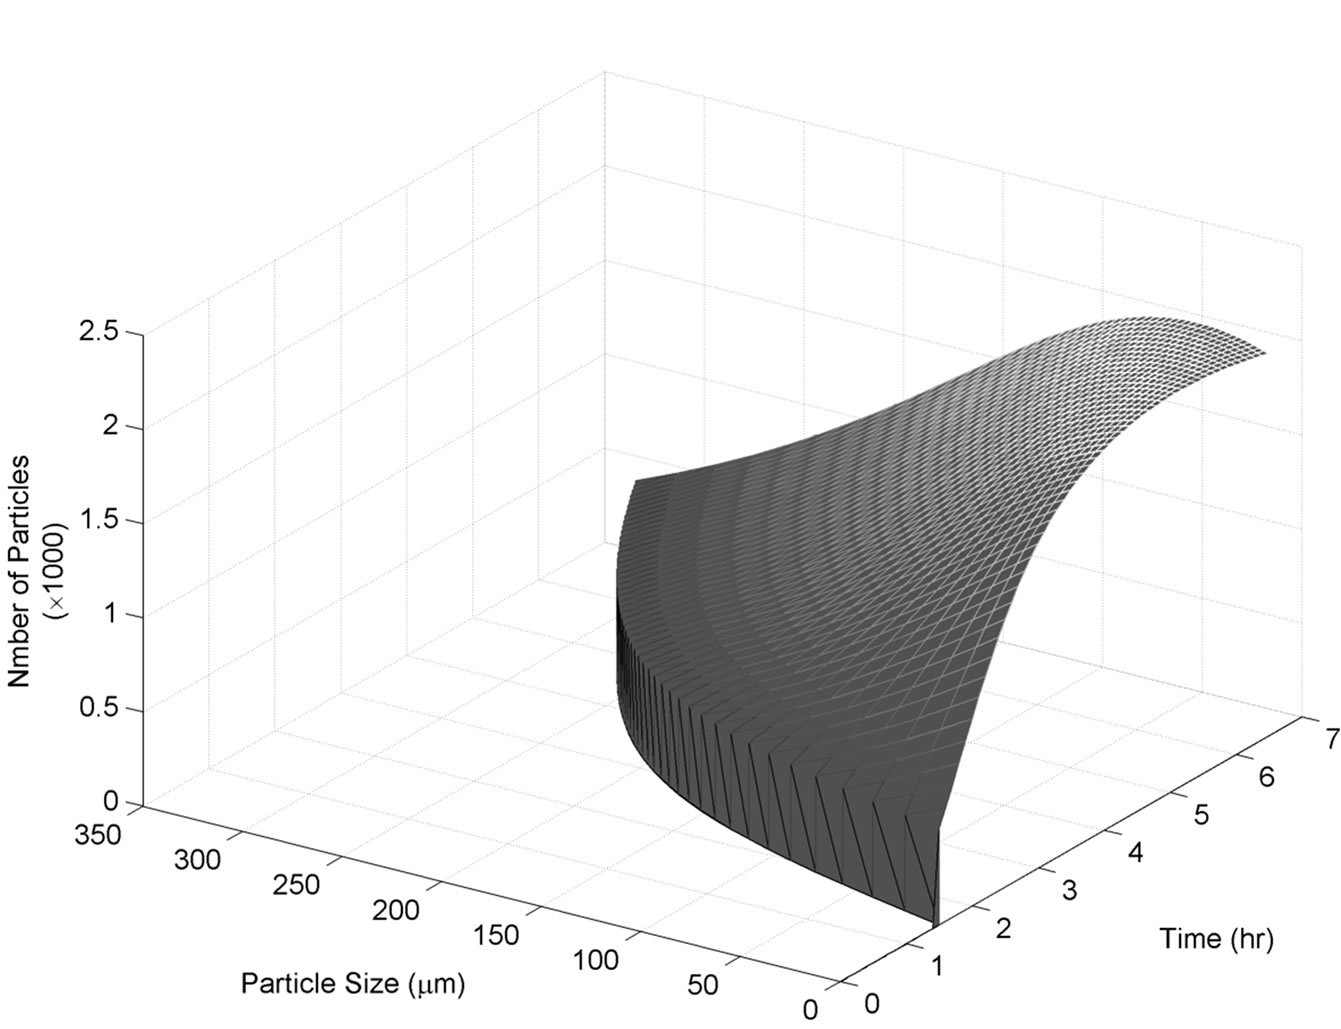
Figure 11. Simulated Form I size distribution during transformation of Form II to Form I experimentation
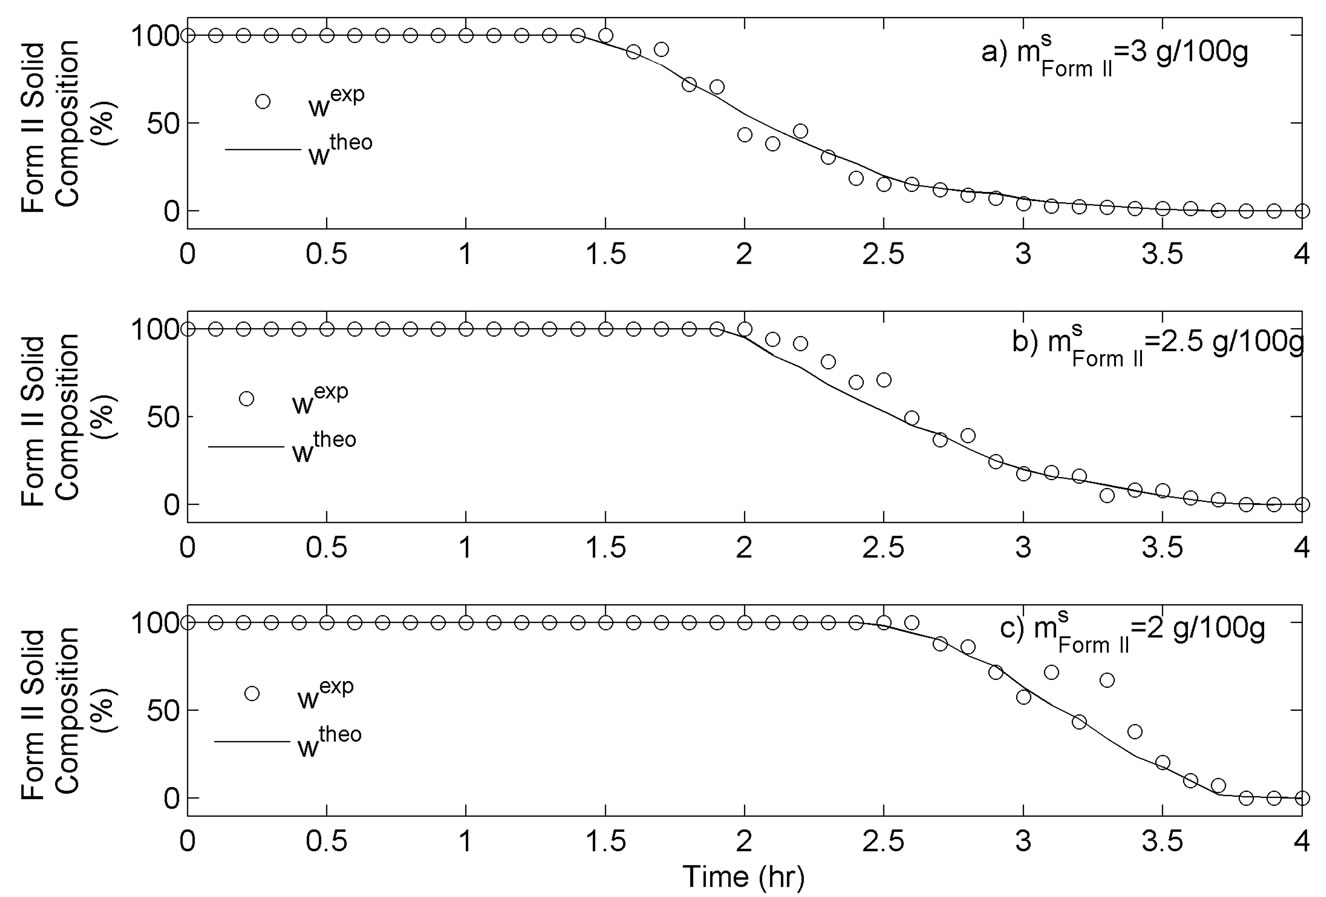
Figure 12. Simulated and experimental solid composition profiles for three different masses of Form II seed.
6. Conclusion
The solvent-mediated transformation of the metastable Form II to the stable Form I of BUS-HCl has been studied and a corresponding model developed and validated using experimental data. It was shown that the combination of experimental data obtained using in-situ Raman spectroscopy, FTIR spectroscopy, and FBRM, crystallization model, and non-linear least squares parameter estimation methodology, can be successfully utilized in order to get more insights into the polymorphic transformation. The polymorphic transformation is governed by first dissolution of metastable Form II and then the nucleation and growth of Form I, respectively. In order to estimate the parameters for each of the governing phenomena, sets of experiments, seeded by either Form I or Form II were conducted. The obtained information can be used for the development of an optimal control strategy, which would ensure obtaining the final product with the desired polymorphic structure. The developed technique and kinetic parameters can be implemented in the control strategy.
REFERENCES
- P. T. Cardew, R. J. Davey and A. J. Ruddick, “Kinetics of Polymorphic Solid-State Transformation,” Journal of the Chemical Society, Vol. 80, No. 6, 1984, pp. 659-668.
- R. J. Davey, P. T. Cardew, D. McEwan and D. E. Sadler, “Rate Controlling Processes in Solvent-Mediated Phase Transformations,” Journal of Crystal Growth, Vol. 79, No. 1-3, 1986, pp. 648-653. doi:10.1016/0022-0248(86)90532-4
- S. Rohani, S. Horne and K. Murthy, “Control of Product Quality in Batch Crystallization of Pharmaceuticals and Fine Chemicals, Part 1: Design of the Crystallization Process and the Effect of Solvent,” Organic Process Research & Development, Vol. 9, 2005, pp. 858-872. doi:10.1021/op050049v
- R. Hilfiker, “Polymorphism: In the Pharmaceutical Industry,” Weinheim, Wiley-VCH, 2006. doi:10.1002/3527607889
- A. Caillet, N. Sheibat-Othman and G. Fevotte, “Crystallization of Mono-hydrate Citric Acid. 2. Modeling through Population Balance Equations,” Crystal Growth & Design, Vol. 7, No. 10, 2007, pp. 2088-2095. doi:10.1021/cg0606343
- M. W. Hermanto, C. K. Nicholas, B. H. Reginald, C. M. Tan and R. Braatz, “Robust Bayesian Estimation of Kinetics for the Polymorphic Transformation of L-Glutamic Acid Crystals,” AIChE Journal, Vol. 54, No. 12, 2008, pp. 3248-3259. doi:10.1002/aic.11623
- J. Schöll, D. Bonalumi, L. Vicum, M. Mazzotti and M. Müller, “In Situ Monitoring and Modeling of the Solvent-Mediated Polymorphic Transformation of L-Glutamic Acid,” Crystal Growth & Design, Vol. 6, No. 4, 2006, pp. 881-891. doi:10.1021/cg0503402
- H. Qu, H. Alatalo, J. Kohonen, M. Louhi-Kultanen, S. Reinikainen and J. Kallas, “Raman and ATR FTIR Spectroscopy in Reactive Crystallization: Simultaneous Monitoring of Solute Concentration and Polymorphic State of the Crystals,” Journal of Crystal Growth, Vol. 311, 2009, pp. 3466-3475. doi:10.1016/j.jcrysgro.2009.04.018
- H. Grön, A. Borissava and K. J. Roberts, “In-Process ATR-FTIR Spectroscopy for Closed-Loop Supersaturation Control of a Batch Crystallizer Producing Monosodium Glutamate Crystals of Defined Size,” Industrial & Engineering Chemistry Research, Vol. 42, No. 1, 2003, pp. 198-206. doi:10.1021/ie020346d
- M. W. Hermanto, R. D. Braatz and M. Chiu, “A Run-toRun Control Strategy for Polymorphic Transformation in Pharmaceutical Crystallization,” IEEE Proceedings, Munich, 2006, pp. 2121-2126.
- M. Trifkovic, M. Sheikhzadeh and S. Rohani, “Multivariable Real-Time Optimal Control of a Cooling and Semibatch Crystallization Process,” AIChE Journal, Vol. 55, No. 10, 2009, pp. 2591-2602. doi:10.1002/aic.11868
- A. Caillet, F. Puel and G. Fevotte, “In-Line Monitoring of Partial and Overall Solid Concentration during SolventMediated Phase Transition Using Raman Spectroscopy,” International Journal of Pharmaceutics, Vol. 307, No. 2, 2006, pp. 201-207. doi:10.1016/j.ijpharm.2005.10.009
- B. O’Sullivan, P. Barrett, G. Hsiao and A. Carr, “Glennon, B. In-Situ Monitoring of Polymorphic Transformation,” Organic Process Research & Development, Vol. 7, 2003, pp. 977-982. doi:10.1021/op030031p
- H. Qu, M. Louhi-Kultanen, J. Rantanen and J. Kallas, “Solvent-Mediated Phase Transformation Kinetics of an Anhydrate/Hydrate System,” Crystal Growth & Design, Vol. 6, 2006, pp. 2053-2060. doi:10.1021/cg0600593
- Y. Hu, J. K. Liang, A. S. Myerson and L. S. Taylor, “Crystallization Monitoring by Raman Spectroscopy: Simultaneous Measurement of Desupersaturation Profile and Polymorphic Form in Flufenamic Acid Systems,” Industrial & Engineering Chemistry Research, Vol. 44, 2005, pp. 1233-1240. doi:10.1021/ie049745u
- T. Ono, J. H. Horst and P. J. Jansens, “Quantitative Measurement of the Polymorphic Transformation of L-Glutamic Acid Using in-Situ Raman Spectroscopy,” Crystal Growth & Design, Vol. 4, 2004, pp. 465-469. doi:10.1021/cg0342516
- G. Fevotte, “In Situ Raman Spectroscopy for In-Line Control of Pharmaceutical Crystallization and Solids Elaboration Processes: A Review,” Chemical Engineering Research and Design, Vol. 85, No. A7, 2007, pp. 906- 926. doi:10.1205/cherd06229
- M. Sheikhzadeh, S. Murad and S. Rohani, “Response Surface Analysis of Solution-Mediated Polymorphic Transformation of Buspirone Hydrochloride,” Journal of Pharmaceutical and Biomedical Analysis, Vol. 45, No. 2, 2007, pp. 227-236. doi:10.1016/j.jpba.2007.06.001
- M. Sheikhzadeh, S. Rohani, A. Jutan, T. Manifar, K. Murthy and S. Horne, “Solid-State Characterization of Buspirone Hydrochloride Polymorphs,” Pharmaceutical Research, Vol. 23, No. 5, 2006, pp. 1043-1050. doi:10.1007/s11095-006-9779-6
- A. D. Randolph and M. A. Larson, “Theory of Particulate Processes,” Academic Press, New York, 1988.
- Q. Hu, S. Rohani and A. Jutan, “Modeling and Optimization of Batch Seeded Cooling Crystallizers,” Computers & Chemical Engineering, Vol. 29, No. 4, 2005, pp. 911- 918. doi:10.1016/j.compchemeng.2004.09.011
- A. Mersmann, “Crystallization Technology Handbook,” Marcell Dekker Inc., New York, 2001. doi:10.1201/9780203908280
- J. Cornel, C. Lindenberg and M. Mazzotti, “Experimental Characterization and Population Balance Modleing of the Polymorph Transformation of l-Glutamic Acid,” Crystal Growth & Design, Vol. 9, No. 1, 2009, pp. 243-252. doi:10.1021/cg800387a
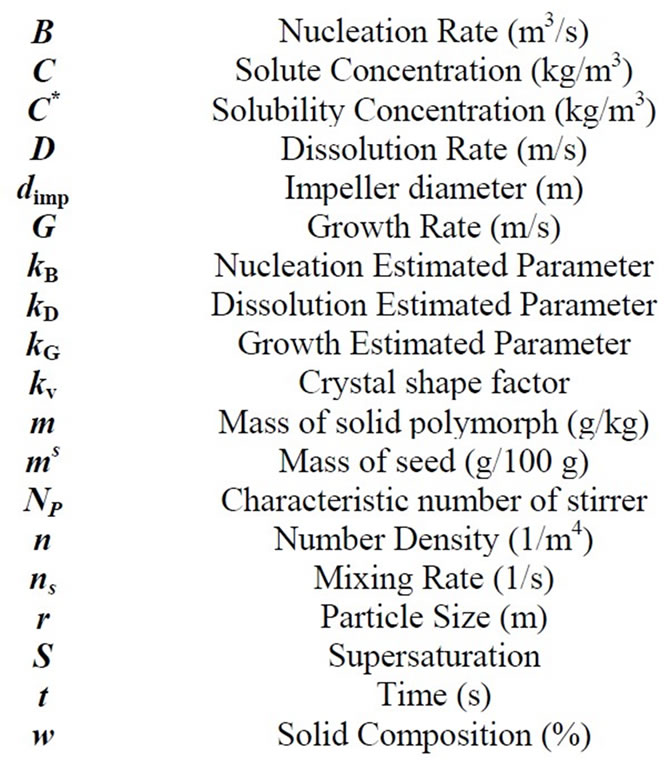
Nomenclature
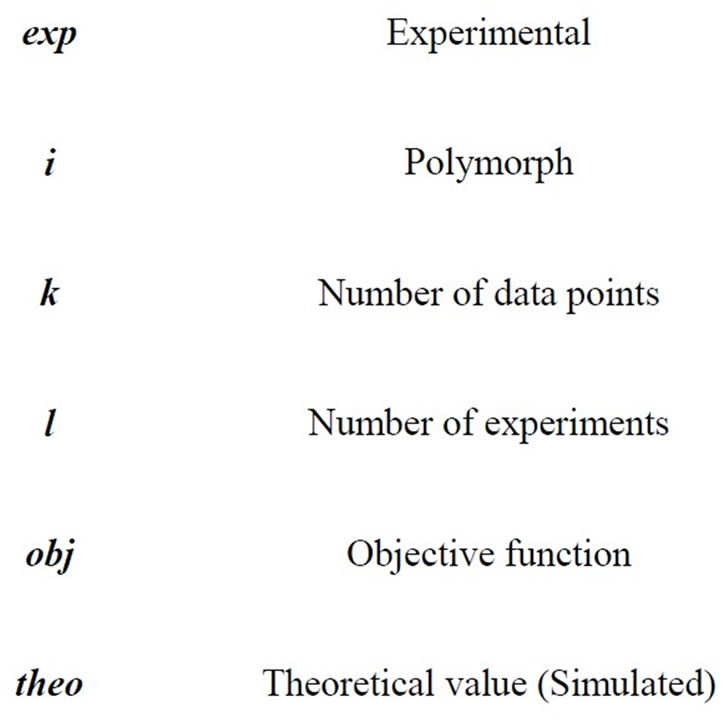
Super and Subscripts
NOTES
*Corresponding author.