Journal of Analytical Sciences, Methods and Instrumentation
Vol.08 No.03(2018), Article ID:87189,12 pages
10.4236/jasmi.2018.83003
Performance Evaluation of the Thick Pinhole Gamma Rays Diagnostic System*
Hongwei Xie, Jinchuan Chen, Linbo Li, Qiang Yi
Institute of Nuclear Physics and Chemistry, China Academy of Engineering Physics, Mianyang, China

Copyright © 2018 by authors and Scientific Research Publishing Inc.
This work is licensed under the Creative Commons Attribution International License (CC BY 4.0).
http://creativecommons.org/licenses/by/4.0/


Received: May 9, 2018; Accepted: September 4, 2018; Published: September 7, 2018
ABSTRACT
The diagnostic methods for the profile of the radiation source were established at first based on the pinhole imaging principle. In this paper, the relationships among various parameters of the gamma-rays crammer such as the modulation transfer function (MTF), the noise power spectrum (NPS), the signal-noise ratio (SNR) and the detective quantum efficiency (DQE) are developed and studied experimentally on the cobalt radiation source. The image diagnostic system is consisting with rays-fluorescence convertor (YAG crystal), optical imaging system, MCP image intensifier, CCD camera and other devices. The spatial resolution of the modulation transfer function (MTF) at 10% intensity was measured as 1 lp/mm by knife-edge method. The quantum of the measurement system is about 150 under weak radiation condition due to the single particle detection efficiency of the system. The dynamic range was inferred preliminarily as about 437. The required radiation intensity was calculated using the experiment result for the SNR = 1, 5, 10, respectively. The theoretical investigation results show that the radiation image with SNR = 1 can be only obtained when the pinhole diameter is 0.7 mm, object distance and image distance are both 200 cm, and the radiation intensity is about 1.0 ´ 1012 Sr−1×cm−2.
Keywords:
Gamma-Ray Camera, Pinhole, YAG, MCP Image Intensifier, CCD, MTF, NNPS

1. Introduction
The γ(neutron)-rays camera based on the pinhole imaging principle are widely used in the diagnostics of the radiation sources [1]. The diagnostic method based on MCP image intensifier, due to its performance in image intensification and shutter time gating, is also widely used in the study of imaging diagnostics of the pulse radiation source and weak radiation sources [2][3]. The system consists of rays-fluorescence convertor (YAG crystal), optical imaging system, MCP image intensifier, CCD camera and other devices. Radiation imaging quality is not only dependent on the quality of the imaging system, but also on other various factors, e.g., the incident flux of the γ-rays, the detecting efficiency of the γ-rays, energy conversion efficiency and quantum gain of the photographic system, etc.
On the other hand, imaging based on radiation source combined with thick pinhole is an ideal method of nondestructive detection with high spatial resolution. Point radiation source is ideal to be used in the nondestructive detection as the size of the radiation source is the critical factor for the spatial resolution, while it’s challenging to decrease the source size during the implementation of the system hardware. However the spatial resolution of the thick pinhole imaging is determined by the aperture of the pinhole, which can be reduced to improve the spatial resolution. In addition, this method for nondestructive detection will not be restricted by the source size.
Generally, performance of the imaging diagnostic system is calibrated with three main technical specifications: the modulation transfer function (MTF) [4], the noise power spectrum (NPS) [5][6], and the detective quantum efficiency (DQE) [7][8]. MTF is a universally accepted standard to calibrate the spatial resolution of the system. NPS, reflecting of the effects of the noise on the image quality, could present the difference of the image quality under different conditions of frequency spectra. DQE is used to reflect the detecting efficiency of the imaging diagnostic system to the γ-ray transmittance from the radiation source. Among the above-mentioned three specifications, there should be certain inherent relationships. In the case of the diagnostics of the high energy radiation sources, due to the relatively intense penetration effects of the γ-rays, the edge method becomes the major method to determine the MTF, which is represented by the Fourier Transform of the linear spread function (LSF). As for the NPS, it is resulted from the Fourier Transform of the image under the conditions of the flat field effects. The noise power spectra are different under different irradiation conditions. Another performance of the NPS is that it could be used to provide other parameters such as the signal-noise ratio (SNR). Finally in dealing with the DQE, it is related with such parameters as the detecting efficiency and quantum gain during the signal transmission [9]. The fluorescence gain of the scintillator is more than 103 photon/MeV [10]. At the same time, the quantum gain of the MCP imaging intensifier is also higher than 103 photon/photon. Thus, the quantum gain becomes an important factor affecting the image quality of the high-gain imaging diagnostic system.
In this paper, relationships among various parameters of the gamma-rays camera, MTF, NPS and DOE, are researched based on thorough analysis of the γ-rays camera. Meanwhile, the effects of these parameters upon the image quality are evaluated and studied experimentally.
2. Basic Principles of Pinhole Imaging with Gamma Rays
The schematic diagram of the basic principle of the thick pinhole imaging with the γ-rays is given in Figure 1. The process could roughly be interpreted as follows. Firstly, the radiation source is imaged onto the imaging plane (YAG) by γ-rays. YAG crystal is used to convert the γ-rays into the fluorescence image. Then the fluorescence image is imaged onto the incident plane of the MCP image intensifier through the optical imaging system and conversion system. Finally, the intensified image is recorded by CCD device, and the MCP and CCD are coupled with fiber plate. Thus, the major two parts of the system are γ-rays imagines system and the image recording system. Besides, a copper reflector with an efficiency of over 95% is placed in a 45˚ angle with γ-rays direction to reflect the fluorescence image, as well to avoid direct γ-rays irradiation onto the MCP image intensifier and CCD camera. The specially developed imaging system could provide an amplification factor of 5:1 and a light collection efficiency of over 95%. The MCP image intensifier was manufactured by Proxitronic Co. Ltd. with a spatial resolution of over 37 lp/mm. The amplification factor of the fiber plate used to couple the MCP and CCD is 1.5:1, providing a stable and reliable recording system.
3. Theoretical Modeling
3.1. Pinhole Imaging System
Suppose the detection efficiency of the γ-rays in the scintillator is Φ, and that the interactions of the γ-rays and the scintillator are abiding by the Gaussian distribution, then the fluctuated noise distribution induced by the detection efficiency would be , and accordingly the SNR of the signal input would be . Another major factor to affect the quantum efficiency is the commonly called Swank coefficient, the energy distribution of the secondary electrons induced by the interactions of the γ-rays and the scintillator. Due to the fact that the γ-rays camera used in the experiment has a high gain and good detection efficiency for single particle, the effects of Swank coefficient on the image quality was excluded during our data analysis.
According to the pinhole imaging principles, the detection efficiency on the scintillator imaging plane after the thick pinhole imaging with the γ-rays could be given in the following equation [11]:
(1)
where: f is the output intensity of the γ-rays from the radiation source; D is the pinhole diameter; L is the object distance, M is the amplification factor; t is the scintillator thickness; μ is scintillator linear attenuation coefficient. Substitute the

Figure 1. The schematic diagram of the thick pinhole imaging with γ-rays.
SNR into Equation (1), we have the following equation to express the relationship between the SNR and the radiation source intensity:
(2)
Again, based on the definition DQE [12], we would have the following equation:
(3)
Substitute Equation (2) into Equation (3), the relationships among the radiation source intensity, DQE and SNR are obtained as follows:
(4)
As indicated in Equation (4), in dealing with a given imaging diagnostic system, a radiation source with a corresponding intensity is necessary for a desired image quality to fulfill the experimental requirements or to get an ideal image under a certain SNR condition.
3.2. DQE of Image Recording System
The image of the radiation source is recorded in CCD, where, the signal intensity for each of the pixels is Np =Φ×Ad/np, where Ad is the corresponding area on the scintillator of np pixels. The system gain is related to MTF(f), and the output signal could be given in the following:
(5)
where, G is the signal gain with a 0 spatial frequency. The CCD signal output is constrained by the NPS of the system. And the noises of the CCD recording system are coming from three sources. The first source is the detection uncertainty of the scintillator detector. For example, in the case of the Gaussian distribution, where the detection uncertainty is , and the gained noise distribution of the detecting signals in the transmission system is G×MTF(f), the signal noise output from the CCD device should be σnn = G×MTF(f)× . The second source is the uncertainty of the transmission gain of the γ-rays . Namely, if the detection uncertainty of the γ-rays for each of the pixels is , the corresponding noise would be σnp = . Finally, the third source is the dark current in the recording system, interpreted as σnd = nr×te (nr is the dark charges in a unit time and te is the exposure time). Thus, the corresponding noise distribution for each of the pixels could be obtained as follows:
(6)
(7)
And the SNR of the CCD output signals is given in the flowing:
(8)
Suppose the input signals are in the Gaussian distribution, and the SNR of the input signals could be as follows:
(9)
Then, according to Equation (3), the DQE for the CCD imaging recording system should be:
(10)
Again, in the case of an ideal scientific-level CCD whose dark charges could be reasonably negligible, Equation (10) could be well rewritten into:
(11)
Substitute Equation (11) into Equation (4), the relationships among the radiation source intensity, MTF, quantum gain and output SNR could be given in the following:
(12)
Based on the careful deduction mentioned above, the relationships among the radiation source intensity, SNR, quantum gain and MTF could be well established. And in dealing with a given system and image SNR, the necessary intensity of the radiation source could also be determined.
4. Analyses on Major Parameters
4.1. Quantum Gain (G)
The quantum gain of the detector, G, depends on the system MTF(f), whose value in different spatial frequencies could be expressed as G×MTF(f). When f = 0, MTF(0) = 1. And the quantum gain is decreased gradually with the increasing spatial frequency. While the MTF is related with the gains of multiple components of the system, including the γ-ray-fluorescence convertor, the optical imaging system, the MCP image intensifier and the CCD device, etc. however, in the actual calculations, the gain at f = 0 is common used as the standard.
The quantum gain mainly consists of the flowing components: Φ (the acting efficiency between the γ-rays and the scintillator); Gγ (the number of the fluorescence lights induced by each of the activated detected particle); (the fluorescence efficiency of the imaging system); εMCP (the DQE of the MCP image intensifier); MMCP (the gain of the MCP image intensifier); etap (the penetration rate between the MCP fluorescence screen and CCD); εCCD (the quantum efficiency of CCD device). Other factors that affect the quantum gain include parameters of the simulated conversion systems inside the CCD device. Finally, the quantum gain of the system could be given in the following equation:
(13)
The following are some specifications of the equipments or devices used in the experiment. The quantum gain of YAG crystal is about over 1.5 ´ 103/MeV. The optical imaging system was deliberately processed with a fluorescence efficiency of over 1%. The MCP image intensifier with conductive matrix could provide a quantum efficiency of about 45%. The coupling efficiency of the fiber plat for MCP image intensifier and CCD device are about 70%. The quantum efficiency of the backward photosensitive CCD device is more than 90%. The scientific-level CCD could provide a 16bit transmission in a digital conversion mode of 6e/ADU. After all, the image recording system, as a whole, could provide a satisfactory performance in the single particle detection of γ-rays, and could be used for the image diagnostics of the weak radiation sources.
4.2. Modulation Transfer Function (MTF)
As mentioned above, the system consists of a thick pinhole, YAG crystal, MCP image intensifier, CCD camera and other devices. According to the law of the MTF transference, the system MTF could be given in the following equation:
(14)
In the calculation, the spatial resolution at the scintillator would be set up as the standard, while the MTF values of other devices should be converted into the spatial resolution at the scintillator in accordance with the amplification factor of the optical imaging system. For example, with a MCP image intensifier of 40 lp/mm in the maximal spatial resolution, if the amplification factor of the optical imaging system is 0.2, the corresponding spatial resolution at the scintillator should be about 8 lp/mm. In this extent, the amplification factor of the imaging system should have relatively considerable effects on the MTF in the image transmission. For different device, the measurement of MTF is also different. For example, the MTF measurement of MCP image intensifier and CCD device could be made with slit method and point source method, by which the MTF could be obtained from LSF. Meanwhile, for the YAG scintillator under the γ-rays irradiation, the MTF could be obtained mainly with edge method. Notably, there are some other factors to affect the MTF that could not be negligible, such as the dispersion effects of the secondary γ-rays and the fluorescent lights in the scintillator.
Besides the experimental measurement, the MTF of the detector could also be provided by mathematical algorithm. For example, generally, the following could be obtained from calculation, such as the effects of the fiber plate structure on the MCP image intensifier, the effects of the CCD pixel size on the image recording, the effects of the lens size on the optical spatial resolution, and the spatial resolution of the pinhole imaging system, etc. And for the separated devices, the MTF could be obtained from the following equation:
(15)
where: f is the spatial resolution; D is the size of any one of the following items, including the size of the pinhole aperture, the size of the CCD pixel, the diameter of the lens, the spatial resolution of the fiber plate, etc. The MTF of the image diagnostic system is the total sum of the MTFs of all the devices, which is given in Equation (14). As for the thick pinhole imaging system, except the MTF of the pinhole imaging system, the MTFs of all the devices that compose the image system could be determined experimentally.
4.3. Effects of SNR on Image Quality
In the radiation imaging diagnostics, in order to get the radiation image worthy of analysis especially the image reflecting the evolution of the spatial intensity, the output image should have to have a certain SNR. For example, in the case of a relatively intense radiation source, the output image is generally required to have a SNR of bigger than 5 to contain the effects of the noise upon the image quality. Again, since the SNR is mainly depending on the detection efficiency of the γ-rays for the scintillator, the scintillator with relatively bigger thickness is common used to provide better detection efficiency. This is the reason for the widely application of the fiber array scintillators in the ICF experiments. However, such schemes for a higher SNR work but with a compromise of a lower spatial resolution, because the spatial resolution is limited by the fiber scintillator.
5. Experiment and Measurement Data
5.1. Measurement of Background Noise
The background noise of the system was measured in the beginning. During the measurement, the imaging system is placed in a hohlraum, where the background noise induced by the hot electrons was measured, and the detection efficiency on the scintillator of the cosmic γ-rays as well. The maximum signal of the system was 65,535. The integral time for the measurement of the background noise was 1000 s. And the average signal obtained was 2000, indicating a SNR of 30 in comparison with the 65,535 saturated signals. Actually in our experiment, the recording time of the system in the radiographic imaging process is only 2 ms, a so short time with little effect negligible on the image quality.
5.2. Experimental Measurement of MTF
With a cobalt radiation source, the edge method was to measure the system MTF. The radiation source was a 0.7 cm × 45 cm rod, shielded with a lead slit collimator (5 mm × 50 mm in size and 200 mm in thickness). In this way, the size of the radiation source was confined within a range 5 mm in width. A tungsten edge collimator (10 cm in thickness) was placed tightly contacting the scintillator to shield the γ-rays and to provide the edge image appropriate for analysis. Then, a laser beam about 2 mm in diameter was introduced as the fundamental beam, which would pass throng the collimator center and irradiate onto the scintillator perpendicularly. The tungsten collimator was placed on a rotator. The best edge image could be obtained by rotating the rotator and monitoring the edge images. With this image, the linear spread function (LSF) could be obtained. And the MTF could be available after Fourier transformation.
In the case of a thick pinhole 0.7mm in aperture size, the relative intensities with different frequencies could be calculated according to Equation (15) (Figure 2). As shown, the maximal resolution of the image recording system was about 1.5 lp/mm, basically same with that of the thick pinhole imaging system.
5.3. Quantum Gain
The quantum gain of the image diagnostic system is closely dependent on the performance and working state of the components. Since the quantum gain for each of the components is obtained under a given specific condition, relatively big uncertainly is inevitable in the evaluation of the total quantum gain of the system. Another way to calibrate the total quantum gain of the image recording system is to carry out experiment. In our experiment, the deliberately designed optical imaging system with relatively high light collection efficiency, could provide detection efficiency for single particle for the system. However, the detected signals of the single particles are different, due to the deposited energy of the secondary electrons in the scintillator and different transmission distance of the secondary electron. As seen in Figure 3 and Figure 4, the average intensity under lower radiation intensity is about 42. At the same time, for every single particle, its occupation in the image would be 2 to 4 pixels. Thus, based preliminary evaluation, the total quantum gain for each of the activated γ-rays was about 150. Since the MCP image intensifier has 10 tunable electric amplification factors, the quantum gain would also be different under the different electronic gain conditions.
5.4. Output SNR
During the experiments, considerable measurements were made, including those of the MTF, quantum gain and the related noise power spectra. Based on the experiments, a relatively keen insight and deep understanding of the image characteristics were obtained. The minimal radiation intensity required for various SNR conditions could be calculated in accordance with Equation (12). And the radiation source intensity varies with various frequencies. Thus, in order to get a radiation image appropriate for analysis, the SNR is generally required to be higher than 5. Equation (12) was used for the calculation of the radiation intensities in various frequency conditions, whose results are given in Figure 5. As indicated in the results, a higher SNR could be available with higher radiation source intensity.
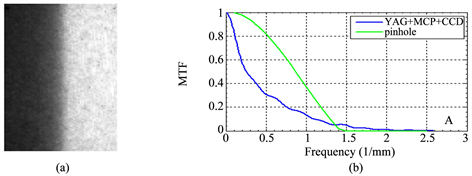
Figure 2. (a) The edge image measured with cobalt radiation source; (b) The MTF of the pinhole imaging system experimentally measured.
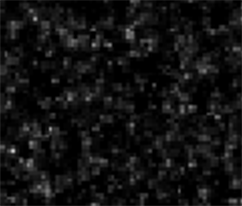
Figure 3. The radiation image under a single particle action.
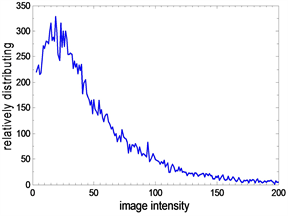
Figure 4. The schematic distribution of the quantum gain.
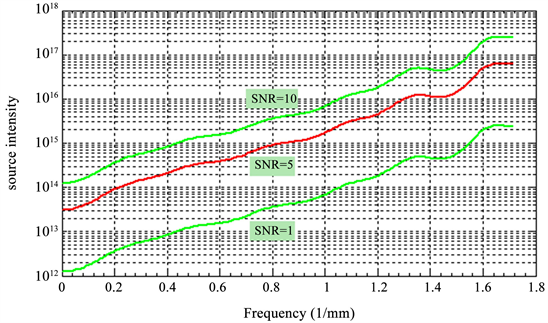
Figure 5. The schematic diagram of the relationship among the radiation source intensity, the SNR and the spatial frequency.
6. Data Analysis
6.1. Effects of DQE on Image Quality
The DQE of the image diagnostic system is mainly dependent on the probability of the interaction between the γ-rays and the scintillator. The spurious speckle effects in the image are mainly due to the energy of the secondary electrons and fluorescent efficiency. And size of the speckles is determined by the electronic transmission distance (i.e. the fluorescent dispersion). Each of the interacting spot would be considered as a spot light source, and the total sum of the spots would reflect the image intensity. Due to the spurious speckle effects and their distribution, under a weak radiation condition, the image intensity would not be changed linearly with the change of the radiation intensity.
The deliberately designed optical imaging system is characterized in a high light collection efficiency, high DQE and optical gain in the optoelectronic system. The thermal noise of the electronic system is so little and could be neglected. The system could have good detection efficiency for a single photon to capture each of the fluorescent light induced by the interaction between the scintillator with the secondary electron. The quantum gain in the optimal conditions could be as high as about 150. In dealing with maximal image intensity of about 65,535, the dynamic range of the quantum gain of the imaging system was within about 437. Thus the requirements for the image diagnostics with relatively small uncertainty could be well fulfilled.
6.2. System MTF
The image recording system mainly consists of the YAG scintillator, the MCP image intensifier, CCD camera and other devices. Each of the components has its own way for the MTF measurement. All the MTFs of the components were measured independently in accordance with the corresponding measurement method. And the MTF of the system would be the total sum of the all the MTFs of the components. However, due to measurement conditions for the each of component varies from each other, the total MTF of the system would be obtained with big uncertainty. In this extent, the edge method could not be used for the direct measurement of the MTF of the imaging system. In our experiment, the edge collimator was placed on the rotator to monitor the evolution of the image quality. Due to limited experimental conditions, the monitoring was made only for a range from −5˚ to 5˚. During this process, image quality was found with little change, which should be another implication that the fluorescent dispersion should be a major cause for the image degradation. And the fluorescent dispersion is then composed of the dispersion effects in the scintillator and the defocusing effects of the optical imaging system. In order to get higher light collection efficiency, the spatial resolution of the optical imaging system has to be decreased. In this context, the spatial resolution might not be as good as expectation. As compensation, the high light collection efficiency could provide fairly good results in the image diagnostics especially in dealing with the weak radiation conditions with special requirements. The spatial resolution of the thick pinhole imaging system could not be measured in certain conditions, which could be obtained mainly based on the theoretical design and related theoretical calculation.
7. Conclusion
The principle of the using pinhole imaging to obtain the radiation source profile was introduced in this paper. The image diagnostic system consisted of a pinhole, a YAG scintillator, a optical imaging system, a MCP image intensifier and a CCD device. The relation of the signal transmission process, DQE, NPS, quantum gain, SNR of the system and the source intensity was analyzed. The main conclusions were as follows, 1) The MTF at 10% of the system was about 1 LP/mm; 2) As the single-particle detection efficiency of the system, the stray speckle image would be observed under low radiation intensity, based on which the quantum gain of the system could be obtained as about 150; 3) As well the single-particle detection efficiency, the effect of the secondary gamma ray and fluorescence to the spatial resolution would totally submerged in the quantum fluctuation caused by the stray speckle; 4) Based on the established relation of the DQE, quantum gain, SNR and the source intensity, the minimum source intensity required under different SNRs was calculated.
Conflicts of Interest
The authors declare no conflicts of interest regarding the publication of this paper.
Cite this paper
Xie, H.W., Chen, J.C., Li, L.B. and Yi, Q. (2018) Performance Evaluation of the Thick Pinhole Gamma Rays Diagnostic System. Journal of Analytical Sciences, Methods and Instrumentation, 8, 25-36. https://doi.org/10.4236/jasmi.2018.83003
References
- 1. Christensen, C.R. and Barnes, C.W. (2003) First Results of Pinhole Neutron Imaging for Inertial Confinement Fusion. Review of Scientific Instruments, 74, 2690-2694.
- 2. Yates, G.J. and King, N.S.P. (1997) High-Frame-Rate Intensified Fast Optically Shuttered TV Cameras with Selected Imaging Applications. SPIE Conference Proceedings, Vol. 2273, 26-149.
- 3. Vartsky, D. (2009) Signal and Noise Analysis in TRION—Time-Resolved Integrative Optical Fast Neutron Detector, Soreq NRC, Yavne 81800. Journal of instrument, 2, 1-18.
- 4. Xiang, C.C. and Chen, X.H. (2010) MTF Measurement and Imaging Quality Evaluation of Digital Camera with Slanted-Edge Method. Proceedings of SPIE, Photonics Asia, Vol. 7849, Beijing, 5 November 2010, 78490A. https://doi.org/10.1117/12.869937
- 5. Park, H.-S. and Kim, H.-J. (2008) Measurements and Evaluation of the Image Noise Power Spectrum for Computed Radiography. 2008 IEEE Nuclear Science Symposium Conference Record, Dresden, 19-25 October 2008, 4378-4383. https://doi.org/10.1109/NSSMIC.2008.4774252
- 6. Miévillea, F.A., Bolardbm G., et al. (2011) 3D Noise Power Spectrum Applied on Clinical MDCT Scanners: Effects of Reconstruction Algorithms and Reconstruction Filters. SPIE Medical Imaging, Vol. 7961, Orlando, 79610E.
- 7. Lubinsky, A.R. and Zhao, W. (2008) Screen Optics Effects on DQE in Digital Radiography: Spatial Frequency Effects, Proceedings of SPIE, Medical Imaging 2008: Physics of Medical Imaging, Vol. 6913, San Diego, 18 March 2008, 69134F.https://doi.org/10.1117/12.772973
- 8. Park, H.-S. and Kim, H.-J. (2010) Effects of Image Processing on the Detective Quantum Efficiency. SPIE Medical Imaging, Vol. 7622, San Diego, 23 March 2010, 76220M.
- 9. Gang, G.J. and Zbijewski, W. (2012) Theoretical Framework for the Dual-Energy Cone-Beam CT Noise-Power Spectrum, NEQ, and Tasked-Based Detectability Index. Proceedings of SPIE, SPIE Medical Imaging, Vol. 8313, San Diego, 23 February 2012, 83131J. https://doi.org/10.1117/12.911817
- 10. Mah, D. and Rawlinson, J.A. (1999) Detective Quantum Efficiency of an Amorphous Selenium Detector to Megavoltage Radiation. Physics in Medicine & Biology, 44, 1369-1384. https://doi.org/10.1088/0031-9155/44/5/320
- 11. Xie, H.W., Peng, T.P., Xu, Z.P. and Chen, F.X. (2011) Thick Pinhole Design Applied to High Energy γ-Ray Source Radiographic Diagnostics. Nuclear Electronics & Detection Technology, 31, 143-147.
- 12. Cremer, J.T., Piestrup, M.A. and Wu, X.Z. (2005) Fast and Thermal Neutron Radiography. Proceedings of SPIE, Optics and Photonics, Vol. 5923, San Diego, 21 September 2005, 59230A. https://doi.org/10.1117/12.624972
NOTES
*1) Sponsered by: National Natural Science Foundation of China (Contract No. 11005095, 11305155). 2) About the author: Hongwei Xie (1966), male, associate professor, master of science, mainly engaged in the study of image diagnostics of pulse radiation source.