Social Networking
Vol. 1 No. 2 (2012) , Article ID: 23423 , 9 pages DOI:10.4236/sn.2012.12002
Assessment of Random Recruitment Assumption in Respondent-Driven Sampling in Egocentric Network Data*
1Department of Epidemiology and Biostatistics, School of Public Health, University of Maryland, College Park, USA
2Yunnan Institute for Drug Abuse, Kunming, China
Email: hliu1210@umd.edu
Received August 8, 2012; revised September 14, 2012; accepted October 9, 2012
Keywords: Respondent-Driven Sampling; Random Selection Assumption; Egocentric Network
ABSTRACT
Background: One of the key assumptions in respondent-driven sampling (RDS) analysis, called “random selection assumption,” is that respondents randomly recruit their peers from their personal networks. The objective of this study was to verify this assumption in the empirical data of egocentric networks. Methods: We conducted an egocentric network study among young drug users in China, in which RDS was used to recruit this hard-to-reach population. If the random recruitment assumption holds, the RDS-estimated population proportions should be similar to the actual population proportions. Following this logic, we first calculated the population proportions of five visible variables (gender, age, education, marital status, and drug use mode) among the total drug-use alters from which the RDS sample was drawn, and then estimated the RDS-adjusted population proportions and their 95% confidence intervals in the RDS sample. Theoretically, if the random recruitment assumption holds, the 95% confidence intervals estimated in the RDS sample should include the population proportions calculated in the total drug-use alters. Results: The evaluation of the RDS sample indicated its success in reaching the convergence of RDS compositions and including a broad cross-section of the hidden population. Findings demonstrate that the random selection assumption holds for three group traits, but not for two others. Specifically, egos randomly recruited subjects in different age groups, marital status, or drug use modes from their network alters, but not in gender and education levels. Conclusions: This study demonstrates the occurrence of non-random recruitment, indicating that the recruitment of subjects in this RDS study was not completely at random. Future studies are needed to assess the extent to which the population proportion estimates can be biased when the violation of the assumption occurs in some group traits in RDS samples.
1. Introduction
It has been a challenge for researchers to construct scientifically sound samples of hidden populations because sampling frames do not exist. Respondent-driven sampling (RDS) [1,2], a network-based sampling method, has been designed to overcome this problem. It has been considered an innovative and powerful sampling approach for the recruitment of hidden populations [3-5] . Specifically, it has been used in more than 120 studies in over 25 countries to estimate the prevalence of HIV and other sexually transmitted infections (STIs), as well as the associated risk factors for these infections in hidden populations [6].
The primary aim of RDS analysis is the estimation of population proportions in a hidden population. RDS analysis is premised upon the assumptions imposed in the estimation of population proportions. If these assumptions are not met, the estimations of population proportions may be biased. One of the key assumptions in RDS, called the “random recruitment assumption,” is that “When recruiting others, respondents select uniformly at random from their personal network” [2]. The random recruitment assumption is necessary for the selection of a weighted representative sample of network alters and calculation of unbiased population proportions [2,7]. If it does not hold, the estimation of the personal network compositions will be biased. Consequently, the estimations of population proportions will be biased as well.
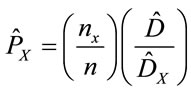
The connection between the assumption of random recruitment and the RDS estimated population proportions is documented in the following RDS II estimator (1) [2,8] :
 (1)
(1)
where nx is the number of respondents in group X (for example, respondents who are heroin injectors), n is the total number of respondents (for example, all injection drug users and non-injection drug users), and  is the estimate of the average degree of the total population.
  is the estimate of average degree of group X. In the above equation,
  is the proportion of the group X. If a sample were a simple random sample, this
  would be the estimate for
 . In RDS, we are not making simple random draws from a population, and some individuals will be selected with greater probability than others. The RDS-estimated population estimate
  is the sample proportion
 , weighted by a correction for network effects
 . If the random recruitment assumption does not hold, both sample proportion
  and network effects
 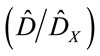 can be biased, leading to a biased estimate of population proportion.
Although the random recruitment assumption serves as a basis for population proportion estimates, empirical assessment of it is rare [9,10] . One of the challenges to assessing this assumption is that detailed data on social network compositions are usually not available in RDS surveys. As a result, the data for network composition obtained in an RDS sample could not be directly compared to the personal network composition acquired from social network alters [11]. We conducted an egocentric social network study among young drug users in China, in which RDS was used to recruit this hard-to-reach population. The objective of this report was to assess the random recruitment assumption in the empirical data of egocentric networks. Detailed data about personal network compositions in this egocentric network study provided necessary information for this assessment. In this report, we first used the RDS standard criteria to examine if the RDS sample reach equilibrium, and then assess the random recruitment assumption.
2. Methods
2.1. Study Site and Subjects
This egocentric social network study was conducted in two contiguous small counties in Yunnan province in 2009. Yunnan province, adjacent to the Golden Triangle of drug trafficking, is the center of the HIV epidemic in China. The eligible criteria included individuals who (1) were 18 - 35 years old and resided in either of the counties, and (2) used heroin or/and opium (smoked, snorted, or injected) at least once a week in the 30 days prior to the interview. The study protocol was approved by the Institutional Review Boards of Virginia Commonwealth University and the Yunnan Institute of Drug Abuse.
2.2. Respondent-Driven Sampling
Respondent-Driven Sampling (RDS) was used to recruit the study participants [12]. In order to select productive seeds, we conducted in-depth interviews among 28 drug users and held focus-group discussions among those who had experience in working with drug users, including public health staff at the two county Centers for Disease Control and Prevention and outreach volunteers who were drug users [13]. The major topics included suggestions on the selection of seeds, the participants’ perspectives on recruitment of their network alters, the amount of incentives, and the selection of interview sites. Based on the findings of the qualitative studies and with the help of the outreach volunteers, we selected a group of 14 seeds. These seeds were diverse in modes of drug use (injection drug use or non-injection drug use), gender, ethnicity (majority or minorities), marriage status, and resided in either of the two counties. These seeds received an explanation of the study purpose and procedures and three coupons to recruit up to three drug users from their network alters. Printed on the coupons were the project name, address of interview sites, phone numbers, and office hours. The unique serial number on each coupon linked each subject to his recruits. Like the seeds, all new recruits in subsequent waves participated in an anonymous interview and were offered three coupons. After completion of the egocentric social network questionnaire, respondents were asked to recruit alters from the networks that they reported. Three recruitment and interview sites were set up in the two counties. The selection of the sites was based on two conditions: drug users had easy access (less than 1 hour-travel time and open on the weekends) and the sites allowed for the protection of participants’ confidentiality. Since the two counties are small and contiguous and drug users have many overlapping activities across the two counties, there was cross-recruitment of study subjects between the counties. Different from the administrative zones in the US, counties in China are much smaller than cities. In China, one city usually consists of several small counties.
Participants were compensated for their time and transportation costs, with US$6 given for their participation in the interview and US$2.7 for each eligible subject they recruited.
3. Interview
Eligible subjects recruited by the seeds and new recruits in subsequent waves participated in a face-to-face anonymous interview in a private interview room. All interviewers received training in interviewing techniques, developing rapport, ensuring confidentiality, and answering questions raised by subjects. The questionnaire was pilot-tested among five drug users.
Size of Egocentric Social Networks
The Chinese Social Network Questionnaire (CSNQ) was used to define three types of social networks: support network, drug use network, and sex network [14,15] . To measure the size of an individual’s social network, name-generating questions were used to ask respondents (egos) to list, by giving their first names or pseudonyms, alters who could provide support in two supporting domains, e.g., emotional and tangible support. Each of the two support functions was operationalized with 3 items [16]. Respondents (egos) were asked to list alters who would provide tangible support, including 1) lending the ego $100 Chinese dollars (equivalent to US$15), accompanying the ego to see a doctor, or giving immediate help if the ego needed it; 2) taking care of the ego if the ego was confined to bed for 2 - 3 weeks; and 3) helping or advising the ego if the ego had problems regarding family or personal issues, or health concerns. Emotional support was measured by listing alters who would 1) agree with or support the ego’s actions or thought; 2) make the ego feel respected or admired; and 3) make the ego confide in the alter. These alters might be egos’ family members, friends, villagers, co-workers, drug users, sex partners, or others who could provide each of the two types of support. In addition, egos were asked to list individuals who were their sex partners (sex network) and individuals with whom they used drugs or shared injection equipment (drug use network). Information about alters’ demographics and behaviors were acquired through their egos. Depending on the size of subjects’ social network, it took 45 - 60 minutes to complete the social network questionnaire (CSNQ).
4. Analysis
We divided data analysis into two parts. We first used the standard RDS criteria to assess whether the RDS ample reached equilibrium. We then assessed if the random recruitment assumption held. The objective of RDS is to estimate unbiased population proportions of interest variables. If RDS is well designed and the random recruitment assumption holds, the RDS-estimated population proportions should be similar to the actual population proportions. Following this logic, we first calculated the population proportions of five visible variables among the total drug-use alters from which the RDS sample was drawn, and then estimated the RDS-adjusted population proportions and their 95% confidence intervals in the RDS sample. Theoretically, if the random recruitment assumption holds, the 95% confidence intervals estimated in the RDS sample should include the population proportions calculated in the total drug-use alters. In addition, a Rao-Scott chi-squared test was used to statistically test differences of the 5 variables between the RDS sample and the total drug-use alters [17]. In the RaoScott test, the RDS sample was weighted by the number of egos’ network sizes.
4.1. Assessment of Equilibrium in RDS Sample
Before the assessment of the random recruitment assumption, we checked whether the RDS sample reached equilibrium. Two criteria were used to check the status of equilibrium: the number of recruitment waves and tolerance. The Respondent Driven Sampling Analysis Tool (RDSAT, version 6.0.1, RDS Incorporated, Ithaca, NY) was used to estimate the required number of recruitment waves at which the RDS sample reached the equilibrium. The required number of recruitment waves was compared with the actual number of recruitment waves of the RDS sample. We then compared sample proportions and corresponding equilibrium proportions. If the absolute discrepancy between the two proportions falls within the tolerance of 0.02 or 0.03, it indicates that the sample stabilized to reach equilibrium [1]. RDSAT was also used to estimate sample proportions, proportions at equilibrium, and estimated population proportions of variables of interest and their 95% confidence intervals.
4.2. RDS Sample and Total Drug-Use Alters
RDS assumes that respondents randomly recruit alters from their personal networks [2]. For example, if an individual has 5 alters in his social network, he would, according to this assumption, recruit randomly 3 out of the 5 alters to participate into the study. In other words, the 3 peers could be considered as a “random sample” of this ego’s social network “population”. If this assumption holds, the overall RDS sample should be a weighted representative sample of the total alters in egos’ networks.
Since the sampling frame in which the RDS was drawn was defined as those who were young drug users aged between 18 - 35 years, we first excluded alters who did not meet the recruitment criteria of the RDS sample (e.g., excluding those who did not use illicit drugs or who were older than 35 years) from the total number of network alters.
Next, we compared the distributions of five visible variables that were measured in both egos and alters between the RDS sample and the total drug-use alters. We first calculated the population proportions of the 5 visible variables in the total drug-use alters, and then used the RDSAT to estimate the population proportions and their 95% confidence intervals in the RDS sample. In addition, a Rao-Scott chi-squared test was used to statistically weighted by the number of egos’ network sizes. For the purpose of this report, we selected five visible attributes that were test differences of the 5 variables between the RDS sample and the total drug-use alters [17]. In this test, the RDS sample was measured from both egos and alters: gender (male/female); age (18 - 25 years old/26 - 35 years old); education level (no school or primary school/ middle school, high school or college); marital status (single/married); and drug use mode (IDU/Non-IDU).
5. Results
A total of 426 subjects (egos), including 14 seeds, were recruited over a period of approximately 2 months. These egos reported a total of 3301 alters, with an average network size of about 8 (3301/426). Table 1 shows the diversity of seeds and their recruitments. Twelve seeds out of 14 successfully recruited other drug users. A total of 77 recruitment waves were generated by the 12 seeds, the average number of waves of about 6 (77/12). Two seeds, one male and one female, produced a recruitment chain longer than 10 waves and recruited 54% of the RDS sample. Figure 1 depicts the RDS recruitment of the seeds 1 - 4.
The RDSAT estimated that the largest number of recruitment waves at which equilibrium would be reached would be 6 (the trait of the age group). The largest actual recruitment wave in the RDS sample was 14, which was larger than the largest simulated one, thus satisfying the equilibrium requirement. Out of the 16 tolerance indexes, 14 had a value of 0.01 or less, and 2 had a value of 0.03, indicating that the bias introduced by the nonrandom selection might be gradually reduced, and the final RDS sample compositions converged to equilibrium (Table 2).
The population proportion estimates in Table 2 document that the majority of drug users were male, between the age of 25 to 35 years old, and single. The bulk of drug users received middle-school education or above, and were unemployed. About half of them were in the majority ethnicity (the Han). Forty percent of drug users were current injectors (Table 2).
In the comparisons of the 5 visible variables between the RDS sample and the total drug-use alters, the 14 RDS seeds were excluded from the analysis since they did not have a recruiter. In addition, 38 respondents referred more participants than the number of potential participants in their reported social networks and were thus excluded, and 7 could not be matched to their alters. The total subjects in the analysis were 367. Among the total number of alters that were nominated by the 367 egos, 1071 drug-use alters met the RDS recruitment criteria, e.g., who were drug users and between 18 - 35 years old. Therefore, the total drug-use alters (1071) was the sampling frame from which the RDS sample of 367 drug users was drawn.
The comparisons of the 5 visible variables were made between the RDS sample and the total drug-use alters (Table 3). The 95% confidence intervals of the RDSestimated population proportions of age, marital status, and drug use mode in the RDS sample cover the corresponding proportions calculated in the total drug-use alters, indicating that the differences between the RDSestimated population proportions and the corresponding proportions in the total drug-use alters were not statistically significant. The Rao-Scott chi-square tests, weighted by the number of egos’ network sizes, generated the same non-significant patterns.
However, the 95% confidence intervals of the RDSestimated proportions of gender and education (the proportion of drug users who had a high school or above) do not cover the corresponding proportions calculated in the total drug-use alters. The proportion differences between the RDS sample and the total drug-use alters were statistically significant in the Rao-Scott chi-square tests (Table 3). Specifically, male subjects or subjects receiving a high-school education or above were oversampled in the RDS sample.


Table 1. Characteristics of seeds and their recruitment.
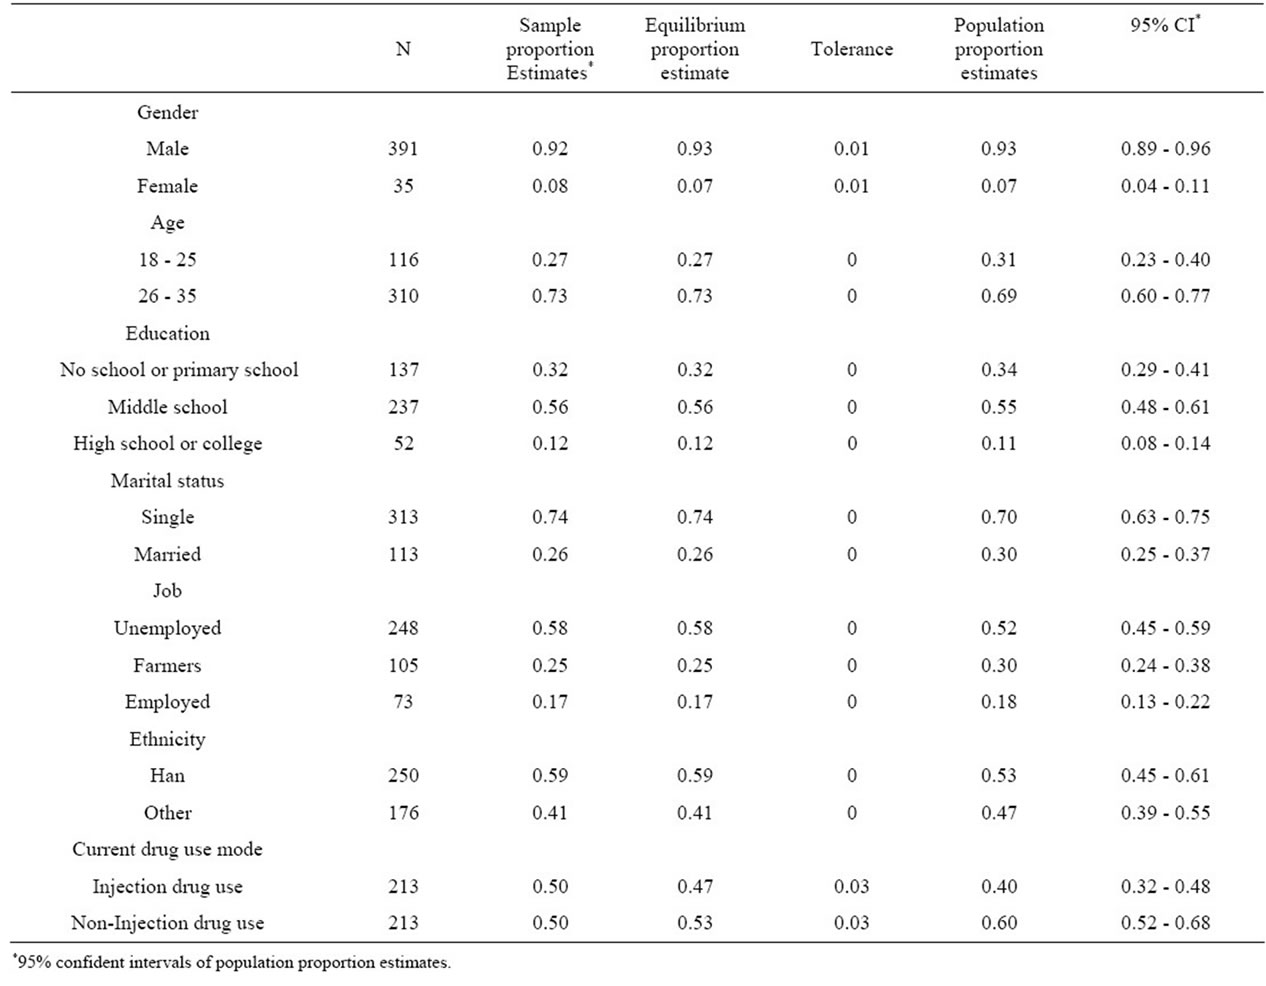
Table 2. Demographic characteristics of the study sample and RDS estimates.
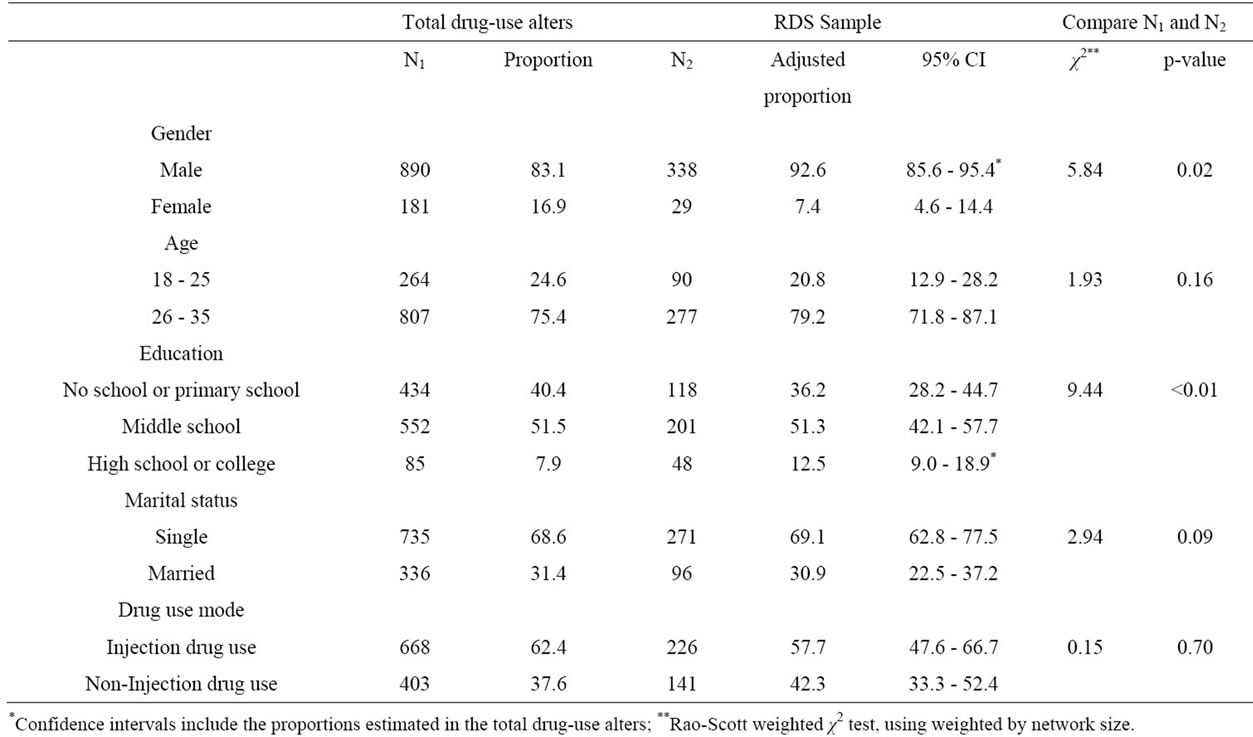
Table 3. Comparisons between the RDS sample and the total drug-use alters.
6. Discussion
Using empirical egocentric social network data, we assessed the random recruitment assumption in an actual RDS study. Our findings demonstrate the occurrence of non-random recruitment with respect to some variables, indicating that the recruitment of subjects in this RDS study was not completely at random. Specifically, male subjects or subjects receiving a high-school education or above were oversampled in the RDS sample. That is, male alters or alters with a higher education level had a higher probability of being invited by egos than females or alters with a lower education level.
In this RDS study, we found that males were oversampled from personal social networks, compared to the proportion of males in the total drug-use alters from which the RDS sample was drawn. The oversample of male subjects has been previously reported [9,10] . For example, in Wang and colleagues’ study, the proportion of male participants recruited by males was about 10.8% larger than the male proportions in the male’s personal networks [9] . The possible reason for the non-random recruitment by gender may be due to a gender preference and difference in frequency of contacts. The non-random recruitment by gender may be particularly strong among drug users because drug users tend to have more contact and interactions with male users. Therefore, male alters may be more likely to receive coupons from male or female egos. Consequently, the sampling fraction for cross-cutting ties (male vs. female) is not the same across subgroups.
While subjects who received a high school or college education were oversampled in the RDS sample, subjects who received no education or primary education were under sampled. This might be due to levels of trust since individuals tend to trust others who have higher status. In Chinese collectivist culture, people usually trust others who have a higher social rank [18,19]. Because recruiters receive additional incentives based on the number of alters they referred, they might want to avoid wasting their coupons and give them to those whom they believe would be most likely to participate into the study. However, future studies, especially qualitative studies [20,21] , are needed to explore the reasons for the non-random selection.
The assessment of the random recruitment assumption has been assessed by Gile and Handcock [22], Wejnert and Heckathorn [10], and Wang et al. [23]. Gile and Handcock assessed the consequences of the violation of this assumption in a simulation study. As pointed out by the authors, results of their simulations are specific to the set of parameters that they chose, and unlikely to apply directly to real RDS sampling settings. Wejnert and Heckathorn examined this assumption in a RDS sample of 150 undergraduates. Their RDS sample was drawn online, not through personal contacts. Since undergraduates are not a hidden population, it is unclear to what extent their findings can be applied to sampling hidden populations at the community level. Based on their RDS study among illicit stimulant drug users, Wang et al. tested this assumption in two group traits (gender and ethnicity) by comparing RDS sample recruitment patterns with self-reported personal network compositions. They found that white rural stimulant users and male users did not recruit randomly from their personal networks. Different from their studies, we assessed this assumption in an egocentric network study. That is, we used the detailed data for subjects’ network to directly compare network composition (e.g., the 5 group traits) obtained in the RDS sample to the personal network composition acquired from social network alters.
Caution should be mentioned when reporting and using the estimated population proportions of trait groups when the assumption of random recruitment does not hold for these groups. Nevertheless, a number of advantages of RDS remain in recruiting hidden populations. For example, the RDS sample is expected to include a broad cross-section of the hidden population. Samples that satisfy this modest goal may be treated as representative samples in data analyses [24]. In our study, the RDS sample covers various employment categories and includes subjects from remote areas or deeply-hidden subjects (e.g., governmental officers). Different from venue-based sampling, RDS relies on social networks and has the potential to reach individuals who do not participate in public venues [12,25] . Different from traditional chain-referral sampling, non random seed selection is necessary for RDS. The RDS sample compositions will converge and reach equilibrium within a limited number of recruitment waves [1]. In our study, the largest anticipated number of waves at which equilibrium was reached was 6. RDS is easier as well as less expensive to implement, compared with other sampling approaches [26]. In our study, approximately 2 months were spent in the recruitment of 426 young drug users.
Several limitations may be involved in this analysis. Although subjects were asked to recruit others from their social network alters, they might give recruitment coupons to people who were not in their networks. As we described previously, 38 egos invited more eligible subjects than their actual network size. However, the majority of subjects recruited others from their networks since they frequently contacted or sought social support from them. Although the size of the social network was defined by three types of networks (i.e., support network, drug-use network, and sex network), it is possible that subjects could not report all alters in the three different networks. As a result, the reported size of the social network may be smaller than the actual size. Since the under-reporting of social network size may be non-differential across comparison groups, the bias may not be substantial. The RDSAT estimated 95% confidence intervals for proportions have been shown to produce confidence intervals that are too small [8,27,28] . If the RDS estimated confidence intervals were wider, the apparent non-random recruitment might not be statistically detectable given this sample size (Table 3). However, the actual differences in the two compared proportions are substantial, for example, 83% male drug users in the total drug-use alters and 93% in the RDS sample. In addition, the network size-weighted Rao-Scott tests generated similar results as the RDS estimated 95% confidence intervals do.
7. Conclusion
The contribution of this report to RDS is the assessment of the random recruitment assumption in empirical social network data. Our study demonstrates the occurrence of non-random recruitment with respect to some variables, indicating that the recruitment of subjects in this RDS study was not completely at random. Future studies are needed in order to assess the extent to which the population proportion estimates can be biased when the violation of the assumption occurs in RDS samples and to investigate practical approaches to reduce or prevent this violation. If the basis is substantial, innovative approaches need to be developed to account for the unequal probability of recruitment within personal networks so that bias in population estimates caused by the non-random recruitment can be reduced.
8. Acknowledgements
This work was supported by a research grant (R21 DA023893-01A1) from the NIH-NIDA. We are grateful to the staff from Yunnan institute of Drug Abuse for participation in the study and to all the participants who gave so willingly of their time to provide the study data.
REFERENCES
- D. D. Heckathorn, “Respondent-Driven Sampling: A New Approach to the Study of Hidden Populations,” Social Problems, Vol. 44, No. 2, 1997, pp. 174-199. doi:10.2307/3096941
- E. Volz and D. D. Heckathorn, “Probability Based Estimation Theory for Respondent Driven Sampling,” Journal of Official Statistics, Vol. 24, No. 1, 2008, pp. 79-97.
- R. Magnani, K. Sabin, T. Saidel and D. Heckathorn, “Review of Sampling Hard-to-Reach and Hidden Populations for HIV Surveillance,” AIDS, Vol. 19, Suppl. 2, 2005, S67-S72. doi:10.1097/01.aids.0000172879.20628.e1
- W. T. Robinson, J. M. Risser, S. McGoy, A. B. Becker, H. Rehman, M. Jefferson, V. Griffin, M. Wolverton and S. Tortu, “Recruiting Injection Drug Users: A Three-Site Comparison of Results and Experiences with Respondent-Driven and Targeted Sampling Procedures,” Journal of Urban Health, Vol. 83, Suppl. 1, 2006, 29-38. doi:10.1007/s11524-006-9100-3
- C. McKnight, D. Des Jarlais, H. Bramson, L. Tower, A. S. Abdul-Quader, C. Nemeth and D. Heckathorn, “Respondent-Driven Sampling in a Study of Drug Users in New York City: Notes from the Field,” Journal of Urban Health, Vol. 83, Suppl. 1, 2006, 54-59. doi:10.1007/s11524-006-9102-1
- L. G. Johnston, M. Malekinejad, C. Kendall, I. M. Iuppa and G. W. Rutherford, “Implementation Challenges to Using Respondent-Driven Sampling Methodology for HIV Biological and Behavioral Surveillance: Field Experiences in International Settings,” AIDS and Behavior, Vol. 12, Suppl. 1, 2008, 131-141. doi:10.1007/s10461-008-9413-1
- C. Wejnert, “Social Network Analysis with RespondentDriven Sampling Data: A Study of Racial Integration on Campus,” Social Networks, Vol. 32, No. 2, 2010, pp. 112- 124. doi:10.1016/j.socnet.2009.09.002
- S. Goel and M. J. Salganik, “Respondent-Driven Sampling as Markov Chain Monte Carlo,” Statistics in Medicine, Vol. 28, No. 17, 2009, pp. 2202-2229. doi:10.1002/sim.3613
- J. C. Wang, R. S. Falck, L. N. Li, A. Rahman and R. G. Carlson, “Respondent-Driven Sampling in the Recruitment of Illicit Stimulant Drug Users in a Rural Setting: Findings and Technical Issues,” Addictive Behaviors, Vol. 32, No. 5, 2007, pp. 924-937. doi:10.1016/j.addbeh.2006.06.031
- C. Wejnert and D. D. Heckathorn, “Web-Based Network Sampling: Efficiency and Efficacy of Respondent-Driven Sampling for Online Research,” Sociological Methods Research, Vol. 37, No. 1, 2008, pp. 105-134.
- R. Heimer, “Critical Issues and Further Questions about Respondent-Driven Sampling: Comment on RamirezValles, et al. (2005),” AIDS and Behavior, Vol. 9, No. 4, 2005, pp. 403-408. doi:10.1007/s10461-005-9030-1
- M. J. Salganik and D. D. Heckathorn, “Sampling and Estimation in Hidden Populations Using RespondentDriven Sampling,” Sociological Methodology, Vol. 34, No. 1, 2004, pp. 193-239. doi:10.1111/j.0081-1750.2004.00152.x
- N. Koram, H. J. Liu, J. Li, J. Luo and J. Nield, “Role of Social Network Dimensions in the Transition to Injection Drug Use: Actions Speak Louder than Words,” AIDS and Behavior, Vol. 15, No. 7, 2011, pp. 1579-1588. doi:10.1007/s10461-011-9930-1
- H. J. Liu, T. J. Feng, H. Liu, H. C. Feng, Y. M. Cai, A. G. Rhodes and O. Grusky, “Egocentric Networks of Chinese Men Who Have Sex with Men: Network Components, Condom Use Norms and Safer Sex,” AIDS Patient Care and STDS, Vol. 23, No. 10, 2009, pp. 885-893. doi:10.1089/apc.2009.0043
- J. Li, H. J. Liu, J. H. Li, J. Luo, N. Koram and R. Detels, “Sexual Transmissibility of HIV among Opiate Users with Concurrent Sexual Partnerships: An Egocentric Network Study in Yunnan, China,” Addiction, Vol. 106, No. 10, 2011, pp. 1780-1787. doi:10.1111/j.1360-0443.2011.03459.x
- J. S. Norbeck, A. M. Lindsey and V. L. Carrieri, “Further Development of the Norbeck Social Support Questionnaire: Normative Data and Validity Testing,” Nursing Research, Vol. 32, No. 1, 1983, pp. 4-9.
- S. G. Heeringa, B. T. West and P. A. Berglund, “Applied Survey Data Analysis,” CRC Press, New York, 2010. doi:10.1201/9781420080674
- P. Smith and Z. Wang, “Chinese Leadership and Organizational Structures,” In: M. Bond, Eds., Chinese Psychology, Oxford University Press, Hong Kong, 1996, pp. 322-337.
- D. F. Dien, “Chinese Authority-Directed Orientation and Japanese Peer-Group Orientation: Questioning the Notion of Collectivism,” Review of General Psychology, Vol. 3, No. 4, 1999, pp. 372-385. doi:10.1037/1089-2680.3.4.372
- G. Scott, “‘They Got Their Program, and I Got Mine’: A Cautionary Tale Concerning the Ethical Implications of Using Respondent-Driven Sampling to Study Injection Drug Users,” International Journal of Drug Policy, Vol. 19, No. 1, 2008, pp. 42-51. doi:10.1016/j.drugpo.2007.11.014
- L. J. Ouellet, “Cautionary Comments on an Ethnographic Tale Gone Wrong,” International Journal of Drug Policy, Vol. 19, No. 3, 2008, pp. 238-240. doi:10.1016/j.drugpo.2008.02.013
- K. J. Gile and M. S. Handcock, “Respondent-Driven Sampling: An Assessment of Current Methodology,” Sociological Methodology, Vol. 40, No. 1, 2010, pp. 285- 327. doi:10.1111/j.1467-9531.2010.01223.x
- J. C. Wang, R. G. Carlson, R. S. Falck, H. A. Siegal, A. Rahman and L. N. Li, “Respondent-Driven Sampling to Recruit MDMA Users: A Methodological Assessment,” Drug and Alcohol Dependence, Vol. 78, No. 2, 2005, pp. 147-157. doi:10.1016/j.drugalcdep.2004.10.011
- M. Spreen and R. Zwaagstra, “Personal Network Sampling, Outdegree Analysis and Multilevel Analysis: Introducing the Network Concepts in Studies of Hidden Populations,” International Sociology, Vol. 9, No. 4, 1994, pp. 475-491. doi:10.1177/026858094009004006
- L. G. Johnston, K. Sabin, T. H. Mai and T. H. Pham, “Assessment of Respondent Driven Sampling for Recruiting Female Sex Workers in Two Vietnamese Cities: Reaching the Unseen Sex Worker,” Journal of Urban Health, Vol. 83, Suppl. 1, 2006, pp. 16-28. doi:10.1007/s11524-006-9099-5
- S. Semaan, J. Lauby and J. Liebman, “Street and Network Sampling in Evaluation Studies of HIV Risk-Reduction Interventions,” AIDS Reviews, Vol. 4, No. 4, 2002, pp. 213-223.
- M. J. Salganik, “Variance Estimation, Design Effects, and Sample Size Calculations for Respondent-Driven Sampling,” Journal of Urban Health, Vol. 83, Suppl. 1, 2006, pp. 98-112. doi:10.1007/s11524-006-9106-x
- S. Goel and M. J. Salganik, “Assessing RespondentDriven Sampling,” Proceedings of National Academy of Science of the United States of America, Vol. 107, No. 15, 2010, pp. 6743-6747. doi:10.1073/pnas.1000261107
List of Abbreviations
RDS = pondent-driven sampling; STIs = ually transmitted infections; CSNQ = nese Social Network Questionnaire; RDSAT = pondent Driven Sampling Analysis Tool; IDU = ection drug user.
NOTES
*Competing interests: The authors have no competing interests to declare. Authors’ contributions: HJL and JHL designed and participated in the study. HJL, TH and JL analyzed the data. HJL wrote the manuscript.